Strategy vault / Trend following
Trend Structure Break with Order Block and Fair Value Gap Strategy
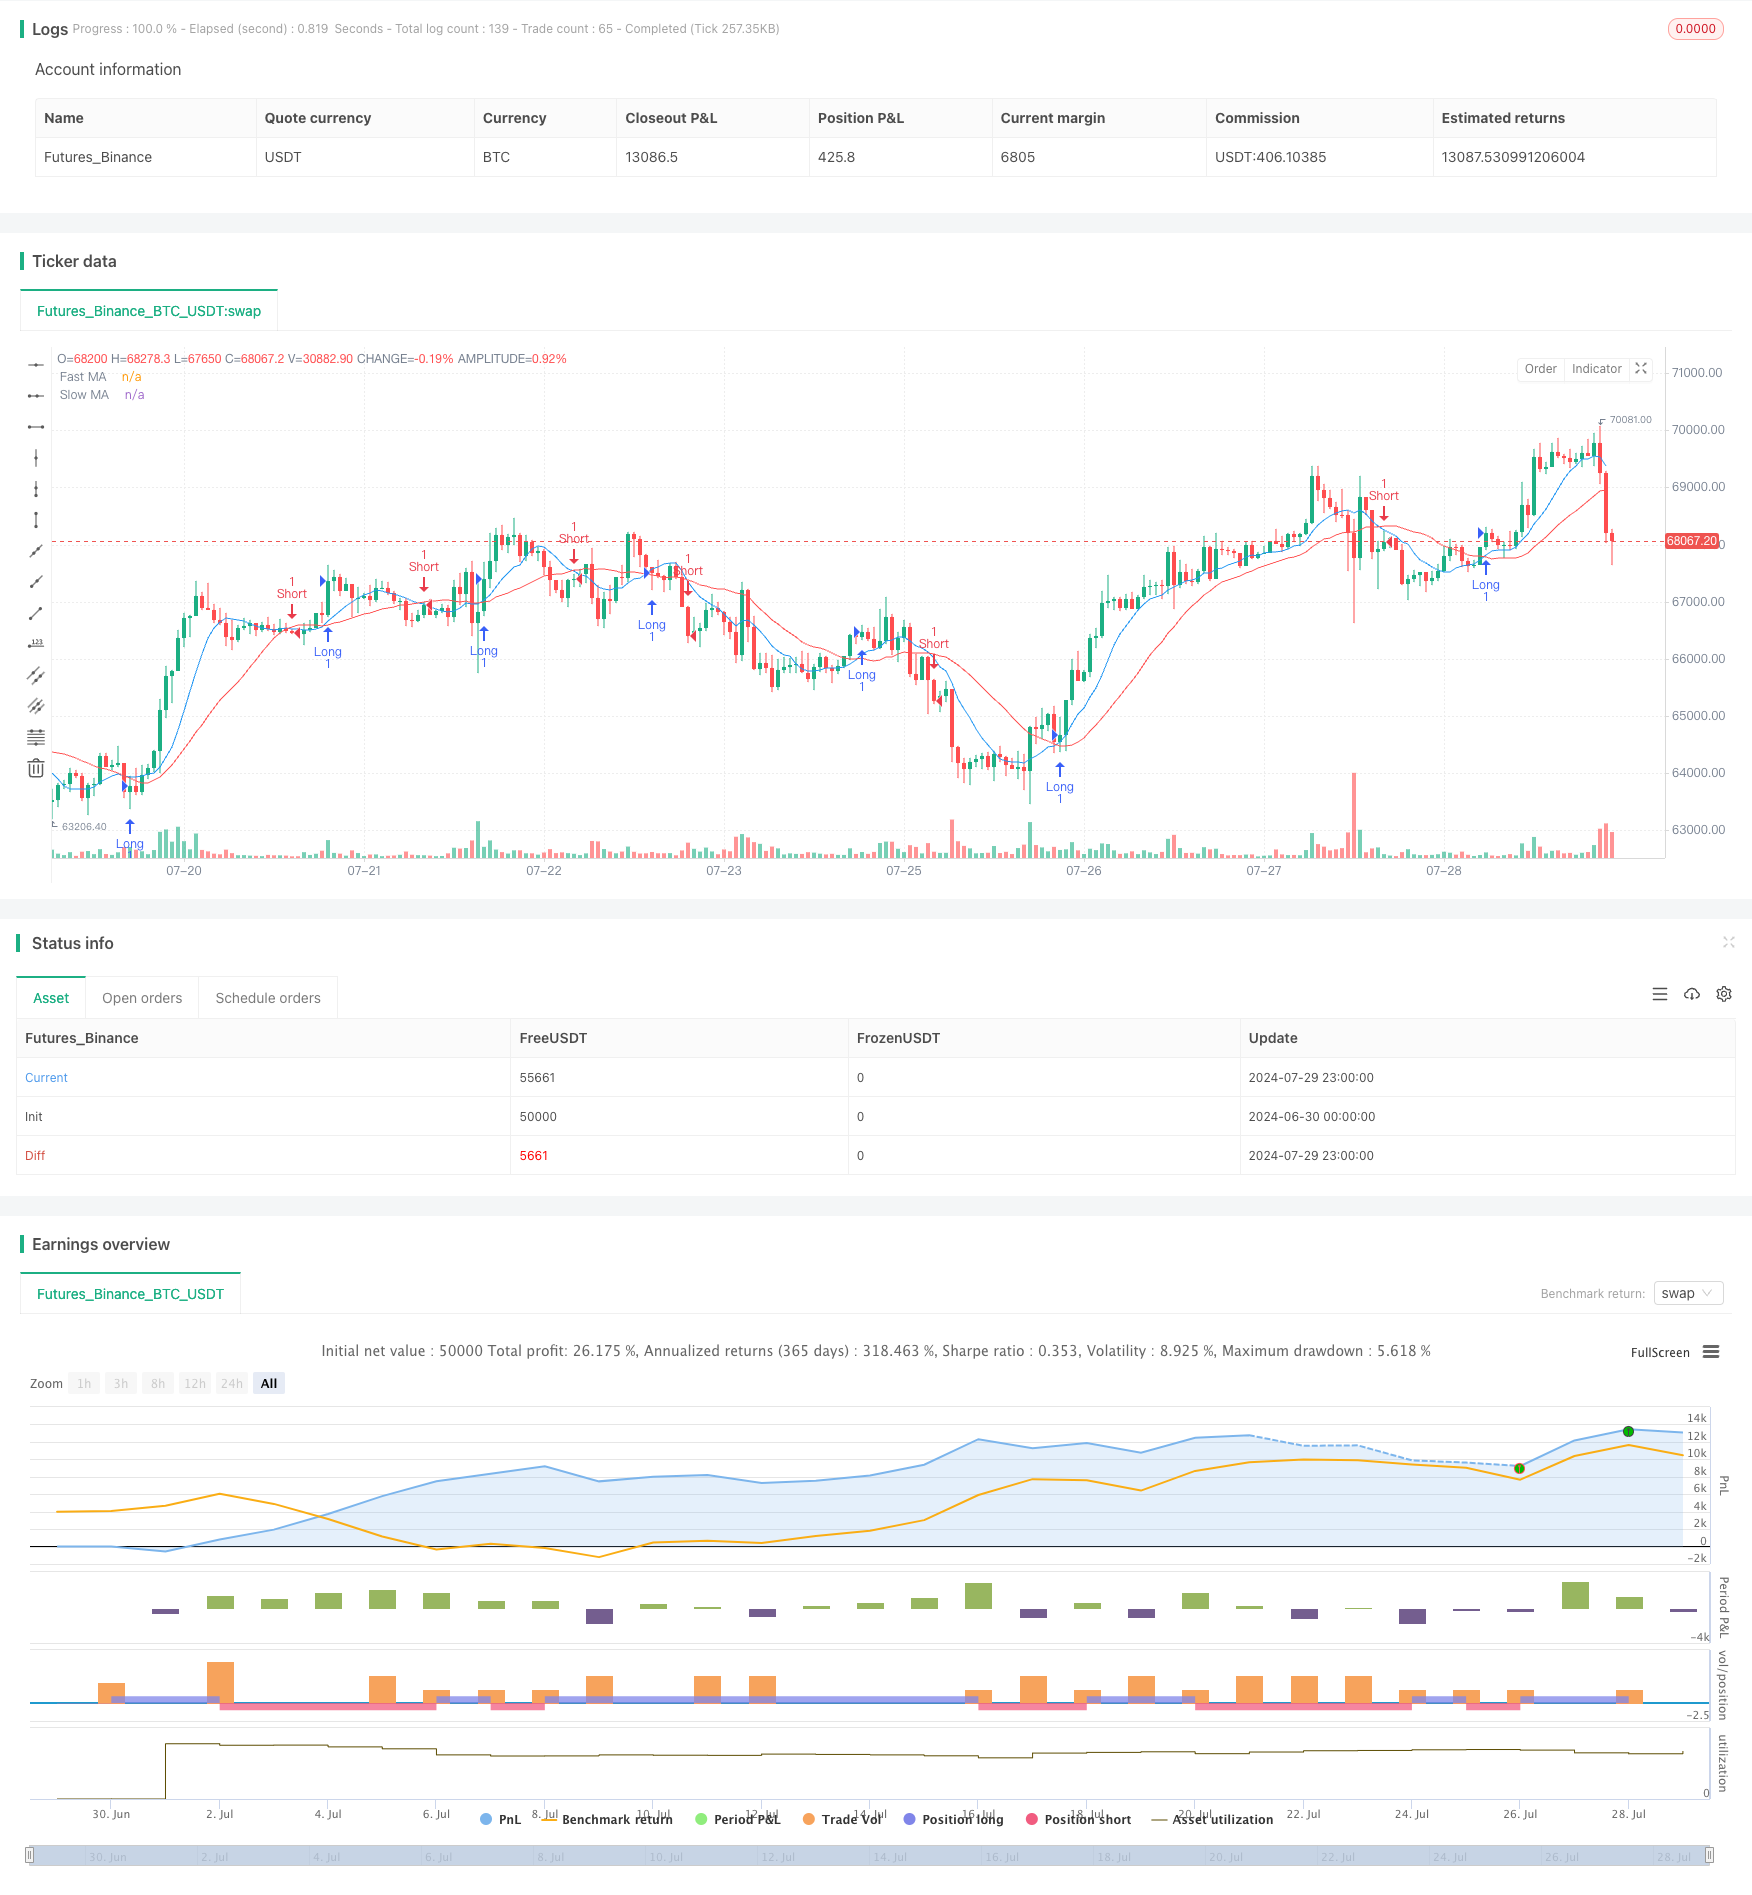
This strategy is a comprehensive trading system that combines trend following, structure breakouts, order blocks, and fair value gaps. It uses fast and slow moving averages to determine market trends while looking…
Overview
This strategy is a comprehensive trading system that combines trend following, structure breakouts, order blocks, and fair value gaps. It uses fast and slow moving averages to determine market trends while looking for breakout points in price structure. Additionally, the strategy identifies significant order blocks and fair value gaps, which are potential support and resistance areas. By integrating these technical analysis concepts, the strategy aims to capture strong market movements while providing additional trading signals at key price levels.
Strategy Principles
Trend Identification: Uses 9-period and 21-period Simple Moving Averages (SMA) to determine market trends. A bullish trend is identified when the fast SMA is above the slow SMA, and vice versa for bearish trends.
Break of Structure (BOS): The strategy tracks the highest high and lowest low over 10 periods. When price breaks these levels, it's considered a structure break and is marked with a label.
Order Blocks: When a structure break occurs, the strategy identifies potential order blocks. These areas are seen as significant supply and demand zones that may act as support or resistance in the future.
Fair Value Gaps (FVG): When price breaks out rapidly, the strategy identifies potential fair value gaps. These gaps are considered areas where the market might retrace to fill.
Entry Signals: The strategy uses crossovers of the fast and slow moving averages to generate entry signals. A long signal is triggered when the fast MA crosses above the slow MA, and a short signal when the fast MA crosses below the slow MA.
Strategy Advantages
Multi-dimensional Analysis: The strategy combines multiple technical analysis concepts, providing a more comprehensive market perspective to make informed trading decisions.
Trend Following and Reversal: By combining moving averages and structure breaks, the strategy can both follow major trends and capture potential reversal opportunities.
Key Price Level Identification: The concepts of order blocks and fair value gaps help traders identify important support and resistance levels that may influence future price movements.
Visualization Tools: The strategy uses labels, boxes, and lines to visualize key information, allowing traders to quickly understand market structure.
Flexibility: With adjustable parameters such as moving average periods and thresholds, the strategy can be adapted to different market conditions and trading styles.
Strategy Risks
False Breakouts: In volatile markets, false breakouts may occur, leading to incorrect trading signals.
Lagging Indicators: Moving averages are inherently lagging indicators and may not react quickly enough in fast-changing markets.
Over-reliance on Technical Indicators: Relying solely on technical indicators while ignoring fundamental analysis may lead to poor decisions during significant economic events or news releases.
Parameter Sensitivity: The strategy's performance may be highly sensitive to input parameters, requiring careful optimization and backtesting.
Lack of Stop-Loss Mechanism: The current strategy doesn't have an explicit stop-loss mechanism, which could lead to large losses in adverse market conditions.
Strategy Optimization Directions
Introduce Dynamic Stop-Loss: Consider adding a dynamic stop-loss mechanism based on ATR or recent volatility to better manage risk.
Incorporate Volume Analysis: Integrating volume indicators can help confirm trend strength and breakout validity.
Optimize Entry Timing: Consider adding additional filter conditions, such as RSI or MACD, on top of moving average crossovers to reduce false signals.
Backtest Different Timeframes: Test the strategy on different timeframes to find the best-performing settings.
Add Fundamental Filters: Consider integrating some fundamental indicators or economic calendar to avoid trading before and after important news releases.
Improve Order Block and FVG Logic: More sophisticated algorithms could be employed to identify more accurate order blocks and fair value gaps.
Implement Partial Profit Taking: Consider partial position closing when certain profit targets are reached to lock in profits and reduce drawdowns.
Summary
The "Trend Structure Break with Order Block and Fair Value Gap Strategy" is a comprehensive technical analysis trading system that combines multiple advanced trading concepts. By integrating trend following, structure breakouts, order blocks, and fair value gaps, the strategy provides a holistic framework for market analysis. Its strengths lie in its multi-dimensional market insights and flexible parameter settings, allowing it to adapt to different market environments. However, like all trading strategies, it faces risks such as false breakouts and over-reliance on technical indicators. Through the introduction of dynamic stop-losses, integration of volume analysis, and optimization of entry logic, the strategy has the potential to further improve its performance and robustness. For traders looking to build a comprehensive trading system based on technical analysis, this strategy provides an excellent starting point and framework.
Source Pine Script
/*backtest
start: 2024-06-30 00:00:00
end: 2024-07-30 00:00:00
period: 1h
basePeriod: 15m
exchanges: [{"eid":"Futures_Binance","currency":"BTC_USDT"}]
*/

//@version=5
strategy("Trend and Structure Break Strategy", overlay=true)

// Inputs for the moving averages to determine trend
fastLength = input.int(9, title="Fast MA Length")
slowLength = input.int(21, title="Slow MA Length")

// Inputs for the order block and fair value gap
orderBlockThreshold = input.float(0.1, title="Order Block Threshold (%)")
fvgThreshold = input.float(0.5, title="Fair Value Gap Threshold (%)")

// Calculate moving averages
fastMA = ta.sma(close, fastLength)
slowMA = ta.sma(close, slowLength)

// Determine trend
isBullishTrend = fastMA > slowMA
isBearishTrend = fastMA < slowMA

// Break of structure
var float highestHigh = na
var float lowestLow = na

if isBullishTrend
    highestHigh := ta.highest(high, 10)
    if close > highestHigh
        label.new(bar_index, high, "BOS Up", style=label.style_label_down, color=color.green)
if isBearishTrend
    lowestLow := ta.lowest(low, 10)
    if close < lowestLow
        label.new(bar_index, low, "BOS Down", style=label.style_label_up, color=color.red)

// Identify order block
var float orderBlockHigh = na
var float orderBlockLow = na

if isBullishTrend and close > highestHigh
    orderBlockHigh := highestHigh
    orderBlockLow := close * (1 - orderBlockThreshold / 100)
    box.new(left=bar_index - 1, right=bar_index, top=orderBlockHigh, bottom=orderBlockLow, bgcolor=color.new(color.green, 80))

if isBearishTrend and close < lowestLow
    orderBlockLow := lowestLow
    orderBlockHigh := close * (1 + orderBlockThreshold / 100)
    box.new(left=bar_index - 1, right=bar_index, top=orderBlockHigh, bottom=orderBlockLow, bgcolor=color.new(color.red, 80))

// Identify fair value gap
var line fvgLine1 = na
var line fvgLine2 = na
var line fvgLine3 = na

if isBullishTrend and ta.crossover(close, highestHigh)
    fvgLine1 := line.new(x1=bar_index, y1=high, x2=bar_index + 1, y2=high, color=color.blue)
    fvgLine2 := line.new(x1=bar_index, y1=high * (1 - fvgThreshold / 100), x2=bar_index + 1, y2=high * (1 - fvgThreshold / 100), color=color.blue)
    fvgLine3 := line.new(x1=bar_index, y1=high * (1 - fvgThreshold / 100 * 2), x2=bar_index + 1, y2=high * (1 - fvgThreshold / 100 * 2), color=color.blue)

if isBearishTrend and ta.crossunder(close, lowestLow)
    fvgLine1 := line.new(x1=bar_index, y1=low, x2=bar_index + 1, y2=low, color=color.blue)
    fvgLine2 := line.new(x1=bar_index, y1=low * (1 + fvgThreshold / 100), x2=bar_index + 1, y2=low * (1 + fvgThreshold / 100), color=color.blue)
    fvgLine3 := line.new(x1=bar_index, y1=low * (1 + fvgThreshold / 100 * 2), x2=bar_index + 1, y2=low * (1 + fvgThreshold / 100 * 2), color=color.blue)

// Entry and exit signals
if (ta.crossover(fastMA, slowMA))
    strategy.entry("Long", strategy.long)

if (ta.crossunder(fastMA, slowMA))
    strategy.entry("Short", strategy.short)

// Plot moving averages
plot(fastMA, color=color.blue, title="Fast MA")
plot(slowMA, color=color.red, title="Slow MA")Published by ChaoZhang on the FMZ strategy square · last modified 2024-07-31. Collected in the Quant Trading Vault. Unvalidated research: re-test with your own data and costs before trusting it.
Build this with AgenKit
A spec is not a trading system. Paste this into your coding agent and AgenKit runs a specialist team — architecture, test-first build, risk gates, review — with paper trading on by default.
/agenkit build a production-grade trading bot with a backtest engine, risk controls and paper trading by default from strategies/Trend-Structure-Break-with-Order-Block-and-Fair-Value-Gap-Strategy.md- npx agenkit install engineering-kit in your project
- Paste the command into your agent and approve each phase
- Get tests, backtest, risk controls and a paper-trading switch
Understand it first
Before you run this, read the lesson behind the idea and how to backtest it honestly. Specs like this one are the survivors of an unknown number of trials; deflate their results accordingly.
Related specs
- Bollinger Bands Precise Crossover Quantitative StrategyPine Script · Trend following · 1h
- Comprehensive Trading System Combining SMA Crossover Strategy with Fair Value Gap PullbackPine Script · Trend following · 1d
- Dual Moving Average Trend Following System with Adaptive Dynamic Filtering StrategyPine Script · Trend following · 30m
- EMA AROON ASHPine Script · Trend following · 3m
- EMA SMA Trend Following with Swing Trading Strategy Combined Volume Filter and Percentage Take Profit Stop Loss SystemPine Script · Trend following · 1d
- Fixed Range Volume Profile And Anchored VWAP Trend Identification Strategy With Dynamic Stop LossPine Script · Trend following · 1h