Strategy vault / Trend following
Trend Tracking Moving Average Crossover Strategy
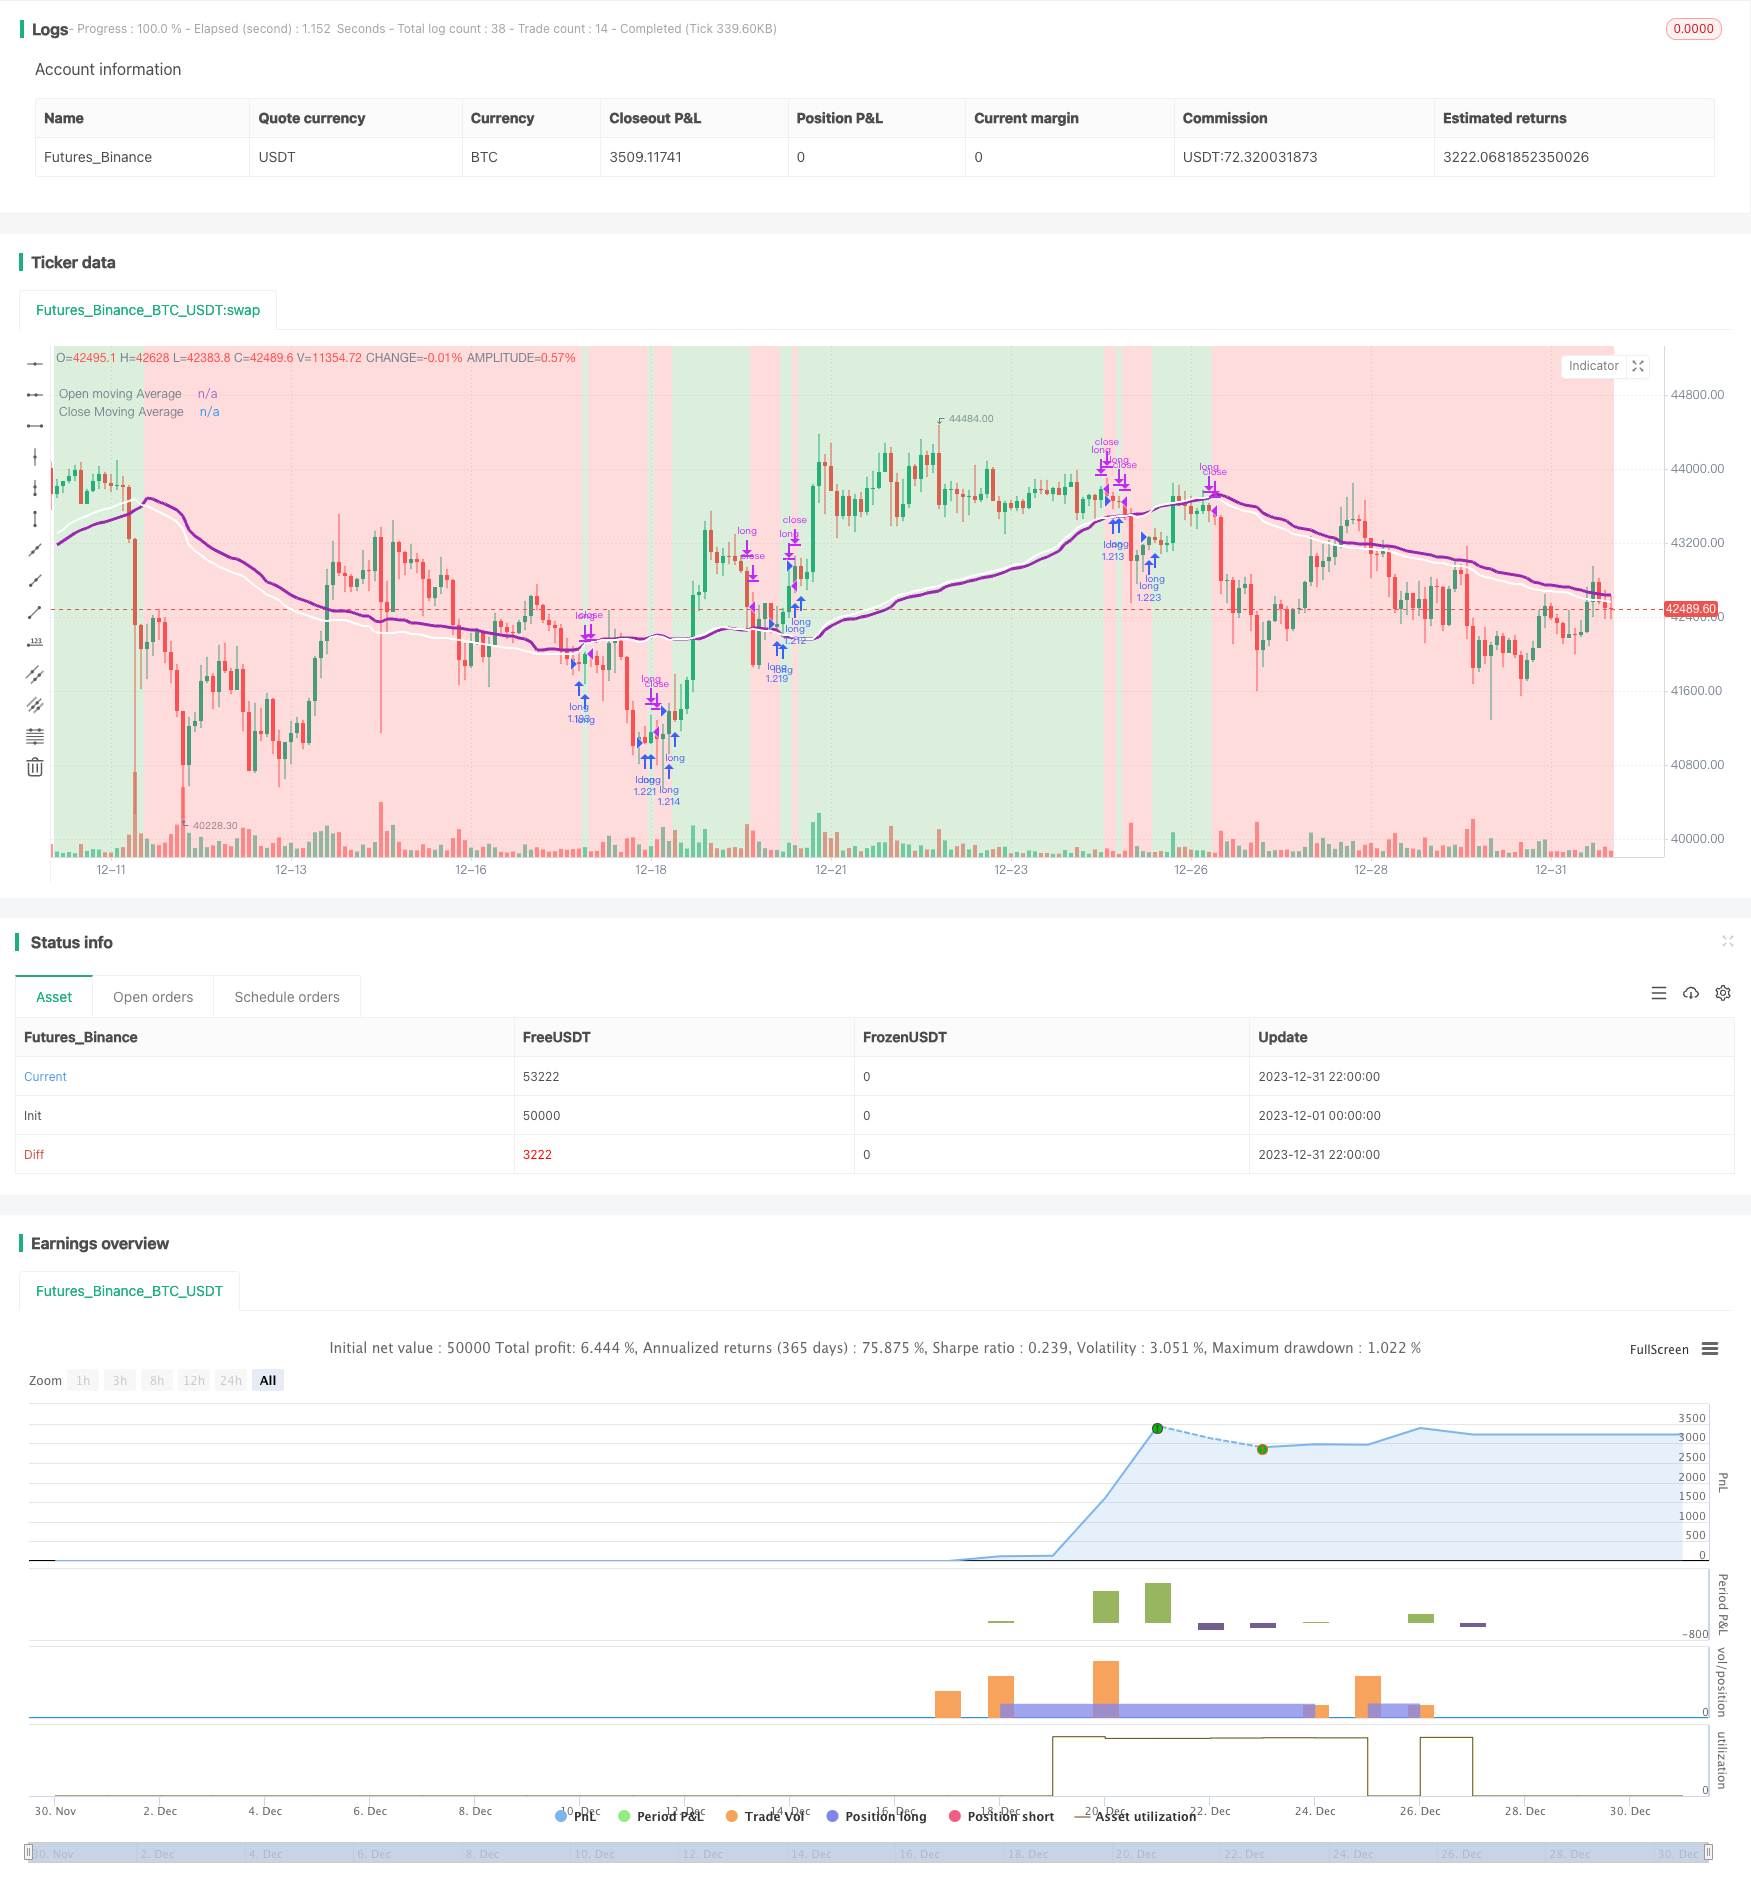
This is a simple moving average based strategy that works well with different coin pairs. It plots the moving average opening price and closing price, and decides to enter a long position or exit it based on whether…
Overview
This is a simple moving average based strategy that works well with different coin pairs. It plots the moving average opening price and closing price, and decides to enter a long position or exit it based on whether the two lines have crossed each other. The idea is that it enters a position when the average closing price is increasing, which may indicate upward momentum in prices. It then exits the position when the average closing price decreases, which may indicate downward momentum. This is speculative, but sometimes it can predict price action very well.
Strategy Logic
This strategy first selects the type of moving average, including EMA, SMA, RMA, WMA and VWMA. Then it sets the lookback period for the moving average, usually between 10 and 250 bars. Different combinations of moving average type and lookback period can produce very different results for different coin pairs.
The specific trading logic is:
- Calculate the moving average of open price and close price;
- Compare the moving average values between close price and open price;
- Enter a long position if close price moving average crosses above open price moving average;
- Close the long position if close price moving average crosses below open price moving average.
Entering the position considers it a sign of upward price movement, while exiting considers downward price movement.
Advantage Analysis
The main advantages of this strategy are:
- Flexible parameter settings that can be optimized for different coin pairs for better specificity;
- Simple logic that is easy to understand and implement;
- Very high returns achievable for some coin pairs, generally good stability;
- High customizability in displaying different indicators.
Risk Analysis
There are also some risks with this strategy:
- For some coin pairs and parameters, returns and stability can be low;
- Cannot respond well to short-term price fluctuations, poor performance for high volatile coins;
- Choice of moving average lookback period not scientific enough, somewhat subjective.
Solutions and optimization:
- Use longer timeframes like 12H, 1D to reduce unnecessary trades and improve stability;
- Add parameter optimization functions to automatically test different parameter combinations for best parameters;
- Add adaptive selection of moving average lookback period to let system automatically decide optimal period.
Conclusion
In summary, this is a simple strategy using moving average indicators to determine price trend and inflection points. It can achieve very good results by adjusting parameters, and is an effective trend tracking strategy worth further improvement and application. But risk management should be noted, choose suitable coin pairs and parameters to maximize its usefulness.
Parameters
| Name | Default | What it controls |
|---|---|---|
| v_input_int_1 | 66 | (?Strategy)Moving average length (number of bars) |
| v_input_string_1 | 0 | Moving Average type: VWMA | SMA | RMA | WMA | EMA |
| v_input_string_2 | 0 | (?Display)Red Background Color On/Off: On | Off |
| v_input_string_3 | 0 | Green Background Color On/Off: On | Off |
| v_input_string_4 | 0 | Moving Average Plot On/Off: On | Off |
| v_input_int_2 | true | (?Beginning of Strategy)Start Month 1-12 (set any start time to 0 for furthest date) |
| v_input_int_3 | true | Start Date 1-31 (set any start time to 0 for furthest date) |
| v_input_int_4 | 2011 | Start Year 2000-2100 (set any start time to 0 for furthest date) |
| v_input_int_5 | false | (?End of Strategy)End Month 1-12 (set any end time to 0 for today's date) |
| v_input_int_6 | false | End Date 1-31 (set any end time to 0 for today's date) |
| v_input_int_7 | false | End Year 2000-2100 (set any end time to 0 for today's date) |
Source Pine Script
/*backtest
start: 2023-12-01 00:00:00
end: 2023-12-31 23:59:59
period: 2h
basePeriod: 15m
exchanges: [{"eid":"Futures_Binance","currency":"BTC_USDT"}]
*/

//@version=5
//Author @divonn1994

initial_balance = 100
strategy(title='Close v Open Moving Averages Strategy', shorttitle = 'Close v Open', overlay=true, pyramiding=0, default_qty_value=100, default_qty_type=strategy.percent_of_equity, precision=7, currency=currency.USD, commission_value=0.1, commission_type=strategy.commission.percent, initial_capital=initial_balance)

//Input for number of bars for moving average, Switch to choose moving average type, Display Options and Time Frame of trading----------------------------------------------------------------

bars = input.int(66, "Moving average length (number of bars)", minval=1, group='Strategy') //66 bars and VWMA for BTCUSD on 12 Hours.. 35 bars and VWMA for BTCUSD on 1 Day
strategy = input.string("VWMA", "Moving Average type", options = ["EMA", "SMA", "RMA", "WMA", "VWMA"], group='Strategy')

redOn = input.string("On", "Red Background Color On/Off", options = ["On", "Off"], group='Display')
greenOn = input.string("On", "Green Background Color On/Off", options = ["On", "Off"], group='Display')
maOn = input.string("On", "Moving Average Plot On/Off", options = ["On", "Off"], group='Display')

startMonth = input.int(title='Start Month 1-12 (set any start time to 0 for furthest date)', defval=1, minval=0, maxval=12, group='Beginning of Strategy')
startDate = input.int(title='Start Date 1-31 (set any start time to 0 for furthest date)', defval=1, minval=0, maxval=31, group='Beginning of Strategy')
startYear = input.int(title='Start Year 2000-2100 (set any start time to 0 for furthest date)', defval=2011, minval=2000, maxval=2100, group='Beginning of Strategy')

endMonth = input.int(title='End Month 1-12 (set any end time to 0 for today\'s date)', defval=0, minval=0, maxval=12, group='End of Strategy')
endDate = input.int(title='End Date 1-31 (set any end time to 0 for today\'s date)', defval=0, minval=0, maxval=31, group='End of Strategy')
endYear = input.int(title='End Year 2000-2100 (set any end time to 0 for today\'s date)', defval=0, minval=0, maxval=2100, group='End of Strategy')

//Strategy Calculations-----------------------------------------------------------------------------------------------------------------------------------------------------------------------

inDateRange = true

maMomentum = switch strategy
    "EMA" => (ta.ema(close, bars) > ta.ema(open, bars)) ? 1 : -1
    "SMA" => (ta.sma(close, bars) > ta.sma(open, bars)) ? 1 : -1
    "RMA" => (ta.rma(close, bars) > ta.rma(open, bars)) ? 1 : -1
    "WMA" => (ta.wma(close, bars) > ta.wma(open, bars)) ? 1 : -1
    "VWMA" => (ta.vwma(close, bars) > ta.vwma(open, bars)) ? 1 : -1
    =>
        runtime.error("No matching MA type found.")
        float(na)

openMA = switch strategy
    "EMA" => ta.ema(open, bars)
    "SMA" => ta.sma(open, bars)
    "RMA" => ta.rma(open, bars)
    "WMA" => ta.wma(open, bars)
    "VWMA" => ta.vwma(open, bars)
    =>
        runtime.error("No matching MA type found.")
        float(na)

closeMA = switch strategy
    "EMA" => ta.ema(close, bars)
    "SMA" => ta.sma(close, bars)
    "RMA" => ta.rma(close, bars)
    "WMA" => ta.wma(close, bars)
    "VWMA" => ta.vwma(close, bars)
    =>
        runtime.error("No matching MA type found.")
        float(na)

//Enter or Exit Positions--------------------------------------------------------------------------------------------------------------------------------------------------------------------

if ta.crossover(maMomentum, 0)
    if inDateRange
        strategy.entry('long', strategy.long, comment='long')
if ta.crossunder(maMomentum, 0)
    if inDateRange
        strategy.close('long')

//Plot Strategy Behavior---------------------------------------------------------------------------------------------------------------------------------------------------------------------

plot(series = maOn == "On" ? openMA : na, title = "Open moving Average", color = color.new(color.purple,0), linewidth=3, offset=1)
plot(series = maOn == "On" ? closeMA : na, title = "Close Moving Average", color = color.new(color.white,0), linewidth=2, offset=1)
bgcolor(color = inDateRange and (greenOn == "On") and maMomentum > 0 ? color.new(color.green,75) : inDateRange and (redOn == "On") and maMomentum <= 0 ? color.new(color.red,75) : na, offset=1)Published by ChaoZhang on the FMZ strategy square · last modified 2024-01-29. Collected in the Quant Trading Vault. Unvalidated research: re-test with your own data and costs before trusting it.
Build this with AgenKit
A spec is not a trading system. Paste this into your coding agent and AgenKit runs a specialist team — architecture, test-first build, risk gates, review — with paper trading on by default.
/agenkit build a production-grade trading bot with a backtest engine, risk controls and paper trading by default from strategies/Trend-Tracking-Moving-Average-Crossover-Strategy.md- npx agenkit install engineering-kit in your project
- Paste the command into your agent and approve each phase
- Get tests, backtest, risk controls and a paper-trading switch
Understand it first
Before you run this, read the lesson behind the idea and how to backtest it honestly. Specs like this one are the survivors of an unknown number of trials; deflate their results accordingly.
Related specs
- ADX MA and EMA Long Only Trend Tracking StrategyPine Script · Trend following · 1d
- ATR and Moving Average Crossover Hybrid StrategyPine Script · Trend following · 1h
- Bollinger Band Moving Average Crossover StrategyPine Script · Trend following · 1h
- Bollinger Bands and EMA Trend Following StrategyPine Script · Trend following · 1h
- Bollinger Bands and RSI Trend Following StrategyPine Script · Trend following · 1h
- Candlestick Pattern Trend Filter StrategyPine Script · Trend following · 1d