Strategy vault / Trend following
Trend Trading Strategy Based on Golden Cross
The golden cross trading strategy is a medium-to-long-term trend tracking strategy. It identifies the trend direction of stock prices by calculating the SR indicator and SR signal indicator, and implements trend…
Overview
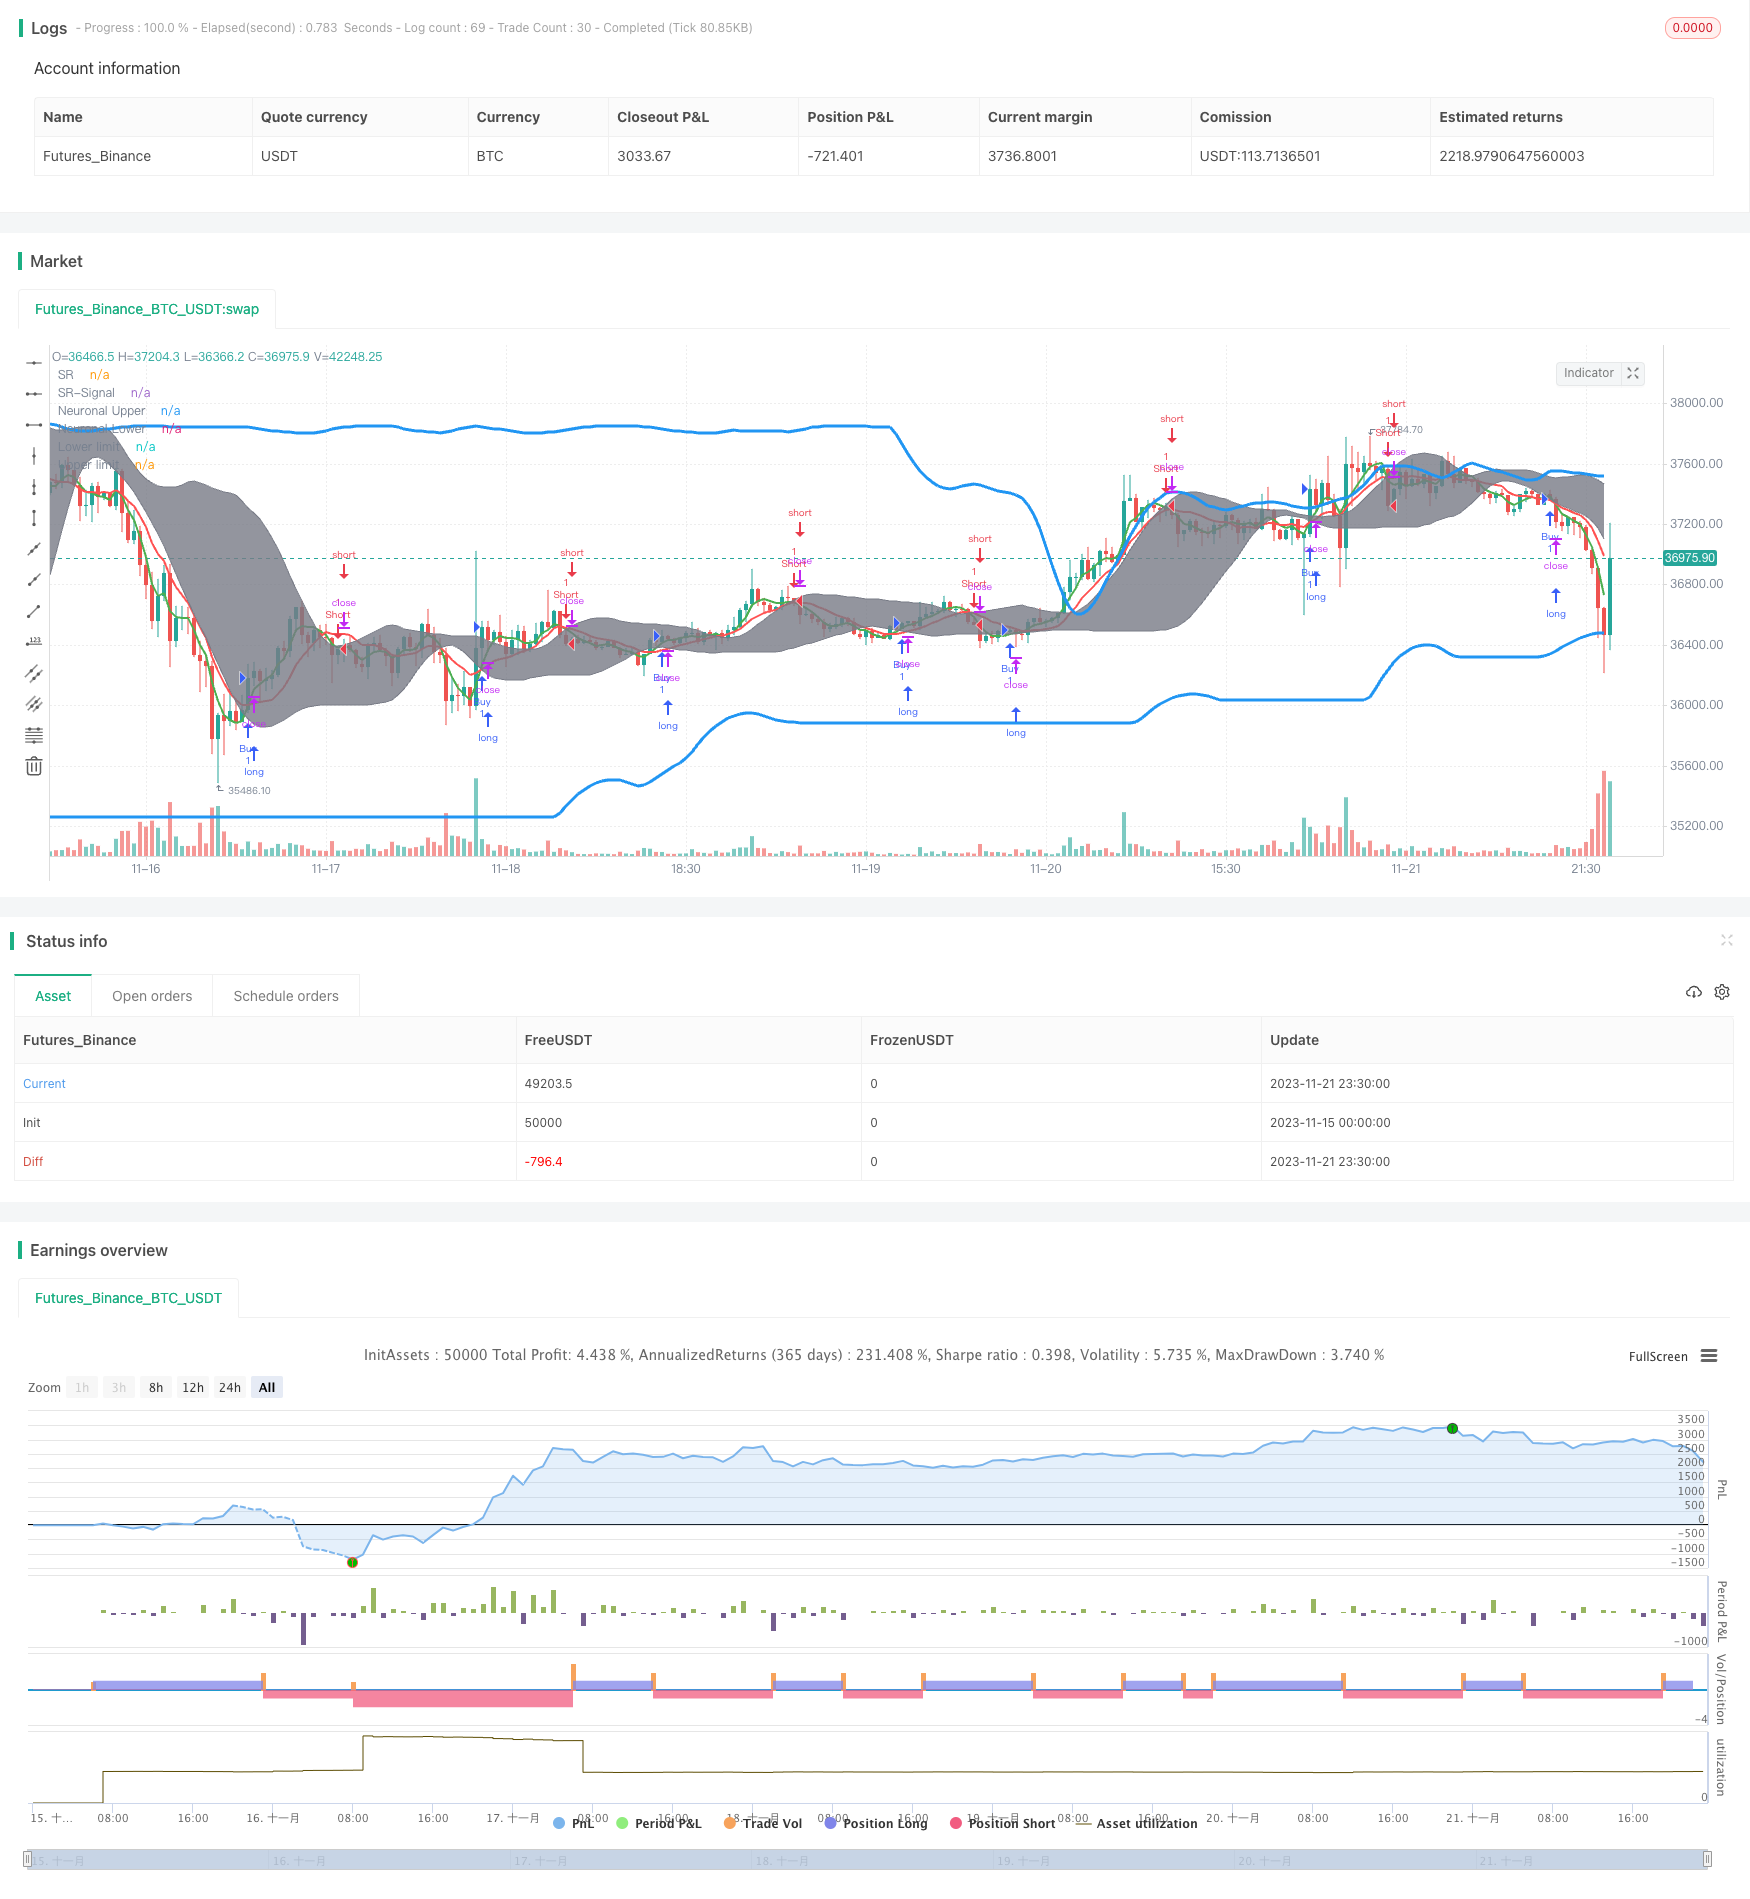
The golden cross trading strategy is a medium-to-long-term trend tracking strategy. It identifies the trend direction of stock prices by calculating the SR indicator and SR signal indicator, and implements trend tracking operations by drawing a trend channel using neural network algorithms. When the SR indicator crosses over the SR signal, a buy signal is generated. When the SR indicator crosses below the SR signal, a sell signal is generated. This strategy also uses an adaptive linear regression filter technique to optimize the channel curve, which effectively suppresses false signals.
Principles
The core indicators of this strategy are the SR indicator and the SR signal indicator. The SR indicator is a secondary synthesis of the WMA moving average and SMA moving average with a period of 8. The SR signal indicator is the SR indicator calculated with a period of 20. The golden crosses and deaths of the SR indicator and SR signal are used to determine the trend direction.
This strategy uses a neural network algorithm to automatically plot the upper and lower limits of the stock price to form an adaptive channel. The upper limit takes the historical maximum value of the SR indicator as input, the lower limit takes the historical minimum value as input, and the regression curves are calculated as the upper and lower limits of the channel respectively. The channel curve is smoother after adaptive linear regression filtering.
When the SR indicator crosses over the SR signal, a buy signal is generated. When the SR indicator crosses below the SR signal, a sell signal is generated. After the long and short signals are issued, the relationship between the stock price and the upper and lower limits of the channel determines the stop loss and take profit positions.
Advantages
- Use bilinear synthesis technology to eliminate the impact of price fluctuations and accurately determine the trend direction;
- Adaptive channel algorithms optimize entry and exit timing and avoid false breakouts;
- Channel curves apply adaptive linear regression filtering technology to avoid distortion from extremes;
- Stop loss and take profit positions change dynamically with the channel, automatically tracking trends for profit.
Risk Analysis
The main risks of this trend tracking strategy are:
- Generates many false signals and excessive invalid operations in oscillating trends;
- Fast break below the lower limit of channel caused by sudden events results in huge losses;
- Improper parameter settings can easily cause strategy failure.
To control risks, it is recommended to combine with other strategies instead of relying on a single strategy; at the same time optimize parameter settings to adapt to different market environments.
Optimization Directions
This strategy can be optimized in the following aspects:
Optimize parameters of SR indicator and signal indicator to improve stability of crossover signals;
Optimize cycle period of adaptive channel to smooth the channel curve;
Add other filter indicators to avoid misoperations, such as energy indicators, volatility indicators, etc;
Incorporate deep learning algorithms to optimize channel curves in real time and improve adaptivity.
Summary
The golden cross trading strategy is an effective quantitative strategy to track medium-to-long-term trends. It has a high probability of correctly determining the trend direction and low operating risks. With huge room for optimizing the algorithm model, this strategy has the potential to become a powerful tool to track changes in stock trends.
Parameters
| Name | Default | What it controls |
|---|---|---|
| v_input_1 | true | ═══════════════ From ═══════════════ |
| v_input_2 | true | Month |
| v_input_3 | true | Day |
| v_input_4 | 2014 | Year |
| v_input_5 | true | ════════════════ To ════════════════ |
| v_input_6 | 31 | Month |
| v_input_7 | 12 | Day |
| v_input_8 | 9999 | Year |
| v_input_9 | 14 | ? Length |
Source Pine Script
/*backtest
start: 2023-11-15 00:00:00
end: 2023-11-22 00:00:00
period: 30m
basePeriod: 15m
exchanges: [{"eid":"Futures_Binance","currency":"BTC_USDT"}]
*/

//@version=4
//
// ▒▒▒▒▒▒▒▒▒▒▒▒▒▒▒▒▒▒▒▒▒▒▒▒▒▒▒▒▒▒▒▒▒▒▒▒▒▒▒▒▒▒▒▒▒▒▒▒▒▒▒▒▒▒▒▒▒▒▒▒▒▒▒▒▒▒▒▒▒▒▒▒▒▒▒▒▒▒▒▒▒▒▒▒▒▒▒▒▒▒▒▒▒▒▒▒▒▒▒▒▒▒▒▒▒▒▒▒▒▒▒▒▒▒ //

strategy(title = " Strategy PyramiCover",
         shorttitle = "S-PC",
         overlay = true,
         precision = 8,
         calc_on_order_fills = true,
         calc_on_every_tick = true,
         backtest_fill_limits_assumption = 0,
         default_qty_type = strategy.fixed,
         default_qty_value = 2,
         initial_capital = 10000,
         pyramiding=50,
         currency = currency.USD,
         linktoseries = true)

//
// ▒▒▒▒▒▒▒▒▒▒▒▒▒▒▒▒▒▒▒▒▒▒▒▒▒▒▒▒▒▒▒▒▒▒▒▒▒▒▒▒▒▒▒▒▒▒▒▒▒▒▒▒▒▒▒▒▒▒▒▒▒▒▒▒▒▒▒▒▒▒▒▒▒▒▒▒▒▒▒▒▒▒▒▒▒▒▒▒▒▒▒▒▒▒▒▒▒▒▒▒▒▒▒▒▒▒▒▒▒▒▒▒▒▒ //

backTestSectionFrom = input(title = "═══════════════ From ═══════════════", defval = true, type = input.bool)

FromMonth         = input(defval = 1, title = "Month", minval = 1)
FromDay           = input(defval = 1, title = "Day", minval = 1)
FromYear          = input(defval = 2014, title = "Year", minval = 2014)

backTestSectionTo = input(title = "════════════════ To ════════════════", defval = true, type = input.bool)
ToMonth           = input(defval = 31, title = "Month", minval = 1)
ToDay             = input(defval = 12, title = "Day", minval = 1)
ToYear            = input(defval = 9999, title = "Year", minval = 2014)

backTestPeriod() => (time > timestamp(FromYear, FromMonth, FromDay, 00, 00)) and (time < timestamp(ToYear, ToMonth, ToDay, 23, 59))

//
// ▒▒▒▒▒▒▒▒▒▒▒▒▒▒▒▒▒▒▒▒▒▒▒▒▒▒▒▒▒▒▒▒▒▒▒▒▒▒▒▒▒▒▒▒▒▒▒▒▒▒▒▒▒▒▒▒▒▒▒▒▒▒▒▒▒▒▒▒▒▒▒▒▒▒▒▒▒▒▒▒▒▒▒▒▒▒▒▒▒▒▒▒▒▒▒▒▒▒▒▒▒▒▒▒▒▒▒▒▒▒▒▒▒▒ //

per = input(14,title="? Length")
//
up = 0.0
nup= 0.0
lowl = 0.0
nin = 0.0
//
srl=wma(close,8)
srr = sma(close,8)
sr = 2*srl - srr
//
srsl=wma(close,20)
srsr= sma(close,20)
srsignal = 2*srsl - srsr
//
if sr>srsignal
    up := highest(sr,round(150))
    nup :=highest(srsignal,round(20))
else
    up := highest(srsignal,round(150))
    nup := highest(sr,round(20))
//
if sr<srsignal
    lowl := lowest(sr,round(150))
    nin := lowest(srsignal,round(20))
else
    lowl := lowest(sr,round(150))
    nin := lowest(srsignal,round(20))
//reg alexgrover
f_reg(src,length)=>
    x = bar_index
    y = src
    x_ = sma(x, length)
    y_ = sma(y, length)
    mx = stdev(x, length)
    my = stdev(y, length)
    c = correlation(x, y, length)
    slope = c * (my / mx)
    inter = y_ - slope * x_
    reg = x * slope + inter
    reg
//
up_=f_reg(up,per)
lowl_=f_reg(lowl,per)
nup_=f_reg(nup,per)
nin_=f_reg(nin,per)
//
plot(sr, title='SR', color=color.green, linewidth=2, style=plot.style_line,transp=0)
plot(srsignal, title='SR-Signal', color=color.red, linewidth=2, style=plot.style_line,transp=0)
plot(up_, title='Upper limit', color=color.blue, linewidth=3, style=plot.style_line,transp=0)
plot(lowl_, title='Lower limit', color=color.blue, linewidth=3, style=plot.style_line,transp=0)
a=plot(nup_, title='Neuronal Upper', color=color.gray, linewidth=1, style=plot.style_line,transp=0)
b=plot(nin_, title='Neuronal Lower', color=color.gray, linewidth=1, style=plot.style_line,transp=0)
fill(a, b, color=color.gray)
plotshape(crossunder(sr,nup_)? sr+atr(20):na, title="Sell", text="?", location=location.absolute, style=shape.labeldown, size=size.tiny, color=color.red, textcolor=color.black,transp=0)
plotshape(crossover(sr,nin_)? sr-atr(20):na, title="Buy", text="?", location=location.absolute, style=shape.labelup, size=size.tiny, color=color.green, textcolor=color.black,transp=0)

//
// ▒▒▒▒▒▒▒▒▒▒▒▒▒▒▒▒▒▒▒▒▒▒▒▒▒▒▒▒▒▒▒▒▒▒▒▒▒▒▒▒▒▒▒▒▒▒▒▒▒▒▒▒▒▒▒▒▒▒▒▒▒▒▒▒▒▒▒▒▒▒▒▒▒▒▒▒▒▒▒▒▒▒▒▒▒▒▒▒▒▒▒▒▒▒▒▒▒▒▒▒▒▒▒▒▒▒▒▒▒▒▒▒▒▒ //

if backTestPeriod()

    strategy.entry("Buy", true, 1, when = crossover(sr,nin_))
strategy.entry("Short", false, 1, when = crossunder(sr,nup_))Published by ChaoZhang on the FMZ strategy square · last modified 2023-11-23. Collected in the Quant Trading Vault. Unvalidated research: re-test with your own data and costs before trusting it.
Build this with AgenKit
A spec is not a trading system. Paste this into your coding agent and AgenKit runs a specialist team — architecture, test-first build, risk gates, review — with paper trading on by default.
/agenkit build a production-grade trading bot with a backtest engine, risk controls and paper trading by default from strategies/Trend-Trading-Strategy-Based-on-Golden-Cross.md- npx agenkit install engineering-kit in your project
- Paste the command into your agent and approve each phase
- Get tests, backtest, risk controls and a paper-trading switch
Understand it first
Before you run this, read the lesson behind the idea and how to backtest it honestly. Specs like this one are the survivors of an unknown number of trials; deflate their results accordingly.
Related specs
- ATR and Moving Average Crossover Hybrid StrategyPine Script · Trend following · 1h
- Adaptive Risk Management Strategy Based on Dynamic ATR and Moving Average CrossoverPine Script · Trend following · 2h
- Adaptive Volatility Based Trend Following Short Strategy with Time Delay and Stop Loss ProtectionPine Script · Trend following · 2m
- BB Percentage Index Trend Fading StrategyPine Script · Trend following · 1h
- Bollinger Bands and RSI Trend Following StrategyPine Script · Trend following · 1h
- Dual ATR Channel Trend Following StrategyPine Script · Trend following · 15m