Strategy vault / Mean reversion
Ultimate Balance Oscillator Trading Strategy
The Ultimate Balance Oscillator trading strategy is a quantitative trading strategy that cleverly combines signals from multiple technical indicators. By harnessing the power of indicators like Rate of Change (ROC)…
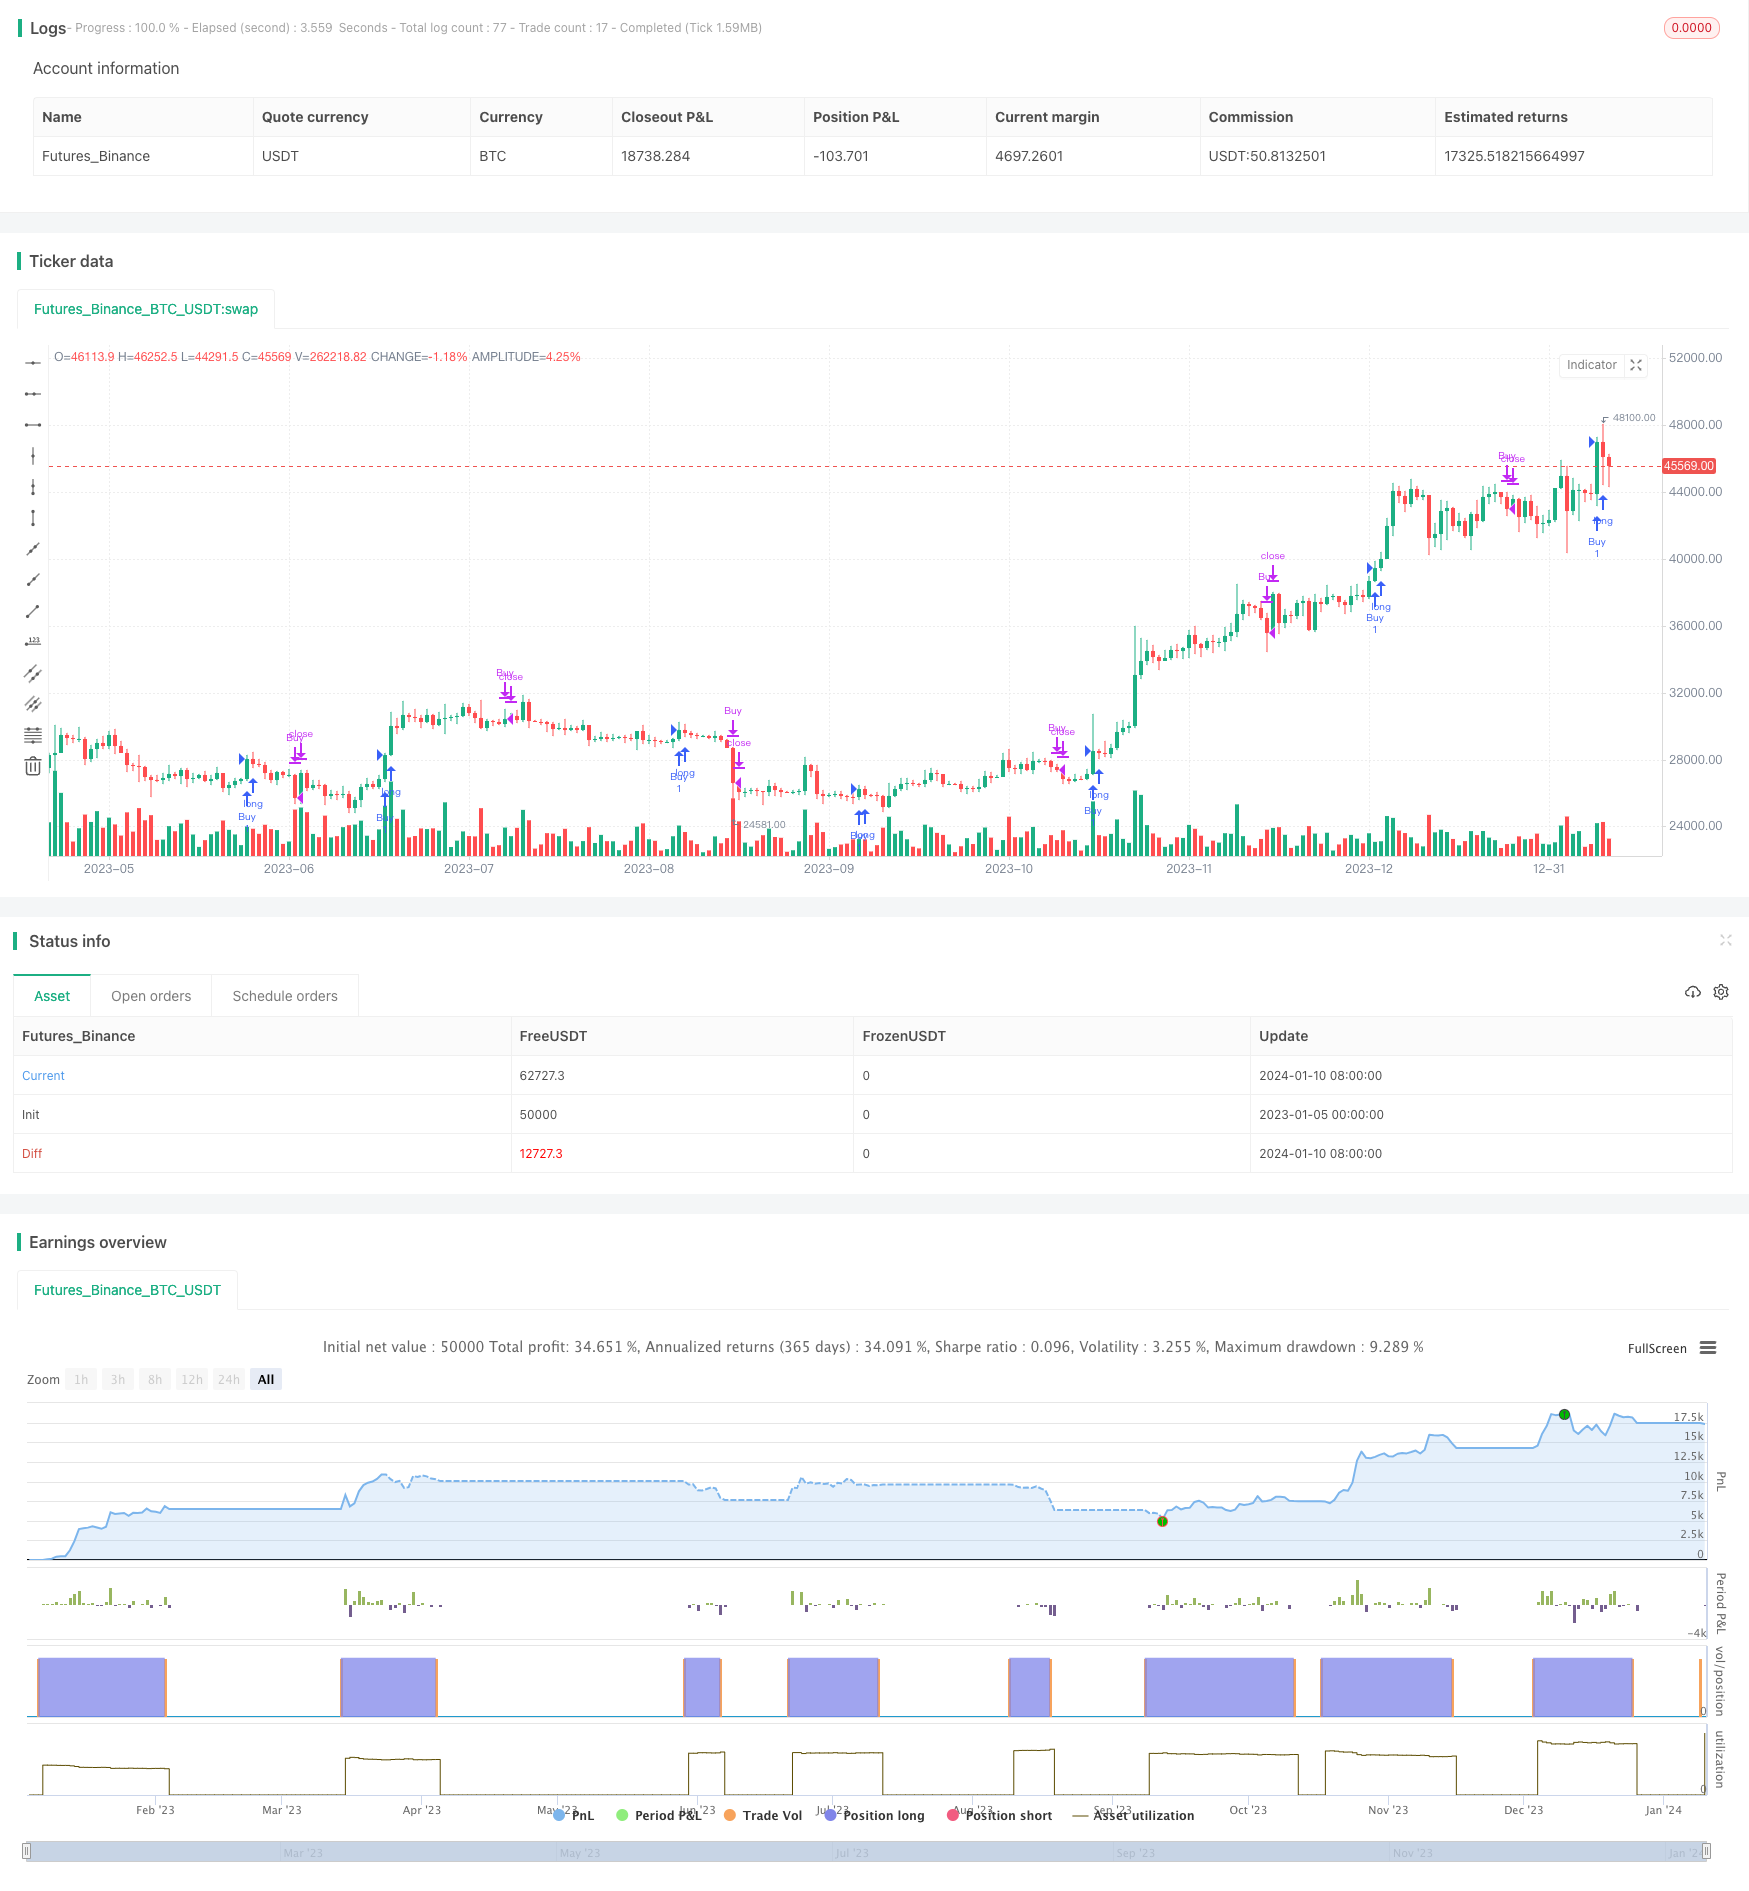
Overview
The Ultimate Balance Oscillator trading strategy is a quantitative trading strategy that cleverly combines signals from multiple technical indicators. By harnessing the power of indicators like Rate of Change (ROC), Relative Strength Index (RSI), Commodity Channel Index (CCI), Williams %R and Average Directional Index (ADX), it calculates a composite oscillator to determine market trend and generate trading signals.
The biggest advantage of this strategy lies in its ability to objectively and systematically assess the markets to identify optimal entry and exit points. It triggers a buy signal when the oscillator line crosses above the 0.75 overbought level and an exit signal when crossing below the 0.25 oversold level.
Strategy Logic
The core of the Ultimate Balance Oscillator trading strategy is the computation of a composite oscillator indicator. The steps to calculate this indicator are:
Compute the values of individual technical indicators: ROC, RSI, CCI, Williams %R, and ADX
Standardize these indicator values to the 0-1 range to enable comparison
Use a weighted average methodology to compute a composite oscillator value. Each indicator has an adjustable weighting, with default values of 2 for ROC, 0.5 for RSI, 2 for CCI, 0.5 for %R, and 0.5 for ADX. Multiply each standardized indicator by its weight, sum them up, and divide by total weight to get a 0-1 composite value.
Trigger trade signals when this composite oscillator crosses appropriately set overbought and oversold levels.
As evident, the strategy flexibly utilizes signals from multiple indicators and processes them systematically to determine market trend and make trading decisions. This avoids the market noise from any single indicator and helps maintain robust decisions across various situations.
Advantages
The Ultimate Balance Oscillator trading strategy has several key advantages:
Provides an objective, systematic market analysis methodology by utilizing multiple indicators to overcome limitations of single tools and generate actionable, quant-driven signals.
Optimizes entry and exit timing/precision through the precise values and standardization of the oscillator.
Highly customizable and adaptable to suit individual trading styles and market conditions through adjustable indicator weightings and parameters.
Real-time alert system to notify traders of fresh buy/exit signals and ensure awareness of latest market developments.
Rigorous backtesting and optimization pre-live trading to evaluate performance over historical data and fine-tune parameters for strategy improvement.
Risks
Despite its merits, some key risks in practical application include:
Parameter optimization risk from suboptimal indicator weightings and settings impairing live performance. Requires extensive backtesting to discover ideal parameters.
Oversold/overbought level risk from improper range setting relative to broader market conditions and sentiment.
Divergent indicators risk skewing composite oscillator values. Consider removing or lowering weights of errant indicators.
Quant model limitations where certain market conditions can degrade performance. Maintaining risk awareness as a practitioner is critical.
To mitigate risks, comprehensive backtesting, calibration to understand model limitations, tracking live performance, and flexibility in adjusting parameters or weights based on evolving conditions is strongly advised. Manual overrides also prove invaluable at times.
Enhancement Opportunities
Some ways to further optimize the strategy include:
Expanding the multi-factor model with more diverse technical indicators to improve predictive accuracy.
Applying machine learning techniques like neural networks to uncover latent signals and forecast indicator values.
Incorporating fundamental data like earnings reports and economic indicators to augment quant factors.
Introducing adaptive parameter tuning to dynamically modify weightings and settings based on changing market landscapes.
Building in stop loss mechanisms to actively control downside on individual trades.
Integrating position sizing models based on account size for quantified capital management.
Conclusion
The Ultimate Balance Oscillator trading strategy is an outstanding quant approach, synthesizing the essence of multiple technical indicators into a rigorous methodology for market assessment. With tremendous customizability to suit individual requirements, it provides retail systematic traders a blueprint to thrive. As with any quant strategy, relentless enhancement through backtesting, optimization and innovation to expand model robustness across market environments remains the key pursuit. Overall, the strategy offers invaluable guidance and learnings to quants looking to enhance their trading toolkit. And over time, with greater maturity of models and markets, should deliver exceptional performance.
Parameters
| Name | Default | What it controls |
|---|---|---|
| v_input_string_1 | 0 | Source: hlc3 | high | low | close | hl2 | open | ohlc4 |
| v_input_float_6 | 0.75 | Overbought Level |
| v_input_float_7 | 0.25 | Oversold Level |
| v_input_float_1 | 2 | (?Weightings)Rate of Change (ROC) Weight |
| v_input_float_2 | 0.5 | Relative Strength Index (RSI) Weight |
| v_input_float_3 | 2 | Commodity Channel Index (CCI) Weight |
| v_input_float_4 | 0.5 | Williams %R Weight |
| v_input_float_5 | 0.5 | Average Directional Index (ADX) Weight |
| v_input_int_1 | 20 | (?ROC)Length |
| v_input_int_2 | 14 | (?RSI)Length |
| v_input_int_3 | 20 | (?CCI)Length |
| v_input_int_4 | 14 | (?Williams %R)Length |
| v_input_int_5 | 14 | (?ADX)ADX Length |
| v_input_int_6 | 14 | DI Length |
Source Pine Script
/*backtest
start: 2023-01-05 00:00:00
end: 2024-01-11 00:00:00
period: 1d
basePeriod: 1h
exchanges: [{"eid":"Futures_Binance","currency":"BTC_USDT"}]
*/

// © Julien_Eche

//@version=5
strategy("Ultimate Balance Oscillator Strategy", overlay=true)

// Indicator Weights
weightROC = input.float(2, "Rate of Change (ROC) Weight", group="Weightings")
weightRSI = input.float(0.5, "Relative Strength Index (RSI) Weight", group="Weightings")
weightCCI = input.float(2, "Commodity Channel Index (CCI) Weight", group="Weightings")
weightWilliamsR = input.float(0.5, "Williams %R Weight", group="Weightings")
weightADX = input.float(0.5, "Average Directional Index (ADX) Weight", group="Weightings")

// ROC Settings
rocLength = input.int(20, "Length", minval=1, group="ROC")

// RSI Settings
rsiLength = input.int(14, "Length", minval=1, group="RSI")

// CCI Settings
cciLength = input.int(20, "Length", minval=1, group="CCI")

// Williams %R Settings
williamsRLength = input.int(14, "Length", minval=1, group="Williams %R")

// ADX Settings
adxLength = input.int(14, "ADX Length", minval=1, group="ADX")
adxDiLength = input.int(14, "DI Length", minval=1, group="ADX")

// Source
source_options = input.string("hlc3", "Source", options=["open", "high", "low", "close", "hl2", "hlc3", "ohlc4"])

price_open = request.security(syminfo.tickerid, "D", open)
price_high = request.security(syminfo.tickerid, "D", high)
price_low = request.security(syminfo.tickerid, "D", low)
price_close = request.security(syminfo.tickerid, "D", close)
price_hl2 = request.security(syminfo.tickerid, "D", hl2)
price_hlc3 = request.security(syminfo.tickerid, "D", hlc3)
price_ohlc4 = request.security(syminfo.tickerid, "D", ohlc4)

get_source(source_option) =>
    price = price_close
    if source_option == "open"
        price := price_open
    else if source_option == "high"
        price := price_high
    else if source_option == "low"
        price := price_low
    else if source_option == "close"
        price := price_close
    else if source_option == "hl2"
        price := price_hl2
    else if source_option == "hlc3"
        price := price_hlc3
    else
        price := price_ohlc4
    price

src = get_source(source_options)

// Overbought/Oversold Levels
obLevel = input.float(0.75, "Overbought Level")
osLevel = input.float(0.25, "Oversold Level")

// Calculating the indicators
rocValue = ta.change(close, rocLength)
rsiValue = ta.rsi(close, rsiLength)
cciValue = (src - ta.sma(src, cciLength)) / (0.015 * ta.dev(src, cciLength))
williamsRValue = -100 * (ta.highest(high, williamsRLength) - close) / (ta.highest(high, williamsRLength) - ta.lowest(low, williamsRLength))

dirmov(len) =>
    up = ta.change(high)
    down = -ta.change(low)
    plusDM = na(up) ? na : (up > down and up > 0 ? up : 0)
    minusDM = na(down) ? na : (down > up and down > 0 ? down : 0)
    truerange = ta.rma(ta.tr, len)
    plus = fixnan(100 * ta.rma(plusDM, len) / truerange)
    minus = fixnan(100 * ta.rma(minusDM, len) / truerange)
    [plus, minus]

adx(dilen, adxlen) =>
    [plus, minus] = dirmov(dilen)
    sum = plus + minus
    adx = 100 * ta.rma(math.abs(plus - minus) / (sum == 0 ? 1 : sum), adxlen)

adxValue = adx(adxDiLength, adxLength)

// Normalizing the values
normalize(value, min, max) =>
    (value - min) / (max - min)

normalizedROC = normalize(rocValue, ta.lowest(rocValue, rocLength), ta.highest(rocValue, rocLength))
normalizedRSI = normalize(rsiValue, 0, 100)
normalizedCCI = normalize(cciValue, ta.lowest(cciValue, cciLength), ta.highest(cciValue, cciLength))
normalizedWilliamsR = normalize(williamsRValue, ta.lowest(williamsRValue, williamsRLength), ta.highest(williamsRValue, williamsRLength))
normalizedADX = normalize(adxValue, 0, 50)

// Calculating the combined oscillator line
oscillatorLine = (normalizedROC * weightROC + normalizedRSI * weightRSI + normalizedCCI * weightCCI + normalizedWilliamsR * weightWilliamsR + normalizedADX * weightADX) / (weightROC + weightRSI + weightCCI + weightWilliamsR + weightADX)

// Strategy conditions
enterLong = ta.crossover(oscillatorLine, obLevel)
exitLong = ta.crossunder(oscillatorLine, osLevel)

// Strategy orders
if (enterLong)
    strategy.entry("Buy", strategy.long)
if (exitLong)
    strategy.close("Buy")

// Alert conditions
if (enterLong)
    alert("Buy signal")
if (exitLong)
    alert("Exit signal")
Published by ChaoZhang on the FMZ strategy square · last modified 2024-01-12. Collected in the Quant Trading Vault. Unvalidated research: re-test with your own data and costs before trusting it.
Build this with AgenKit
A spec is not a trading system. Paste this into your coding agent and AgenKit runs a specialist team — architecture, test-first build, risk gates, review — with paper trading on by default.
/agenkit build a production-grade trading bot with a backtest engine, risk controls and paper trading by default from strategies/Ultimate-Balance-Oscillator-Trading-Strategy.md- npx agenkit install engineering-kit in your project
- Paste the command into your agent and approve each phase
- Get tests, backtest, risk controls and a paper-trading switch
Understand it first
Before you run this, read the lesson behind the idea and how to backtest it honestly. Specs like this one are the survivors of an unknown number of trials; deflate their results accordingly.
Related specs
- Advanced Momentum EMA Trend Following with RSI Overbought Oversold Trading StrategyPine Script · Mean reversion · 1d
- Momentum Indicator RSI Reversal Trading StrategyPine Script · Mean reversion · 1d
- Multi Indicator Reversal Point Capture Trading StrategyPine Script · Mean reversion · 1d
- Reversal Trading Strategy with Bollinger Bands RSI ADX and ATRPine Script · Mean reversion · 1h
- Trend Reversal Momentum Indicators Crossover Tracking StrategyPine Script · Mean reversion · 1h
- Moving Average Crossover and Reversal Indicator Combination StrategyPine Script · Mean reversion · 1d