Universal Sniper Strategy
This strategy adopts a combination of multiple technical indicators to implement a versatile short-term trading strategy. It has trend tracking, breakout trading, mean reversion trading and other trading methods…
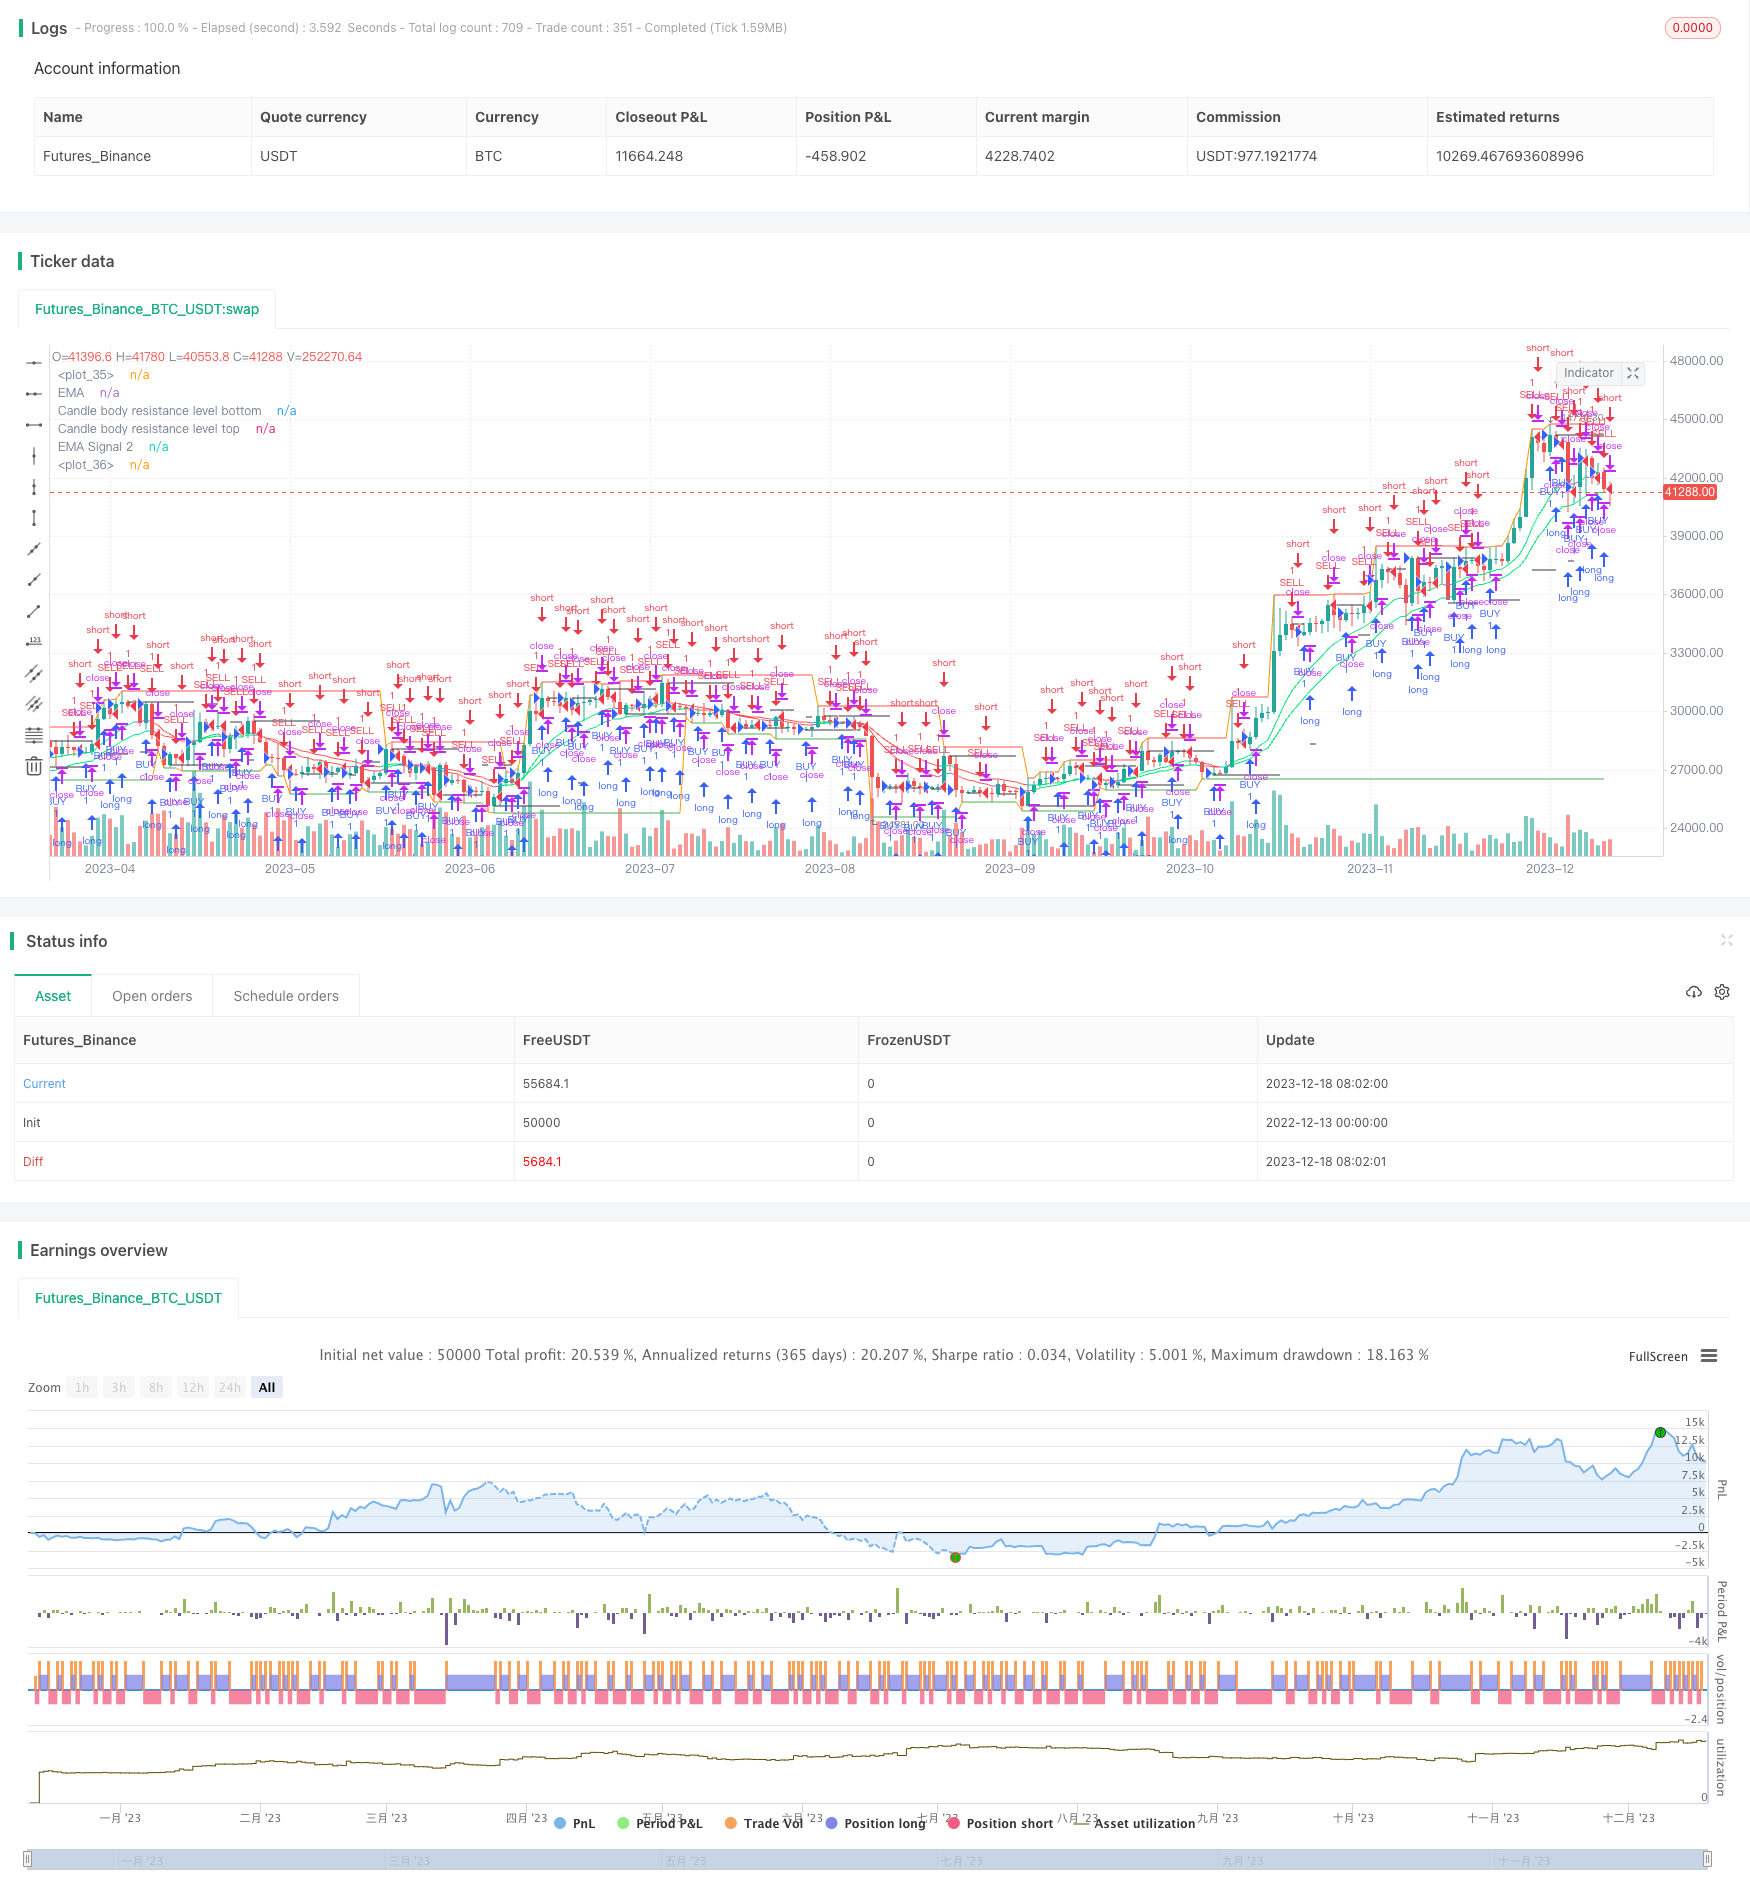
Overview
This strategy adopts a combination of multiple technical indicators to implement a versatile short-term trading strategy. It has trend tracking, breakout trading, mean reversion trading and other trading methods, which can adapt to most market environments. It belongs to a very universal and practical short-term strategy.
Strategy Principle
The strategy first uses the candle body channel indicator, combined with the highest and lowest price channel, to determine the current trend direction and strength.
Then, it uses the common EMA indicator to determine the medium and long term trend direction. The dual EMA indicator combination is used to filter false signals.
Next, the strategy uses the Hull MA indicator to determine whether the current price is overbought or oversold. The Hull MA indicator has a more accurate ability to determine turning points.
Finally, the strategy uses the security function to open a higher cycle to determine the direction of the large cycle trend and generate trading signals.
The combination of multiple sub-strategies enables the strategy to capture intermediate-cycle trends while judging the overall trend direction based on long cycles, thereby realizing a versatile universal trading strategy.
Advantage Analysis
The biggest advantage of this strategy is that it combines multiple technical indicators for portfolio trading, which can simultaneously realize trend tracking, mean reversion trading, breakout trading and other trading methods, which is very versatile and adapts to most market environments.
Specifically, the main advantages of this strategy are:
Using the candle body channel indicator to determine the entity breakout can effectively identify breakout signals.
Using dual EMA combos to filter false signals improves signal accuracy.
Using the Hull MA indicator to determine overbought and oversold areas has a more accurate ability to determine turning points.
Adopting the crossover of opening and closing prices of higher cycle K-lines to generate signals can avoid being misled by noise.
The combination of multiple trading methods makes the strategy more versatile and universal.
Risk Analysis
Although the strategy combines multiple indicators to achieve a versatile trading strategy, there are still certain risks in trading, mainly:
Breakout trading is prone to be misled by false breakouts and generates wrong signals.
Mean reversion trading tends to cause losses in range-bound markets.
The filtering capability of the dual EMA combo is still limited, which may filter out normal signals.
The Hull MA indicator still lacks accuracy in fitting curves.
In response to the above risks, optimizations can be made in the following aspects:
Use more stable indicators to assist in judging and avoid false breakouts.
Increase stop loss strategies to control single loss.
Adjust dual EMA parameters to find the optimal combination.
Try to integrate more indicators to determine overbought and oversold conditions.
Optimization Directions
According to the above analysis, the strategy can be mainly optimized in the following directions:
Use more mainstream and stable indicator combos as auxiliary judgement, such as Kalman Lines, Bollinger Bands, etc.
Increase stop loss strategies to strictly control single loss.
Parameter optimization to find the optimal parameter combination.
Increase machine learning model judgement to utilize AI to determine overbought and oversold areas.
Increase adaptive logic judgement to dynamically adjust strategy methods based on different market environments.
Summary
The strategy combines multiple indicators for portfolio trading, achieving organic integration of multiple trading methods such as trend tracking, breakout trading, and mean reversion trading. It is a very versatile and universal short-term trading strategy. The biggest advantage of this strategy is its wide applicability to most market environments. It belongs to a more universal strategy idea. Of course, there are still certain risks in trading. We can optimize the strategy from introducing more stable indicators, increasing stop loss, parameter optimization, applying machine learning and many other aspects to further improve the performance of the strategy. In general, this is a very worthwhile universal short-term trading strategy to reference and learn from.
Parameters
| Name | Default | What it controls |
|---|---|---|
| v_input_1_close | 0 | Candle body resistance Channel: close | high | low | open | hl2 | hlc3 | hlcc4 | ohlc4 |
| v_input_2 | false | Bar Channel On/Off |
| v_input_3 | 10 | Support / Resistance length: |
| v_input_4 | 13 | EMA 1 |
| v_input_5 | 21 | EMA 2 |
| v_input_6 | false | Display Hull MA Set: |
| v_input_7_close | 0 | Hull MA's Source:: close | high | low | open | hl2 | hlc3 | hlcc4 | ohlc4 |
| v_input_8 | 8 | Hull MA's Base Length: |
| v_input_9 | 5 | Hull MA's Length Scalar: |
| v_input_10 | 720 | Piriod |
Source Pine Script
/*backtest
start: 2022-12-13 00:00:00
end: 2023-12-19 00:00:00
period: 1d
basePeriod: 1h
exchanges: [{"eid":"Futures_Binance","currency":"BTC_USDT"}]
*/

//@version=2
//╭╮╱╱╭╮╭╮╱╱╭╮
//┃╰╮╭╯┃┃┃╱╱┃┃
//╰╮┃┃╭┻╯┣╮╭┫╰━┳╮╭┳━━╮
//╱┃╰╯┃╭╮┃┃┃┃╭╮┃┃┃┃━━┫
//╱╰╮╭┫╰╯┃╰╯┃╰╯┃╰╯┣━━┃
//╱╱╰╯╰━━┻━━┻━━┻━━┻━━╯
//╭━━━┳╮╱╱╱╱╱╱╱╭╮
//┃╭━╮┃┃╱╱╱╱╱╱╱┃┃
//┃┃╱╰┫╰━┳━━┳━╮╭━╮╭━━┫┃
//┃┃╱╭┫╭╮┃╭╮┃╭╮┫╭╮┫┃━┫┃
//┃╰━╯┃┃┃┃╭╮┃┃┃┃┃┃┃┃━┫╰╮
//╰━━━┻╯╰┻╯╰┻╯╰┻╯╰┻━━┻━╯
//━╯
// http://www.vdubus.co.uk/
strategy(title='Vdub FX SniperVX3 / Strategy  v3', shorttitle='Vdub_FX_SniperVX3_Strategy', overlay=true, pyramiding=0, initial_capital=1000, currency=currency.USD)

//Candle body resistance Channel-----------------------------//
len = 34
src = input(close, title="Candle body resistance Channel")
out = sma(src, len)
last8h = highest(close, 13)
lastl8 = lowest(close, 13)
bearish = cross(close,out) == 1 and falling(close, 1)
bullish = cross(close,out) == 1 and rising(close, 1)
channel2=input(false, title="Bar Channel On/Off")
ul2=plot(channel2?last8h:last8h==nz(last8h[1])?last8h:na, color=black, linewidth=1, style=linebr, title="Candle body resistance level top", offset=0)
ll2=plot(channel2?lastl8:lastl8==nz(lastl8[1])?lastl8:na, color=black, linewidth=1, style=linebr, title="Candle body resistance level bottom", offset=0)
//fill(ul2, ll2, color=black, transp=95, title="Candle body resistance Channel")

//-----------------Support and Resistance
RST = input(title='Support / Resistance length:',  defval=10)
RSTT = valuewhen(high >= highest(high, RST), high, 0)
RSTB = valuewhen(low <= lowest(low, RST), low, 0)
RT2 = plot(RSTT, color=RSTT != RSTT[1] ? na : red, linewidth=1, offset=+0)
RB2 = plot(RSTB, color=RSTB != RSTB[1] ? na : green, linewidth=1, offset=0)

//--------------------Trend colour ema------------------------------------------------//
src0 = close, len0 = input(13, minval=1, title="EMA 1")
ema0 = ema(src0, len0)
direction = rising(ema0, 2) ? +1 : falling(ema0, 2) ? -1 : 0
plot_color = direction > 0  ? lime: direction < 0 ? red : na
plot(ema0, title="EMA", style=line, linewidth=1, color = plot_color)

//-------------------- ema 2------------------------------------------------//
src02 = close, len02 = input(21, minval=1, title="EMA 2")
ema02 = ema(src02, len02)
direction2 = rising(ema02, 2) ? +1 : falling(ema02, 2) ? -1 : 0
plot_color2 = direction2 > 0  ? lime: direction2 < 0 ? red : na
plot(ema02, title="EMA Signal 2", style=line, linewidth=1, color = plot_color2)

//=============Hull MA//
show_hma = input(false, title="Display Hull MA Set:")
hma_src = input(close, title="Hull MA's Source:")
hma_base_length = input(8, minval=1, title="Hull MA's Base Length:")
hma_length_scalar = input(5, minval=0, title="Hull MA's Length Scalar:")
hullma(src, length)=>wma(2*wma(src, length/2)-wma(src, length), round(sqrt(length)))
plot(not show_hma ? na : hullma(hma_src, hma_base_length+hma_length_scalar*6), color=black, linewidth=2, title="Hull MA")

//============ signal Generator ==================================//
Piriod=input('720')
ch1 = request.security(syminfo.tickerid, Piriod, open)
ch2 = request.security(syminfo.tickerid, Piriod, close)
longCondition = crossover(request.security(syminfo.tickerid, Piriod, close),request.security(syminfo.tickerid, Piriod, open))
if (longCondition)
    strategy.entry("BUY", strategy.long)
shortCondition = crossunder(request.security(syminfo.tickerid, Piriod, close),request.security(syminfo.tickerid, Piriod, open))
if (shortCondition)
    strategy.entry("SELL", strategy.short)

///////////////////////////////////////////////////////////////////////////////////////////Published by ChaoZhang on the FMZ strategy square · last modified 2023-12-20. Collected in the Quant Trading Vault. Unvalidated research: re-test with your own data and costs before trusting it.
Build this with AgenKit
A spec is not a trading system. Paste this into your coding agent and AgenKit runs a specialist team — architecture, test-first build, risk gates, review — with paper trading on by default.
/agenkit build a production-grade trading bot with a backtest engine, risk controls and paper trading by default from strategies/Universal-Sniper-Strategy.md- npx agenkit install engineering-kit in your project
- Paste the command into your agent and approve each phase
- Get tests, backtest, risk controls and a paper-trading switch
Understand it first
Before you run this, read the lesson behind the idea and how to backtest it honestly. Specs like this one are the survivors of an unknown number of trials; deflate their results accordingly.
Related specs
- Exponential Moving Average Candle Stop Trading StrategyPine Script · Breakout · 1d
- Kana Candle Breakout Strategy Based on Moving Average and Support ResistancePine Script · Breakout · 1h
- Momentum Breakout Moving Average StrategyPine Script · Breakout · 1d
- Momentum Breakout Trading Strategy 435896Pine Script · Breakout · 1d
- Moving Average Crossover and Upper Rail Breakthrough Impulse StrategyPine Script · Breakout · 1m
- Quantitative Trading Strategy Based on Ichimoku with Multiple SignalsPine Script · Breakout · 1h