Strategy vault / Trend following
Vegas SuperTrend Enhanced Strategy
The "Vegas SuperTrend Enhanced Strategy" is an innovative trading strategy that combines the Vegas Channel and SuperTrend indicator, dynamically adjusting the sensitivity of the SuperTrend indicator to adapt to…
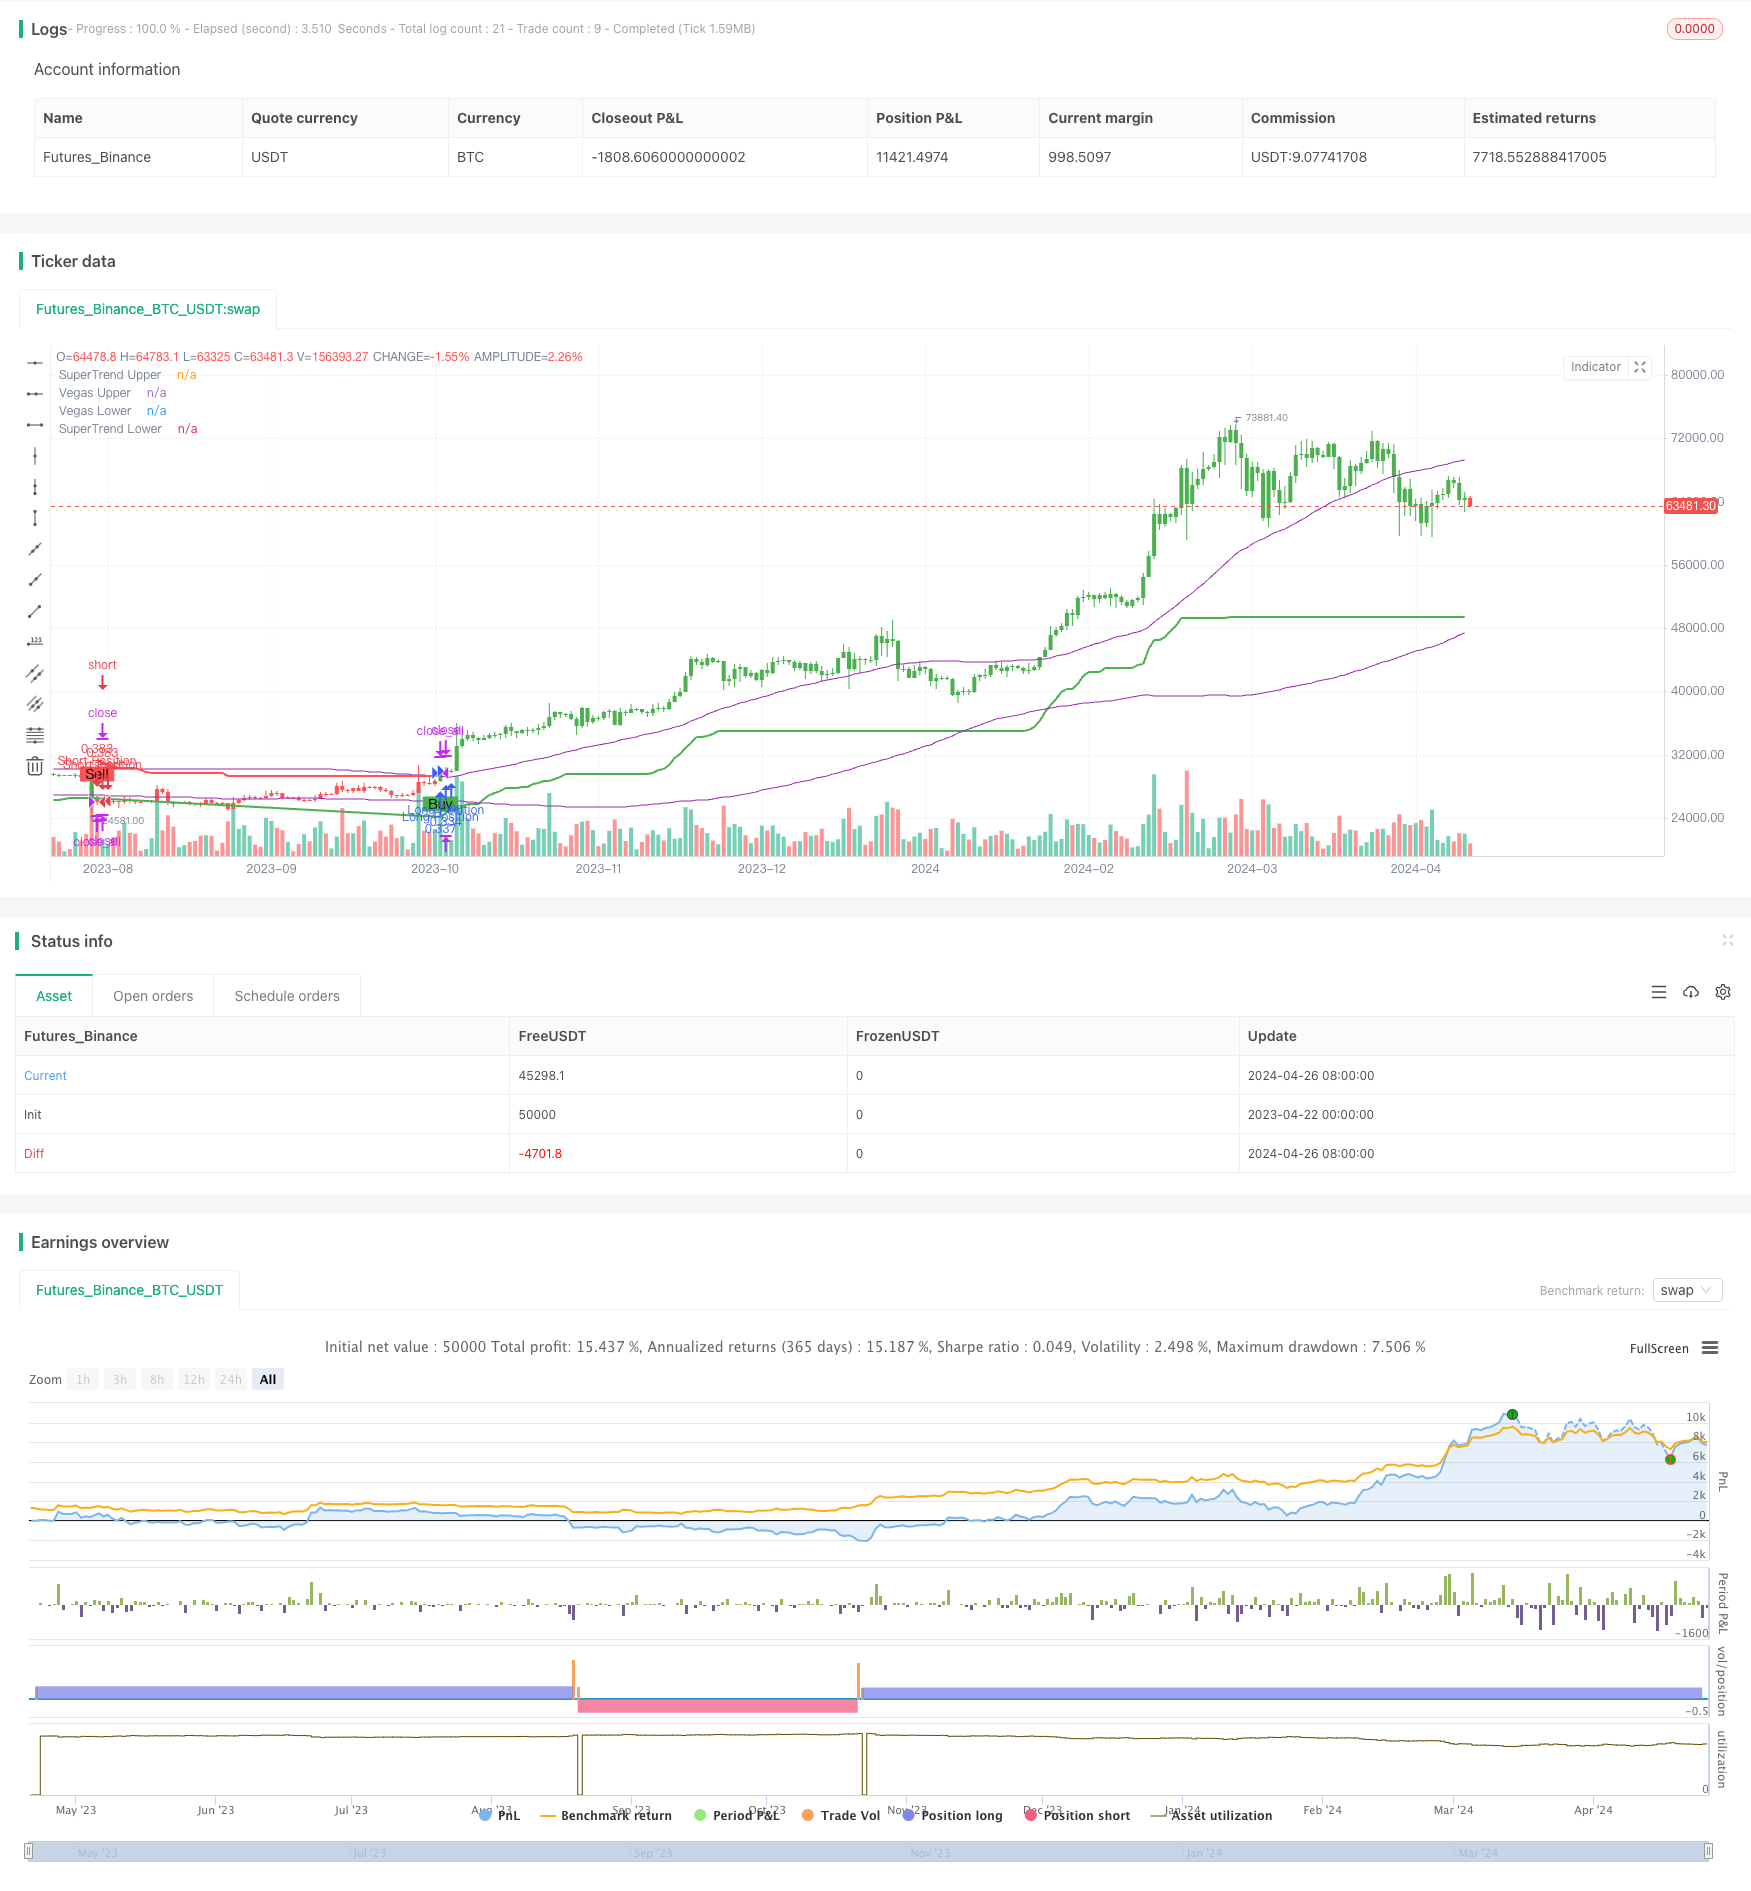
Overview
The "Vegas SuperTrend Enhanced Strategy" is an innovative trading strategy that combines the Vegas Channel and SuperTrend indicator, dynamically adjusting the sensitivity of the SuperTrend indicator to adapt to different market volatility conditions. The strategy uses the Vegas Channel to measure market volatility and adjusts the parameters of the SuperTrend indicator accordingly, allowing for better adaptation to market changes while tracking trends. The strategy generates buy and sell signals based on the relative position of the price to the SuperTrend indicator, while providing flexible trading direction options for long, short, or bi-directional trading. The strategy has excellent visualization, using simple green and red colors to identify bullish and bearish trends, making it easy for traders to quickly grasp market trends.
Strategy Principles
The core of this strategy is the combination of the Vegas Channel and the SuperTrend indicator. The Vegas Channel uses a simple moving average (SMA) and standard deviation (STDEV) to determine the upper and lower fluctuation range of the price. The width of the channel reflects the degree of market volatility. The SuperTrend indicator, on the other hand, is a trend-tracking indicator that determines the trend direction by comparing the current price with the indicator value.
The strategy dynamically adjusts the multiplier of the SuperTrend indicator to adapt to changes in the width of the Vegas Channel. When the Vegas Channel is wider (i.e., market volatility is higher), the multiplier of the SuperTrend indicator increases accordingly, making it more sensitive to trend changes; conversely, when the Vegas Channel is narrower (i.e., market volatility is lower), the multiplier decreases, making the indicator more stable. This dynamic adjustment allows the SuperTrend indicator to adapt to different market rhythms.
Trading signals are generated based on a comparison of the current closing price with the SuperTrend indicator value. When the price crosses the SuperTrend indicator line from below, a long signal is generated; conversely, when the price crosses the indicator line from above, a short signal is generated. This simple and intuitive signal judgment method makes the strategy easy to understand and apply.
Strategy Advantages
Dynamic adaptation to market volatility: By dynamically adjusting the parameters of the SuperTrend indicator through the Vegas Channel, the strategy can adapt to different market volatility conditions, capturing trends in a timely manner in trending markets and remaining stable in oscillating markets.
Clear and intuitive trading signals: The strategy generates clear buy and sell signals based on the relative position of the price to the SuperTrend indicator, which is simple and easy to understand, facilitating quick decision-making by traders.
Flexible trading direction options: The strategy offers three options for long, short, and bi-directional trading, catering to the needs and market views of different traders.
Excellent visual assistance: The strategy identifies bullish and bearish trends on the chart with green and red colors, and marks buy and sell points with arrows, which is intuitive and clear, facilitating grasping the market pulse.
Strategy Risks
Trend recognition lag: Like all trend-tracking strategies, this strategy may experience signal lag in the early stages of a trend reversal, resulting in missed optimal entry points or additional risk.
Sensitivity to parameter settings: The strategy's performance depends to some extent on the choice of parameters, such as the ATR period and Vegas Channel length, and different parameters may yield different results.
Frequent trading: The strategy is relatively sensitive to trend changes and may generate frequent trading signals in oscillating markets, increasing trading costs and drawdown risk.
Strategy Optimization Directions
Introduce more indicators: Consider introducing other technical indicators such as RSI and MACD to verify trend signals from multiple dimensions and improve signal reliability.
Optimize entry and exit rules: On the basis of the current entry signals, more filtering conditions can be introduced, such as requiring multiple consecutive candles to close in the trend direction, to reduce false signals; at the same time, trailing stops or volatility stops can be set to optimize exits.
Dynamic position adjustment: Based on indicators such as market trend strength and volatility, dynamically adjust the position size of each trade, increasing the position when the trend is strong and reducing the position when the trend weakens, to better control risk and optimize returns.
Summary
The "Vegas SuperTrend Enhanced Strategy" is an innovative trend-tracking trading strategy that combines trend recognition and market adaptability by dynamically adjusting the SuperTrend indicator through the Vegas Channel. The strategy has clear trading signals, strong adaptability, and excellent visual assistance, but also faces inherent risks such as trend recognition lag and parameter sensitivity. In the future, the strategy can be optimized in terms of signal verification, optimization of entry and exit rules, and dynamic position adjustment. Overall, the strategy provides a flexible and effective approach to capturing market trends and seizing trading opportunities.
Parameters
| Name | Default | What it controls |
|---|---|---|
| v_input_string_1 | 0 | Trade Direction: Both | Short | Long |
| v_input_1 | 10 | ATR Period for SuperTrend |
| v_input_2 | 100 | Vegas Window Length |
| v_input_3 | 5 | SuperTrend Multiplier Base |
| v_input_float_1 | 5 | Volatility Adjustment Factor |
Source Pine Script
/*backtest
start: 2023-04-22 00:00:00
end: 2024-04-27 00:00:00
period: 1d
basePeriod: 1h
exchanges: [{"eid":"Futures_Binance","currency":"BTC_USDT"}]
*/

// This Pine Script™ code is subject to the terms of the Mozilla Public License 2.0 at https://mozilla.org/MPL/2.0/
// © PresentTrading

// The "Vegas SuperTrend Strategy" uses Vegas Channel and SuperTrend indicators on trading charts, allowing for adjustable settings like ATR length and channel size.
// It modifies the SuperTrend's sensitivity to market volatility, generating buy (green) or sell (red) signals upon trend shifts.
// Entry and exit points are visually marked, with the strategy automating trades based on these trend changes to adapt to different market conditions.

//@version=5
strategy("Vegas SuperTrend Enhanced - strategy [presentTrading]", shorttitle="Vegas SuperTrend Enhanced - strategy [presentTrading]", overlay=true, precision=3, default_qty_type=strategy.cash,
 commission_value=0.1, commission_type=strategy.commission.percent, slippage=1, currency=currency.USD, default_qty_value=10000, initial_capital=10000)

// Input settings allow the user to customize the strategy's parameters.
tradeDirectionChoice = input.string(title="Trade Direction", defval="Both", options=["Long", "Short", "Both"]) // Option to select the trading direction
atrPeriod = input(10, "ATR Period for SuperTrend") // Length of the ATR for volatility measurement
vegasWindow = input(100, "Vegas Window Length") // Length of the moving average for the Vegas Channel
superTrendMultiplier = input(5, "SuperTrend Multiplier Base") // Base multiplier for the SuperTrend calculation
volatilityAdjustment = input.float(5, "Volatility Adjustment Factor") // Factor to adjust the SuperTrend sensitivity to the Vegas Channel width

// Calculate the Vegas Channel using a simple moving average and standard deviation.
vegasMovingAverage = ta.sma(close, vegasWindow)
vegasChannelStdDev = ta.stdev(close, vegasWindow)
vegasChannelUpper = vegasMovingAverage + vegasChannelStdDev
vegasChannelLower = vegasMovingAverage - vegasChannelStdDev

// Adjust the SuperTrend multiplier based on the width of the Vegas Channel.
channelVolatilityWidth = vegasChannelUpper - vegasChannelLower
adjustedMultiplier = superTrendMultiplier + volatilityAdjustment * (channelVolatilityWidth / vegasMovingAverage)

// Calculate the SuperTrend indicator values.
averageTrueRange = ta.atr(atrPeriod)
superTrendUpper = hlc3 - (adjustedMultiplier * averageTrueRange)
superTrendLower = hlc3 + (adjustedMultiplier * averageTrueRange)
var float superTrendPrevUpper = na
var float superTrendPrevLower = na
var int marketTrend = 1

// Update SuperTrend values and determine the current trend direction.
superTrendPrevUpper := nz(superTrendPrevUpper[1], superTrendUpper)
superTrendPrevLower := nz(superTrendPrevLower[1], superTrendLower)
marketTrend := close > superTrendPrevLower ? 1 : close < superTrendPrevUpper ? -1 : nz(marketTrend[1], 1)
superTrendUpper := marketTrend == 1 ? math.max(superTrendUpper, superTrendPrevUpper) : superTrendUpper
superTrendLower := marketTrend == -1 ? math.min(superTrendLower, superTrendPrevLower) : superTrendLower
superTrendPrevUpper := superTrendUpper
superTrendPrevLower := superTrendLower

// Enhanced Visualization
// Plot the SuperTrend and Vegas Channel for visual analysis.
plot(marketTrend == 1 ? superTrendUpper : na, "SuperTrend Upper", color=color.green, linewidth=2)
plot(marketTrend == -1 ? superTrendLower : na, "SuperTrend Lower", color=color.red, linewidth=2)
plot(vegasChannelUpper, "Vegas Upper", color=color.purple, linewidth=1)
plot(vegasChannelLower, "Vegas Lower", color=color.purple, linewidth=1)

// Apply a color to the price bars based on the current market trend.
barcolor(marketTrend == 1 ? color.green : marketTrend == -1 ? color.red : na)

// Detect trend direction changes and plot entry/exit signals.
trendShiftToBullish = marketTrend == 1 and marketTrend[1] == -1
trendShiftToBearish = marketTrend == -1 and marketTrend[1] == 1

plotshape(series=trendShiftToBullish, title="Enter Long", location=location.belowbar, color=color.green, style=shape.labelup, text="Buy")
plotshape(series=trendShiftToBearish, title="Enter Short", location=location.abovebar, color=color.red, style=shape.labeldown, text="Sell")

// Define conditions for entering long or short positions, and execute trades based on these conditions.
enterLongCondition = marketTrend == 1
enterShortCondition = marketTrend == -1

// Check trade direction choice before executing trade entries.
if enterLongCondition and (tradeDirectionChoice == "Long" or tradeDirectionChoice == "Both")
    strategy.entry("Long Position", strategy.long)

if enterShortCondition and (tradeDirectionChoice == "Short" or tradeDirectionChoice == "Both")
    strategy.entry("Short Position", strategy.short)

// Close all positions when the market trend changes.
if marketTrend != marketTrend[1]
    strategy.close_all()
Published by ChaoZhang on the FMZ strategy square · last modified 2024-04-28. Collected in the Quant Trading Vault. Unvalidated research: re-test with your own data and costs before trusting it.
Build this with AgenKit
A spec is not a trading system. Paste this into your coding agent and AgenKit runs a specialist team — architecture, test-first build, risk gates, review — with paper trading on by default.
/agenkit build a production-grade trading bot with a backtest engine, risk controls and paper trading by default from strategies/Vegas-SuperTrend-Enhanced-Strategy.md- npx agenkit install engineering-kit in your project
- Paste the command into your agent and approve each phase
- Get tests, backtest, risk controls and a paper-trading switch
Understand it first
Before you run this, read the lesson behind the idea and how to backtest it honestly. Specs like this one are the survivors of an unknown number of trials; deflate their results accordingly.
Related specs
- Multi Indicator Dynamic Trend Following Strategy Based on EMA and SMAPine Script · Trend following · 1d
- Super trend BPine Script · Trend following · 4h
- SuperTrend Dual Direction StrategyPine Script · Trend following · 3d
- Supertrend Advance StrategyPine Script · Trend following · 5m
- Supertrend and Moving Average Crossover StrategyPine Script · Trend following · 2h
- Trading the Equity Curve Position Sizing ExamplePine Script · Trend following · 15m