Strategy vault / Machine learning
Vertical Horizontal Filter Backtest Strategy
Overview: This strategy judges whether prices are in a trend state by calculating the ratio between the difference between the highest and lowest prices over a certain period and the amplitude of the closing price…
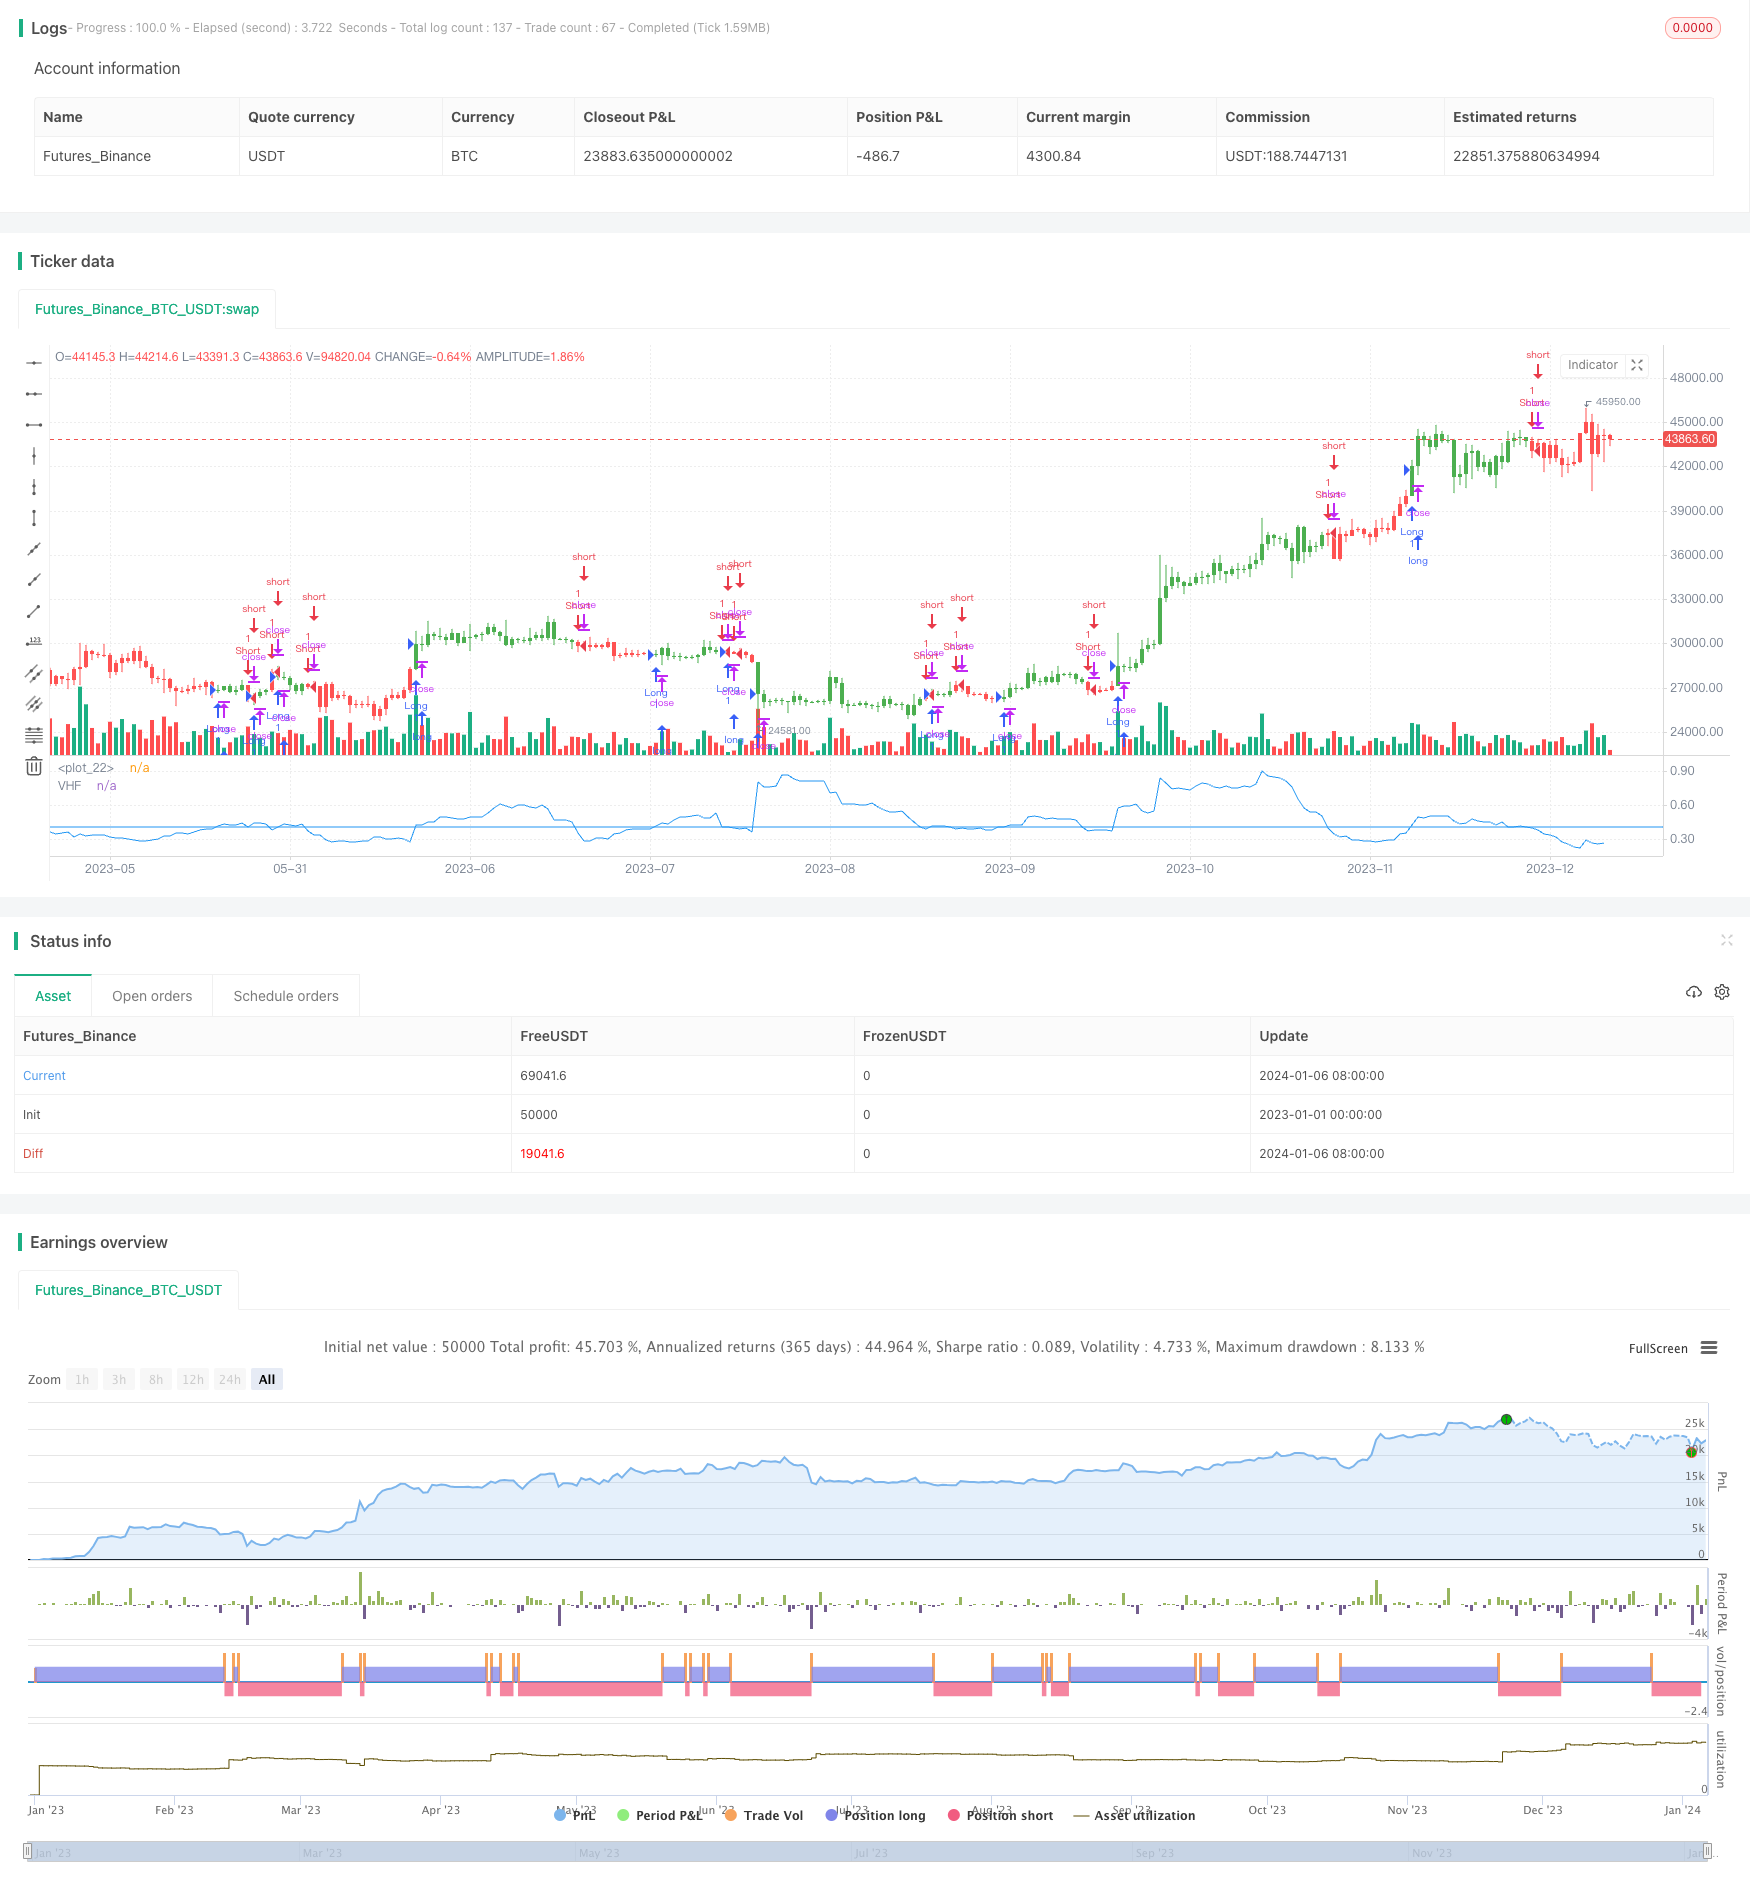
Overview: This strategy judges whether prices are in a trend state by calculating the ratio between the difference between the highest and lowest prices over a certain period and the amplitude of the closing price, and uses this as a trading signal indicator.
Strategy Principle: The core indicator of this strategy is Vertical Horizontal Filter (VHF). It is calculated by the following formula:
VHF = (Highest(Length) - Lowest(Length)) / SUM(ABS(Close-Close[1]), Length)
Where Highest(Length) and Lowest(Length) are respectively the highest and lowest prices within the Length cycle. The numerator reflects the amplitude range of prices, and the denominator reflects the actual fluctuation of prices. Their ratio can judge the trend of price moves. When VHF is higher than a given signal threshold, it is considered that prices are in a trend state. When lower than the given signal threshold, it is considered that prices are in a shock state. Trading signals are generated accordingly.
This strategy is simple and intuitive. By comparing the price fluctuation range with the actual fluctuation to judge the trend, it avoids the problem of relying solely on SMA, EMA and other indicators while ignoring the characteristics of the price itself. But this strategy is sensitive to parameter optimization, Length and Signal parameters need to be adjusted to adapt to different cycles and market conditions.
Advantage Analysis:
- Intuitive trend judgment indicator, simple and effective.
- Consider the characteristics of the price itself, does not rely on any curve fitting.
- Configurable parameters adjust the sensitivity of judgment.
- Can be easily integrated into various trading strategies.
Risk Analysis:
- Sensitive to parameters, improper settings can cause too many false trades.
- Unable to distinguish pseudo trends when prices are at inflection points.
- Not sensitive to short-term price shocks under large cycle settings.
- Need to use stop loss to control single loss.
Optimization Directions:
- Optimize Length parameter to balance the sensitivity of trend judgment.
- Combine other indicators to filter VHF signals. For example, MACD can determine inflection points.
- Try machine learning methods to fit the VHF curve.
- Set up parallel strategies with different cycle settings to generate multi-level strategy signals.
Summary: This strategy intuitively determines the trend based on the characteristics of the price itself, simple and valid, worth further exploration, optimization and verification. It can become a basic trend judgment tool and widely used in quantitative trading strategies.
Parameters
| Name | Default | What it controls |
|---|---|---|
| v_input_1 | 28 | Length |
| v_input_2 | 0.4 | Signal |
| v_input_3 | false | Trade reverse |
Source Pine Script
/*backtest
start: 2023-01-01 00:00:00
end: 2024-01-07 00:00:00
period: 1d
basePeriod: 1h
exchanges: [{"eid":"Futures_Binance","currency":"BTC_USDT"}]
*/

//@version=2
////////////////////////////////////////////////////////////
//  Copyright by HPotter v1.0 27/04/2018
// Vertical Horizontal Filter was initiated by Adam White. It was first published
// in a magazine called "Issues of Futures" in August, 1991. The Vertical Horizontal
// Filter (VHF) is a very common Indicator used by traders to find out the Phase of
// a Price Trend. Normally, a price trend can be in a Trending Phase or a Congestion
// Phase/Choppy Movement Phase. Adam White created this particular Technical Indicator
// to determine whether prices are trending in a particular direction or are they going
// through a transitional period. He used it to measure the range of Futures available
// in the market.
//
// You can change long to short in the Input Settings
// WARNING:
//  - For purpose educate only
//  - This script to change bars colors.
////////////////////////////////////////////////////////////
strategy(title="Vertical Horizontal Filter Backtest")
Length = input(28, minval=1)
Signal = input(0.4, step=0.01)
reverse = input(false, title="Trade reverse")
hline(Signal, color=blue, linestyle=line)
xHH = highest(high, Length)
xLL = lowest(low, Length)
xNumerator = abs(xHH - xLL)
xDenominator = sum(abs(close - close[1]), Length)
xVHF = xNumerator / xDenominator
pos = iff(xVHF > Signal, 1,
       iff(xVHF < Signal, -1, nz(pos[1], 0)))
possig = iff(reverse and pos == 1, -1,
          iff(reverse and pos == -1, 1, pos))
if (possig == 1)
    strategy.entry("Long", strategy.long)
if (possig == -1)
    strategy.entry("Short", strategy.short)
barcolor(possig == -1 ? red: possig == 1 ? green : blue )
plot(xVHF, color=blue, title="VHF")
Published by ChaoZhang on the FMZ strategy square · last modified 2024-01-08. Collected in the Quant Trading Vault. Unvalidated research: re-test with your own data and costs before trusting it.
Build this with AgenKit
A spec is not a trading system. Paste this into your coding agent and AgenKit runs a specialist team — architecture, test-first build, risk gates, review — with paper trading on by default.
/agenkit build a production-grade trading bot with a backtest engine, risk controls and paper trading by default from strategies/Vertical-Horizontal-Filter-Backtest-Strategy.md- npx agenkit install engineering-kit in your project
- Paste the command into your agent and approve each phase
- Get tests, backtest, risk controls and a paper-trading switch
Understand it first
Before you run this, read the lesson behind the idea and how to backtest it honestly. Specs like this one are the survivors of an unknown number of trials; deflate their results accordingly.
Related specs
- EMA and RSI Quantitative Trading StrategyPine Script · Machine learning · 1h
- MACD Robot Trading StrategyPine Script · Machine learning · 1d
- Multi Indicator Dynamic Adaptive Quantitative Trading StrategyPine Script · Machine learning · 1h
- Triple Moving Average Combined with MACD Quantitative StrategyPine Script · Machine learning · 1d
- High Low Cryptocurrency Strategy Based on Multiple IndicatorsPine Script · Machine learning · 45m
- Johns Bitcoin Intraday Trading Strategy Based on Multiple IndicatorsPine Script · Machine learning · 1m