Strategy vault / Trend following
Volatility and Trend Tracking Strategy Across Timeframes Based on Williams VIX and DEMA
This strategy first calculates the Williams VIX indicator by getting the difference between the highest price and the lowest price over a certain period divided by the highest price. Then, combining the idea of…
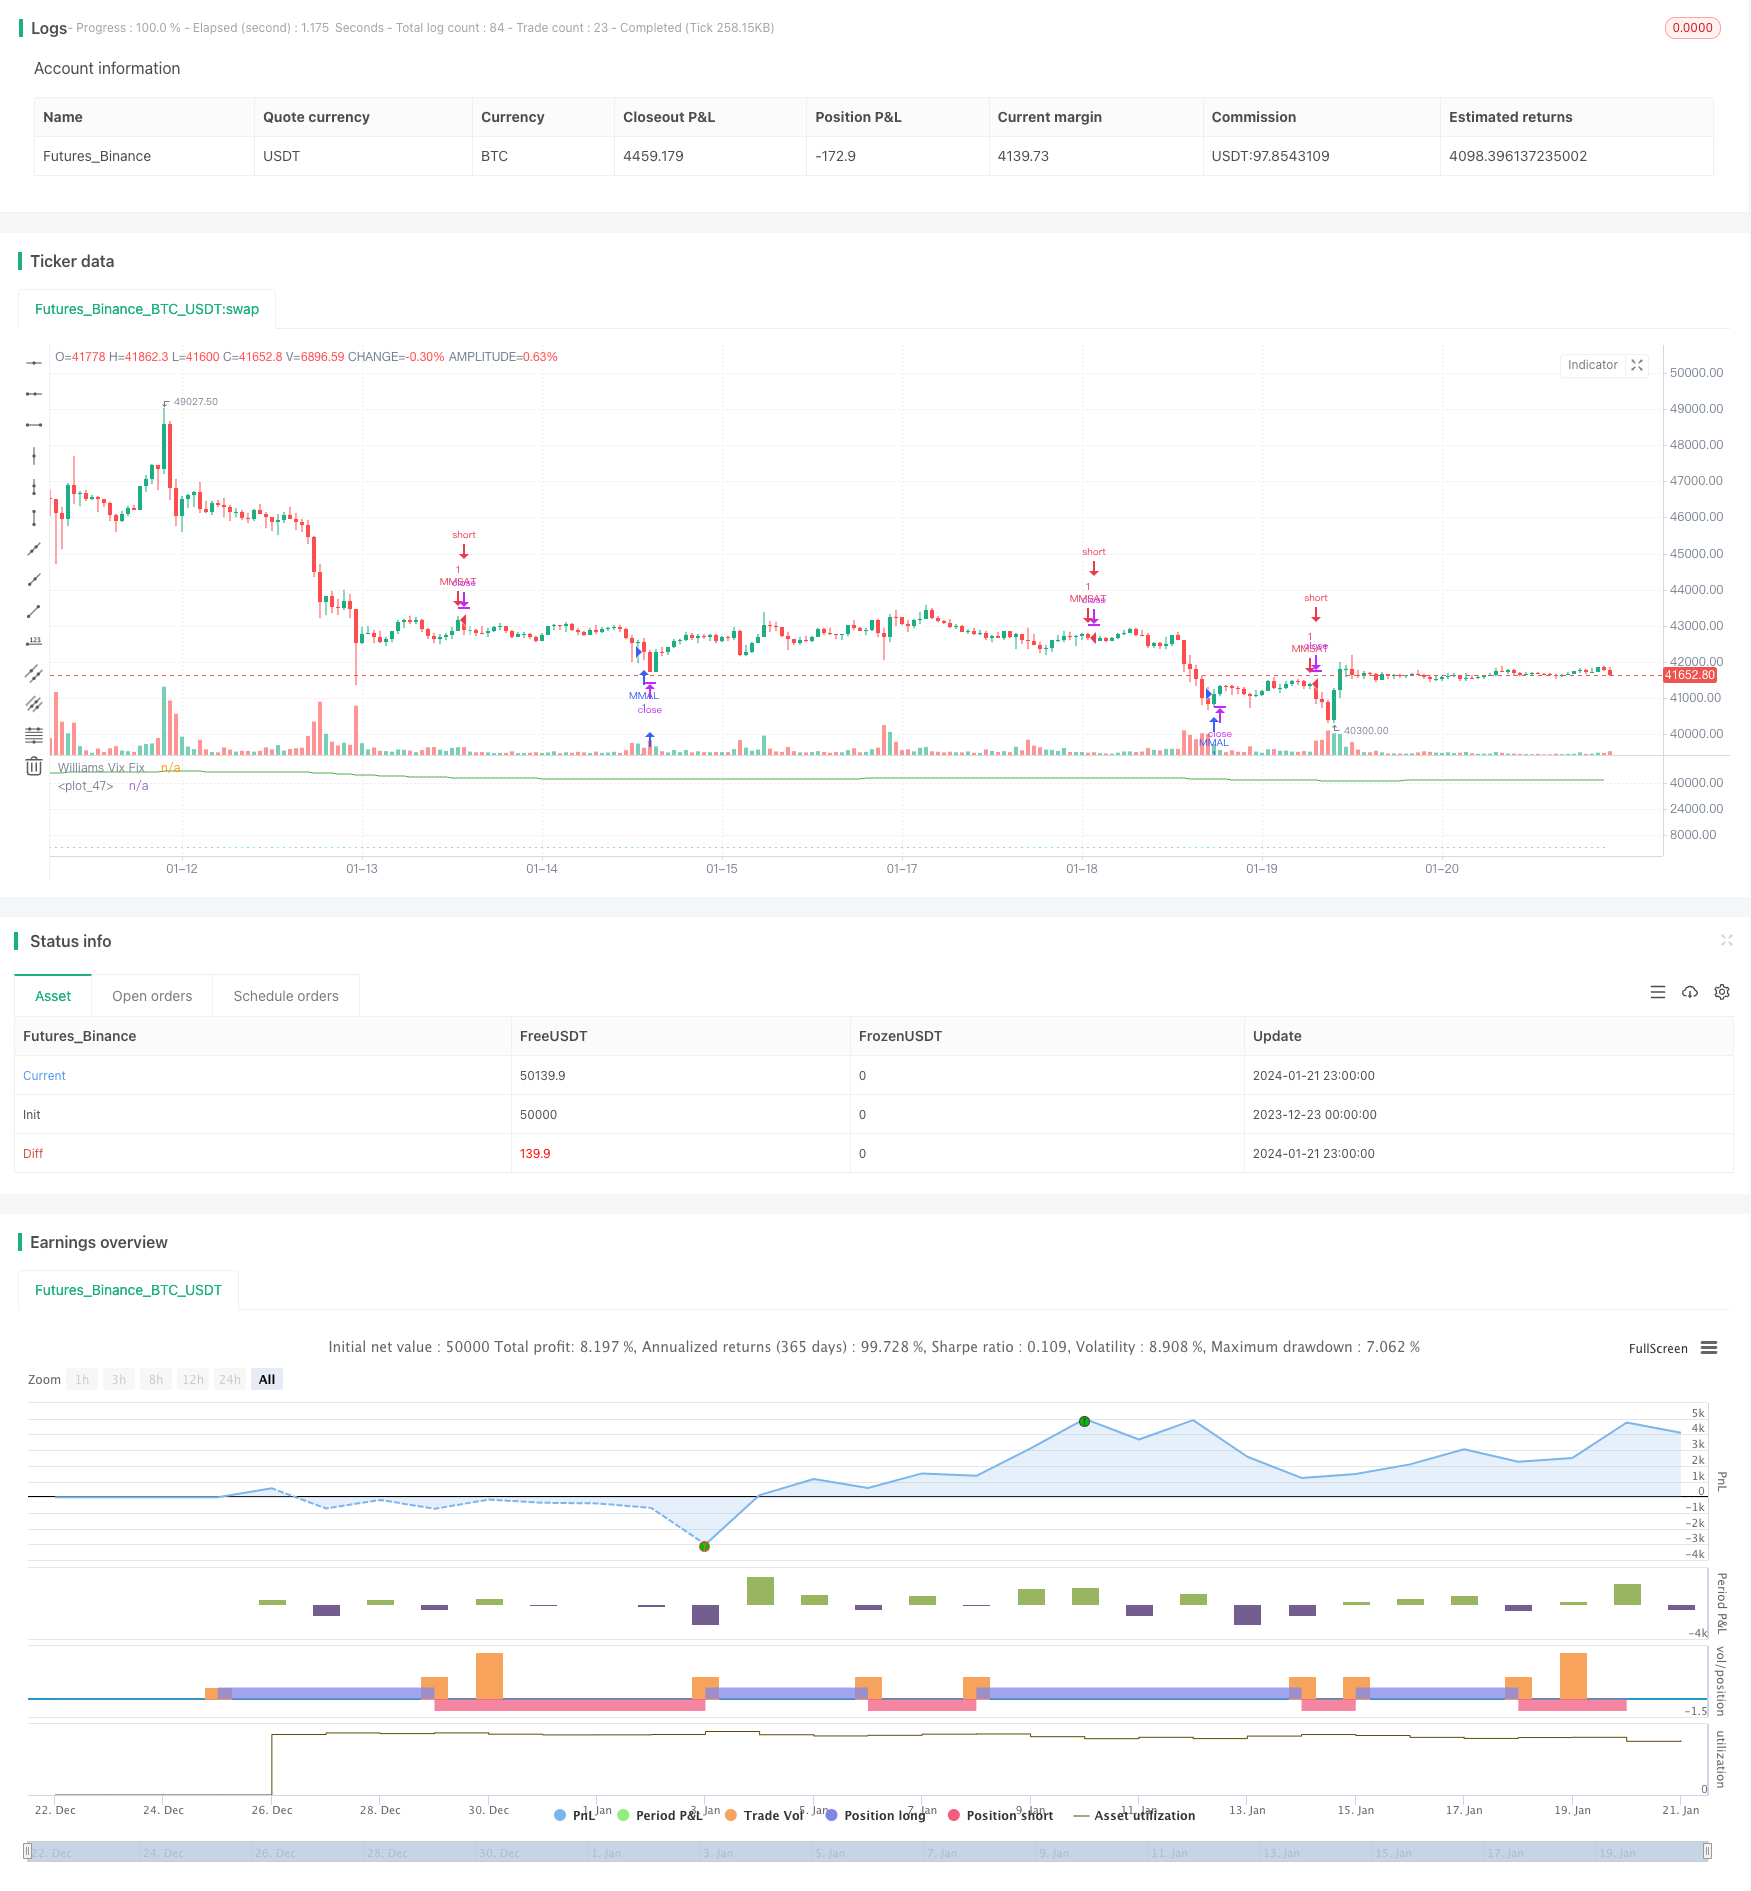
Overview
This strategy first calculates the Williams VIX indicator by getting the difference between the highest price and the lowest price over a certain period divided by the highest price. Then, combining the idea of standard deviation from Bollinger Bands, it sets the upper and lower bands. At the same time, it sets the take profit range based on percentile over a certain period. In the entry part, when the price crosses below the upper band and is lower than the DEMA indicator, it goes long. When the price crosses above the lower band and is higher than the DEMA indicator, it goes short.
Strategy Logic
This strategy mainly utilizes the Williams VIX indicator to gauge market volatility and risk, while using the DEMA indicator to judge the price trend.
Firstly, the calculation formula for Williams VIX indicator is:
WVF = ((Highest(close, n) - Low) / (Highest(close, n))) * 100
Where n is the parameter period. This indicator reflects the volatility between the highest price and the lowest price over a certain period. The higher the value, the greater the volatility and higher the risk.
On this basis, the strategy employs the idea of Bollinger Bands. The upper band is set as middle band + n times standard deviation, and the lower band is set as middle band - n times standard deviation. When price approaches the upper band, it indicates expanding volatility and long opportunity; when price approaches the lower band, it indicates contracting volatility and short opportunity.
In addition, the strategy also sets a take profit range based on percentile principle over a period. For example, 90 percentile means the latest 90% price over the statistical period. When price surpasses this percentile, it indicates the volatility has been quite big and it's time to consider taking profit.
In the actual trading strategy, it incorporates DEMA indicator to judge the trend. It only goes long when price crosses below upper band and is lower than DEMA; it only goes short when price crosses above lower band and is higher than DEMA.
Advantage Analysis
This strategy combines the Williams VIX indicator which judges volatility, Bollinger Bands based on standard deviation, and DEMA indicator which judges the trend, making it very comprehensive to grasp the two key market factors: risk and trend.
Specifically, the Williams VIX combined with BB upper and lower bands can make risk and volatility judgments; the DEMA indicator can determine the price trend direction; the take profit range setting can lock in profits and avoid being too greedy.
Therefore, this strategy does very well in capturing risks and trends. It not only chooses better entry timing, but also avoids the reversal risk when decent profits have been made through the take profit range, making it a stable and conservative strategy.
Risk Analysis
The biggest risk of this strategy is that the volatility indicator and trend indicator may diverge. That is when the Williams VIX indicator shows increasing volatility and price nears the BB upper or lower bands, the DEMA indicator's judgement contradicts it. For example, volatility shows long opportunity but DEMA displays downward trend. There could be losses in situations like this.
In addition, excessively conservative take profit range settings could also hurt the strategy's profitability. If the percentile parameter is set too low, it would be hard to trigger taking profit, failing to lock in gains.
Optimization Directions
We could consider making take profit range parameters adjustable for different market environments. Specifically, in range-bound markets, appropriately lift percentile parameters to expand the profit taking range. But in obvious trending markets, lower the percentile parameter to take profits in time.
Also, we could consider adding other indicators to judge the trend. When the original DEMA diverges from the new indicators, suspend opening positions to avoid losses from false signals.
Conclusion
This strategy comprehensively utilizes volatility indicators, standard deviation principles, trend judgements and profit taking ideas to address market risk and trend changes very well. It is stable and conservative, suitable for long-term holdings. Through parameter optimization, the strategy's stability and profitability could be further enhanced.
Parameters
| Name | Default | What it controls |
|---|---|---|
| v_input_1 | 22 | LookBack Period Standard Deviation High |
| v_input_2 | 20 | Bolinger Band Length |
| v_input_3 | 2 | Bollinger Band Standard Devaition Up |
| v_input_4 | 2 | BB STD LOW |
| v_input_5 | 50 | Look Back Period Percentile High |
| v_input_6 | 0.85 | Highest Percentile - 0.90=90%, 0.95=95%, 0.99=99% |
| v_input_7 | 1.01 | Lowest Percentile - 1.10=90%, 1.05=95%, 1.01=99% |
| v_input_8 | false | Show High Range - Based on Percentile and LookBack Period? |
| v_input_9 | false | Show Standard Deviation Line? |
| v_input_10 | 2018 | yearfrom |
| v_input_11 | 2019 | yearuntil |
| v_input_12 | true | monthfrom |
| v_input_13 | 12 | monthuntil |
| v_input_14 | true | dayfrom |
| v_input_15 | 31 | dayuntil |
| v_input_16 | 50 | lengthema |
| v_input_17_close | 0 | Source: close | high | low | open | hl2 | hlc3 | hlcc4 | ohlc4 |
Source Pine Script
/*backtest
start: 2023-12-23 00:00:00
end: 2024-01-22 00:00:00
period: 1h
basePeriod: 15m
exchanges: [{"eid":"Futures_Binance","currency":"BTC_USDT"}]
*/

//@version=2

strategy("VIX and DEMA", overlay=false)
pd = input(22, title="LookBack Period Standard Deviation High")
bbl = input(20, title="Bolinger Band Length")
multupper = input(2.0    , minval=1, maxval=5, title="Bollinger Band Standard Devaition Up")
multlow = input(2.0,minval=1,maxval=5,title="BB STD LOW")
lb = input(50  , title="Look Back Period Percentile High")
ph = input(.85, title="Highest Percentile - 0.90=90%, 0.95=95%, 0.99=99%")
pl = input(1.01, title="Lowest Percentile - 1.10=90%, 1.05=95%, 1.01=99%")
hp = input(false, title="Show High Range - Based on Percentile and LookBack Period?")
sd = input(false, title="Show Standard Deviation Line?")

wvf = ((highest(close, pd)-low)/(highest(close, pd)))*100

sDevupper = multupper * stdev(wvf, bbl)
sDevlow = multlow *stdev(wvf,bbl)
midLine = sma(wvf, bbl)
lowerBand = midLine - sDevlow
upperBand = midLine + sDevupper

rangeHigh = (highest(wvf, lb)) * ph
rangeLow = (lowest(wvf, lb)) * pl

col = wvf >= upperBand or wvf >= rangeHigh ? lime : gray
price=close


plot(hp and rangeHigh ? rangeHigh : na, title="Range High Percentile", style=line, linewidth=4, color=orange)
plot(hp and rangeLow ? rangeLow : na, title="Range High Percentile", style=line, linewidth=4, color=orange)
plot(wvf, title="Williams Vix Fix", style=histogram, linewidth = 4, color=col)
plot(sd and upperBand ? upperBand : na, title="Upper Band", style=line, linewidth = 3, color=aqua)

yearfrom = input(2018)
yearuntil =input(2019)
monthfrom =input(1)
monthuntil =input(12)
dayfrom=input(1)
dayuntil=input(31)


lengthema = input(50, minval=1)
src = input(close, title="Source")
e1 = ema(src, lengthema)
e2 = ema(e1, lengthema)
dema = 2 * e1 - e2
plot(dema, color=green)


if ((crossunder(wvf,upperBand) ) and (price<dema) )
    strategy.entry("MMAL", strategy.long, stop=close, oca_name="TREND",  comment="AL")

else
    strategy.cancel(id="MMAL")


if   ((( (wvf<lowerBand) ) and  (price>dema) ) )

    strategy.entry("MMSAT", strategy.short,stop=close, oca_name="TREND",  comment="SAT")
else
    strategy.cancel(id="MMSAT")
Published by ChaoZhang on the FMZ strategy square · last modified 2024-01-23. Collected in the Quant Trading Vault. Unvalidated research: re-test with your own data and costs before trusting it.
Build this with AgenKit
A spec is not a trading system. Paste this into your coding agent and AgenKit runs a specialist team — architecture, test-first build, risk gates, review — with paper trading on by default.
/agenkit build a production-grade trading bot with a backtest engine, risk controls and paper trading by default from strategies/Volatility-and-Trend-Tracking-Strategy-Across-Timeframes-Based-on-Williams-VIX-and-DEMA.md- npx agenkit install engineering-kit in your project
- Paste the command into your agent and approve each phase
- Get tests, backtest, risk controls and a paper-trading switch
Understand it first
Before you run this, read the lesson behind the idea and how to backtest it honestly. Specs like this one are the survivors of an unknown number of trials; deflate their results accordingly.
Related specs
- ATR and Moving Average Crossover Hybrid StrategyPine Script · Trend following · 1h
- Bollinger Band Moving Average Crossover StrategyPine Script · Trend following · 1h
- Bollinger Bands and EMA Trend Following StrategyPine Script · Trend following · 1h
- Bollinger Bands and RSI Trend Following StrategyPine Script · Trend following · 1h
- Dual Moving Average Crossover Dynamic Position Optimization Strategy with EMA Cross Signal SystemPine Script · Trend following · 1h
- EMA Cross Trend Following Strategy with SMA Stop Loss and Re Entry MechanismPine Script · Trend following · 1h