VWMA ADX Momentum and Trend Based Bitcoin Long Strategy
This strategy utilizes multiple moving averages (VWMA), the Average Directional Index (ADX), and the Directional Movement Indicator (DMI) to capture long opportunities in the Bitcoin market. By combining price…
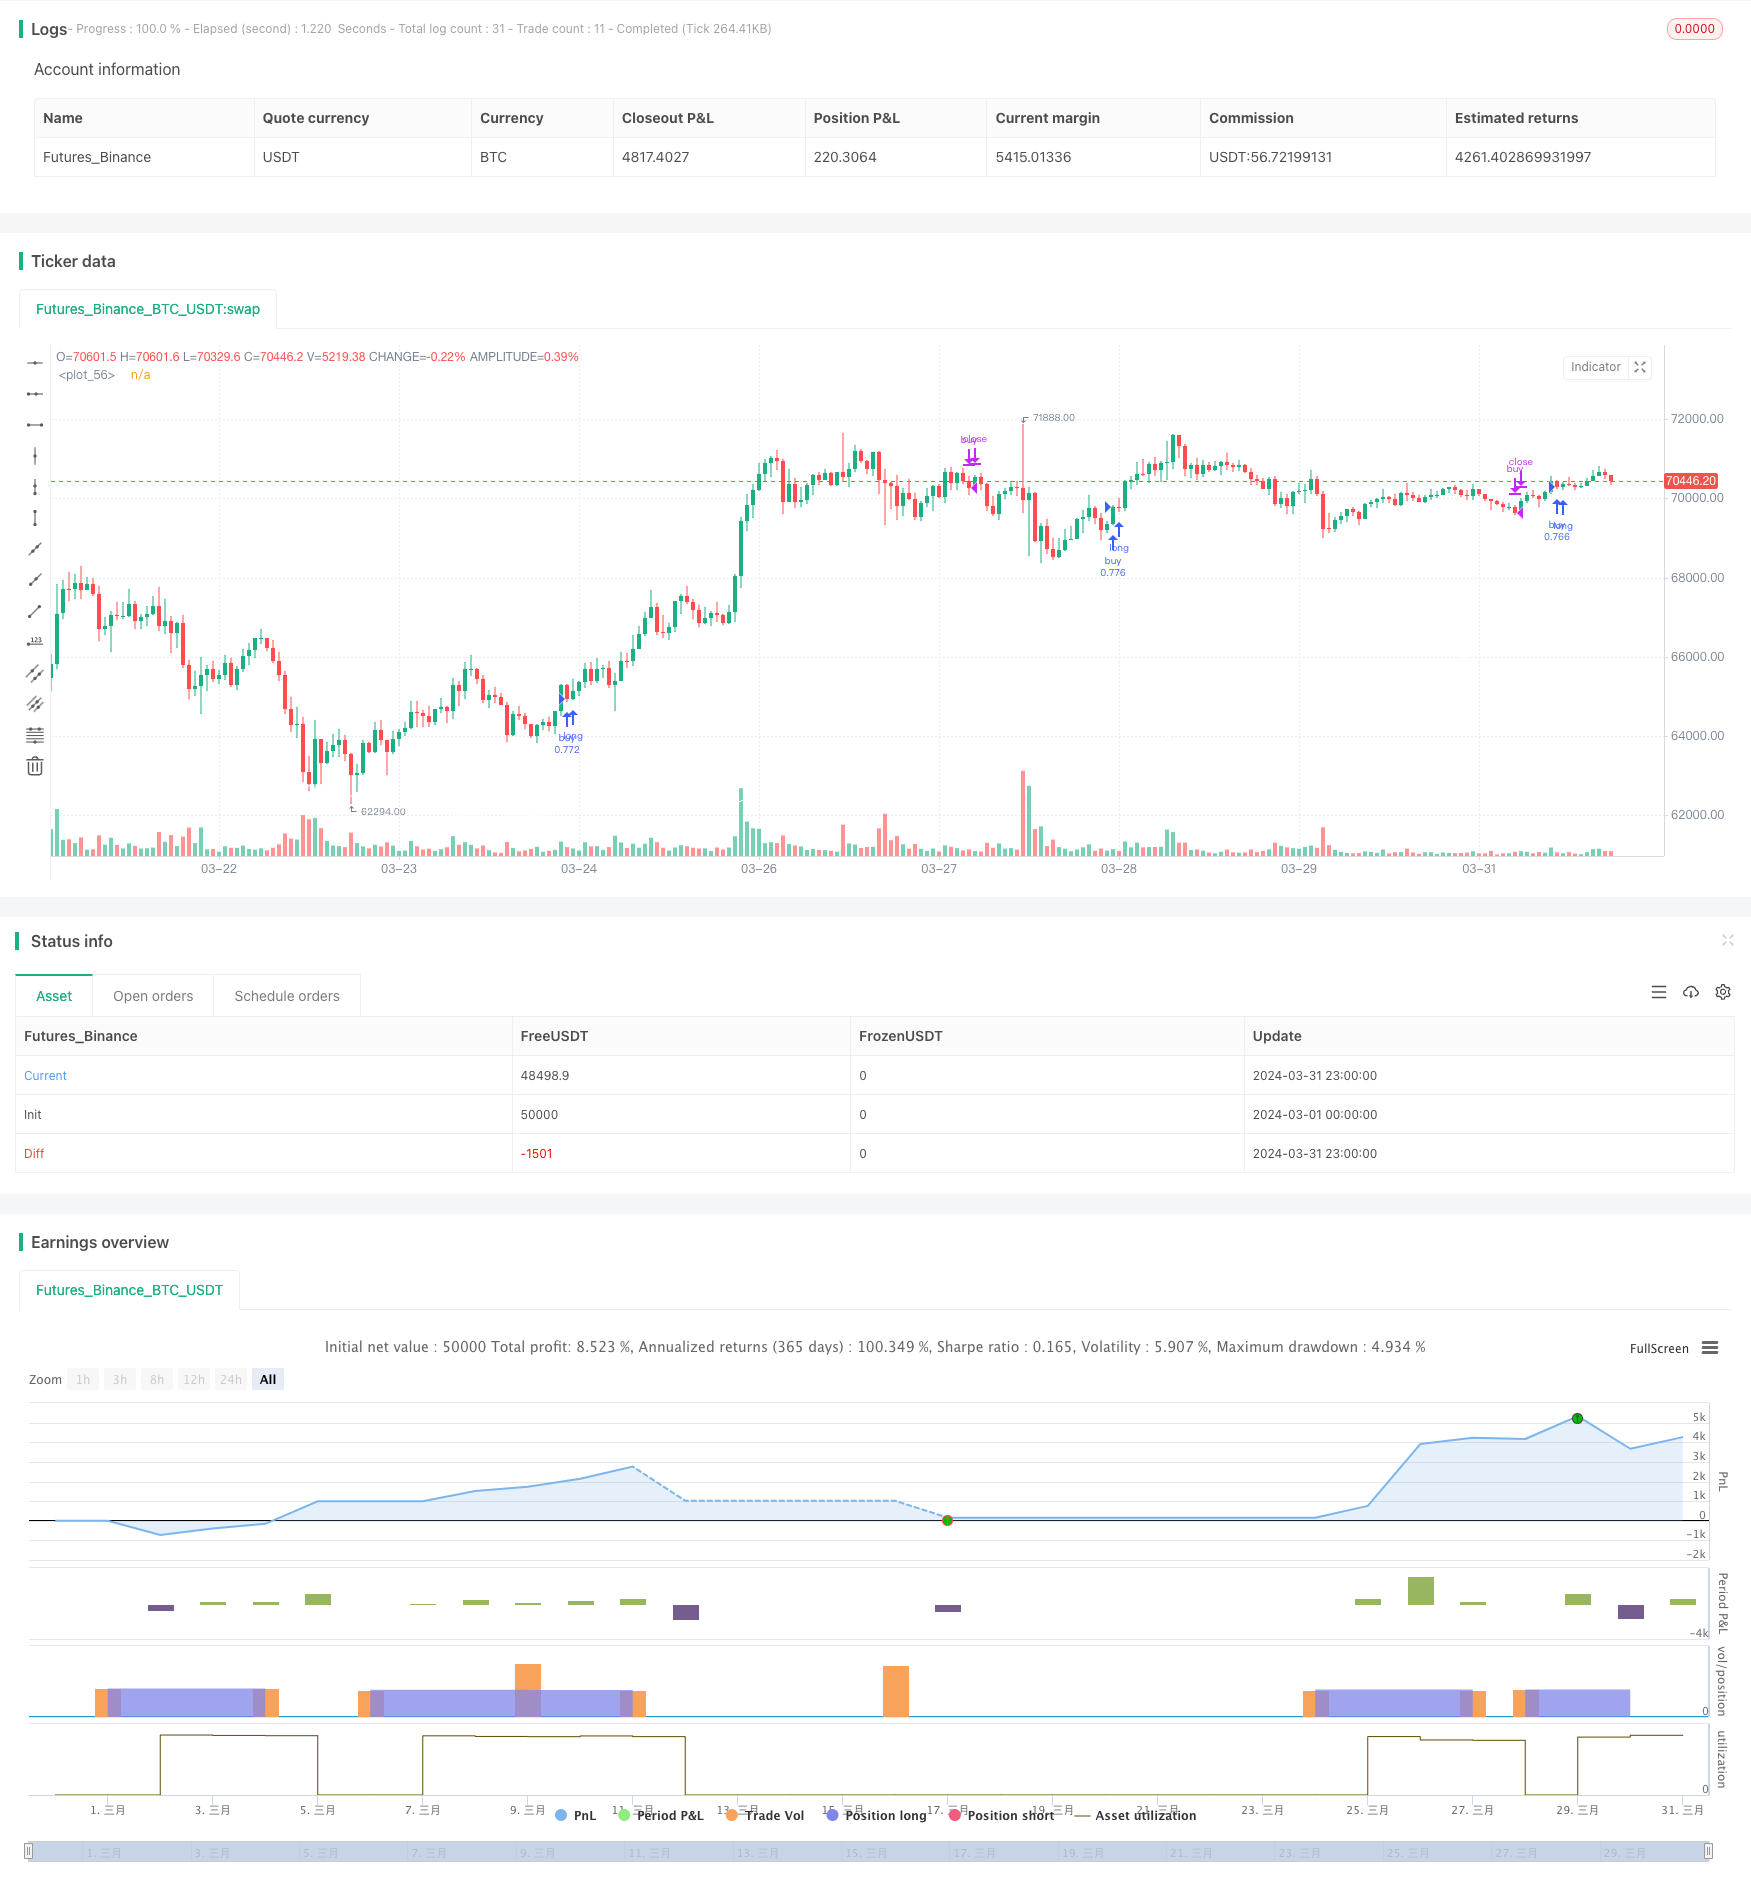
Overview
This strategy utilizes multiple moving averages (VWMA), the Average Directional Index (ADX), and the Directional Movement Indicator (DMI) to capture long opportunities in the Bitcoin market. By combining price momentum, trend direction, and trading volume, the strategy aims to find entry points with strong upward trends and sufficient momentum while strictly controlling risk.
Strategy Principles
- Use the 9-day and 14-day VWMA to determine the long trend. A bullish signal is generated when the short-term moving average crosses above the long-term moving average.
- Introduce an adaptive moving average constructed from the 89-day highest and lowest price VWMA as a trend filter. Only consider opening a position when the closing price or opening price is above this moving average.
- Confirm trend strength using the ADX and DMI indicators. The trend is considered strong enough only when the ADX is greater than 18 and the difference between +DI and -DI is greater than 15.
- Filter out bars with trading volume between the 60% and 95% percentiles using the volume percentile function to avoid periods with low trading volume.
- Set the stop-loss level at 0.96 to 0.99 times the previous candle's high, decreasing as the time frame increases to control risk.
- Close the position when the predefined holding time is reached or the price falls below the adaptive moving average.
Advantage Analysis
- By combining multiple technical indicators, the strategy evaluates market conditions from various dimensions such as trend, momentum, and trading volume, making the signals more reliable.
- The adaptive moving average and trading volume filtering mechanism effectively filter out false signals and reduce invalid trades.
- Strict stop-loss settings and holding time limits greatly reduce the strategy's risk exposure.
- The modular design of the code enhances readability and maintainability, facilitating further optimization and expansion.
Risk Analysis
- When the market is fluctuating or the trend is unclear, the strategy may generate more false signals.
- The stop-loss level is relatively tight, which may trigger premature stop-outs and lead to increased losses during large market fluctuations.
- The strategy lacks consideration of macroeconomic conditions and significant events, and may fail in the face of "black swan" events.
- The parameter settings are relatively fixed and lack adaptability, which may result in unstable performance in different market environments.
Optimization Directions
- Introduce more indicators that can capture market conditions, such as the Relative Strength Index (RSI) and Bollinger Bands, to improve signal reliability.
- Dynamically optimize the stop-loss level, for example, by using Average True Range (ATR) or percentage-based stop-loss, to adapt to different market volatility conditions.
- Enhance the strategy's risk control module by incorporating macroeconomic data and sentiment analysis.
- Utilize machine learning algorithms to automatically optimize parameters, improving the strategy's adaptability and stability.
Summary
The VWMA-ADX Bitcoin Long Strategy effectively captures upward opportunities in the Bitcoin market by comprehensively considering price trends, momentum, trading volume, and other technical indicators. At the same time, strict risk control measures and clear exit conditions ensure that the strategy's risk is well-controlled. However, the strategy also has some limitations, such as insufficient adaptability to changing market environments and the need for optimized stop-loss strategies. In the future, improvements can be made in terms of signal reliability, risk control, and parameter optimization to further enhance the strategy's robustness and profitability. Overall, the VWMA-ADX Bitcoin Long Strategy provides investors with a systematic trading approach based on momentum and trend, which is worth further exploration and refinement.
Source Pine Script
/*backtest
start: 2024-03-01 00:00:00
end: 2024-03-31 23:59:59
period: 1h
basePeriod: 15m
exchanges: [{"eid":"Futures_Binance","currency":"BTC_USDT"}]
*/

// This Pine Script™ code is subject to the terms of the Mozilla Public License 2.0 at https://mozilla.org/MPL/2.0/
// © Q_D_Nam_N_96

//@version=5
strategy("Long BTC Strategy", overlay=true,
     default_qty_type = strategy.percent_of_equity,
     default_qty_value = 100, initial_capital = 1000, currency = currency.USD)

Volume_Quartile(vol) =>
    qvol1 = ta.percentile_linear_interpolation(vol, 60,15)
    qvol2 = ta.percentile_linear_interpolation(vol, 60,95)
    vol > qvol1 and vol < qvol2

smma(src, length) =>
	smma =  0.0
	smma := na(smma[1]) ? ta.sma(src, length) : (smma[1] * (length - 1) + src) / length
	smma

ma(source, length, type) =>
    switch type
        "SMA" => ta.sma(source, length)
        "EMA" => ta.ema(source, length)
        "RMA" => ta.rma(source, length)
        "WMA" => ta.wma(source, length)
        "VWMA" => ta.vwma(source, length)
        "HMA" => ta.hma(source, length)
        "SMMA" => smma(source, length)

DMI(len, lensig) =>
    up = ta.change(high)
    down = -ta.change(low)
    plusDM = na(up) ? na : (up > down and up > 0 ? up : 0)
    minusDM = na(down) ? na : (down > up and down > 0 ? down : 0)
    trur = ta.rma(ta.tr, len)
    plus = fixnan(100 * ta.rma(plusDM, len) / trur)+11
    minus = fixnan(100 * ta.rma(minusDM, len) / trur)-11
    sum = plus + minus
    adx = 100 * ta.vwma(math.abs(plus - minus-11) / (sum == 0 ? 1 : sum), lensig)

    [adx, plus, minus]

cond1 = Volume_Quartile(volume*hlcc4)

ma1 = ma(close,9, "VWMA")
// plot(ma1, color = color.blue)
ma2 = ma(close,14, "VWMA")
// plot(ma2, color = color.orange)

n = switch timeframe.period
    "240" => 0.997
    => 0.995

ma3 = (0.1*ma(ta.highest(close,89),89, "VWMA") +
     0.9*ma(ta.lowest(close,89),89, "VWMA"))*n

plot(ma3, color = color.white)

[adx, plus, minus] = DMI(7, 10)


cond2 = adx > 18 and plus - math.abs(minus) > 15

var int count = 0

if barstate.isconfirmed and strategy.position_size != 0
    count += 1
else
    count := 0

p_roc = 0
if timeframe.period == '240'
    p_roc := 14
else
    p_roc := 10

longCondition = ta.crossover(ma1, ma2) and (close > open ? close > ma3 : open > ma3) and ((ma3 - ma3[1])*100/ma3[1] >= -0.2) and ((close-close[p_roc])*100/close[p_roc] > -2.0)
float alpha = 0.0
float sl_src = high[1]
if (longCondition and cond1 and cond2 and strategy.position_size == 0)
    strategy.entry("buy", strategy.long)
    if timeframe.period == '240'
        alpha := 0.96
        strategy.exit("exit-buy","buy", stop = sl_src*alpha)
        // line.new(bar_index, sl_src*alpha, bar_index+5, sl_src*alpha, width = 2, color = color.white)
    else if timeframe.period == '30'
        alpha := 0.985
        strategy.exit("exit-buy","buy", stop = sl_src*alpha)
        // line.new(bar_index, sl_src*alpha, bar_index+20, sl_src*alpha, width = 2, color = color.white)
    else if timeframe.period == '45'
        alpha := 0.985
        strategy.exit("exit-buy","buy", stop = sl_src*alpha)
        // line.new(bar_index, sl_src*alpha, bar_index+20, sl_src*alpha, width = 2, color = color.white)
    else if timeframe.period == '60'
        alpha := 0.98
        strategy.exit("exit-buy","buy", stop = sl_src*alpha)
        // line.new(bar_index, sl_src*alpha, bar_index+20, sl_src*alpha, width = 2, color = color.white)
    else if timeframe.period == '120'
        alpha := 0.97
        strategy.exit("exit-buy","buy", stop = sl_src*alpha)
        // line.new(bar_index, sl_src*alpha, bar_index+20, sl_src*alpha, width = 2, color = color.white)
    else if timeframe.period == '180'
        alpha := 0.96
        strategy.exit("exit-buy","buy", stop = sl_src*alpha)
        // line.new(bar_index, sl_src*alpha, bar_index+20, sl_src*alpha, width = 2, color = color.white)
    else if timeframe.period == 'D'
        alpha := 0.95
        strategy.exit("exit-buy","buy", stop = sl_src*alpha)
        // line.new(bar_index, sl_src*alpha, bar_index+20, sl_src*alpha, width = 2, color = color.white)
    else
        alpha := 0.93
        strategy.exit("exit-buy","buy", stop = sl_src*alpha)
        // line.new(bar_index, sl_src*alpha, bar_index+20, sl_src*alpha, width = 2, color = color.white)

period = switch timeframe.period
    "240" => 90
    "180" => 59
    "120" => 35
    "30" => 64
    "45" => 40
    "60" => 66
    "D" => 22
    => 64

if (count > period or close < ma3)
strategy.close('buy', immediately = true) Published by ChaoZhang on the FMZ strategy square · last modified 2024-04-03. Collected in the Quant Trading Vault. Unvalidated research: re-test with your own data and costs before trusting it.
Build this with AgenKit
A spec is not a trading system. Paste this into your coding agent and AgenKit runs a specialist team — architecture, test-first build, risk gates, review — with paper trading on by default.
/agenkit build a production-grade trading bot with a backtest engine, risk controls and paper trading by default from strategies/VWMA-ADX-Momentum-and-Trend-Based-Bitcoin-Long-Strategy.md- npx agenkit install engineering-kit in your project
- Paste the command into your agent and approve each phase
- Get tests, backtest, risk controls and a paper-trading switch
Understand it first
Before you run this, read the lesson behind the idea and how to backtest it honestly. Specs like this one are the survivors of an unknown number of trials; deflate their results accordingly.
Related specs
- Advanced EMA Crossover Momentum Trend Capture StrategyPine Script · Momentum · 2h
- Triple Moving Average Momentum Trend Trading StrategyPine Script · Momentum · 2d
- Multi Indicator Adaptive Momentum Crossover Trading SystemPine Script · Momentum · 1h
- Multi Indicator Dynamic Stop Loss Momentum Trend Trading StrategyPine Script · Momentum · 1h
- ADX Momentum Trend StrategyPine Script · Momentum · 10m
- KST EMA Momentum Trend Following StrategyPine Script · Momentum · 1d