Weighted Standard Deviation Trading Strategy
This strategy uses the weighted standard deviation indicator combined with moving average to implement trend trading on cryptocurrencies. It calculates a price channel of weighted standard deviation based on closing…
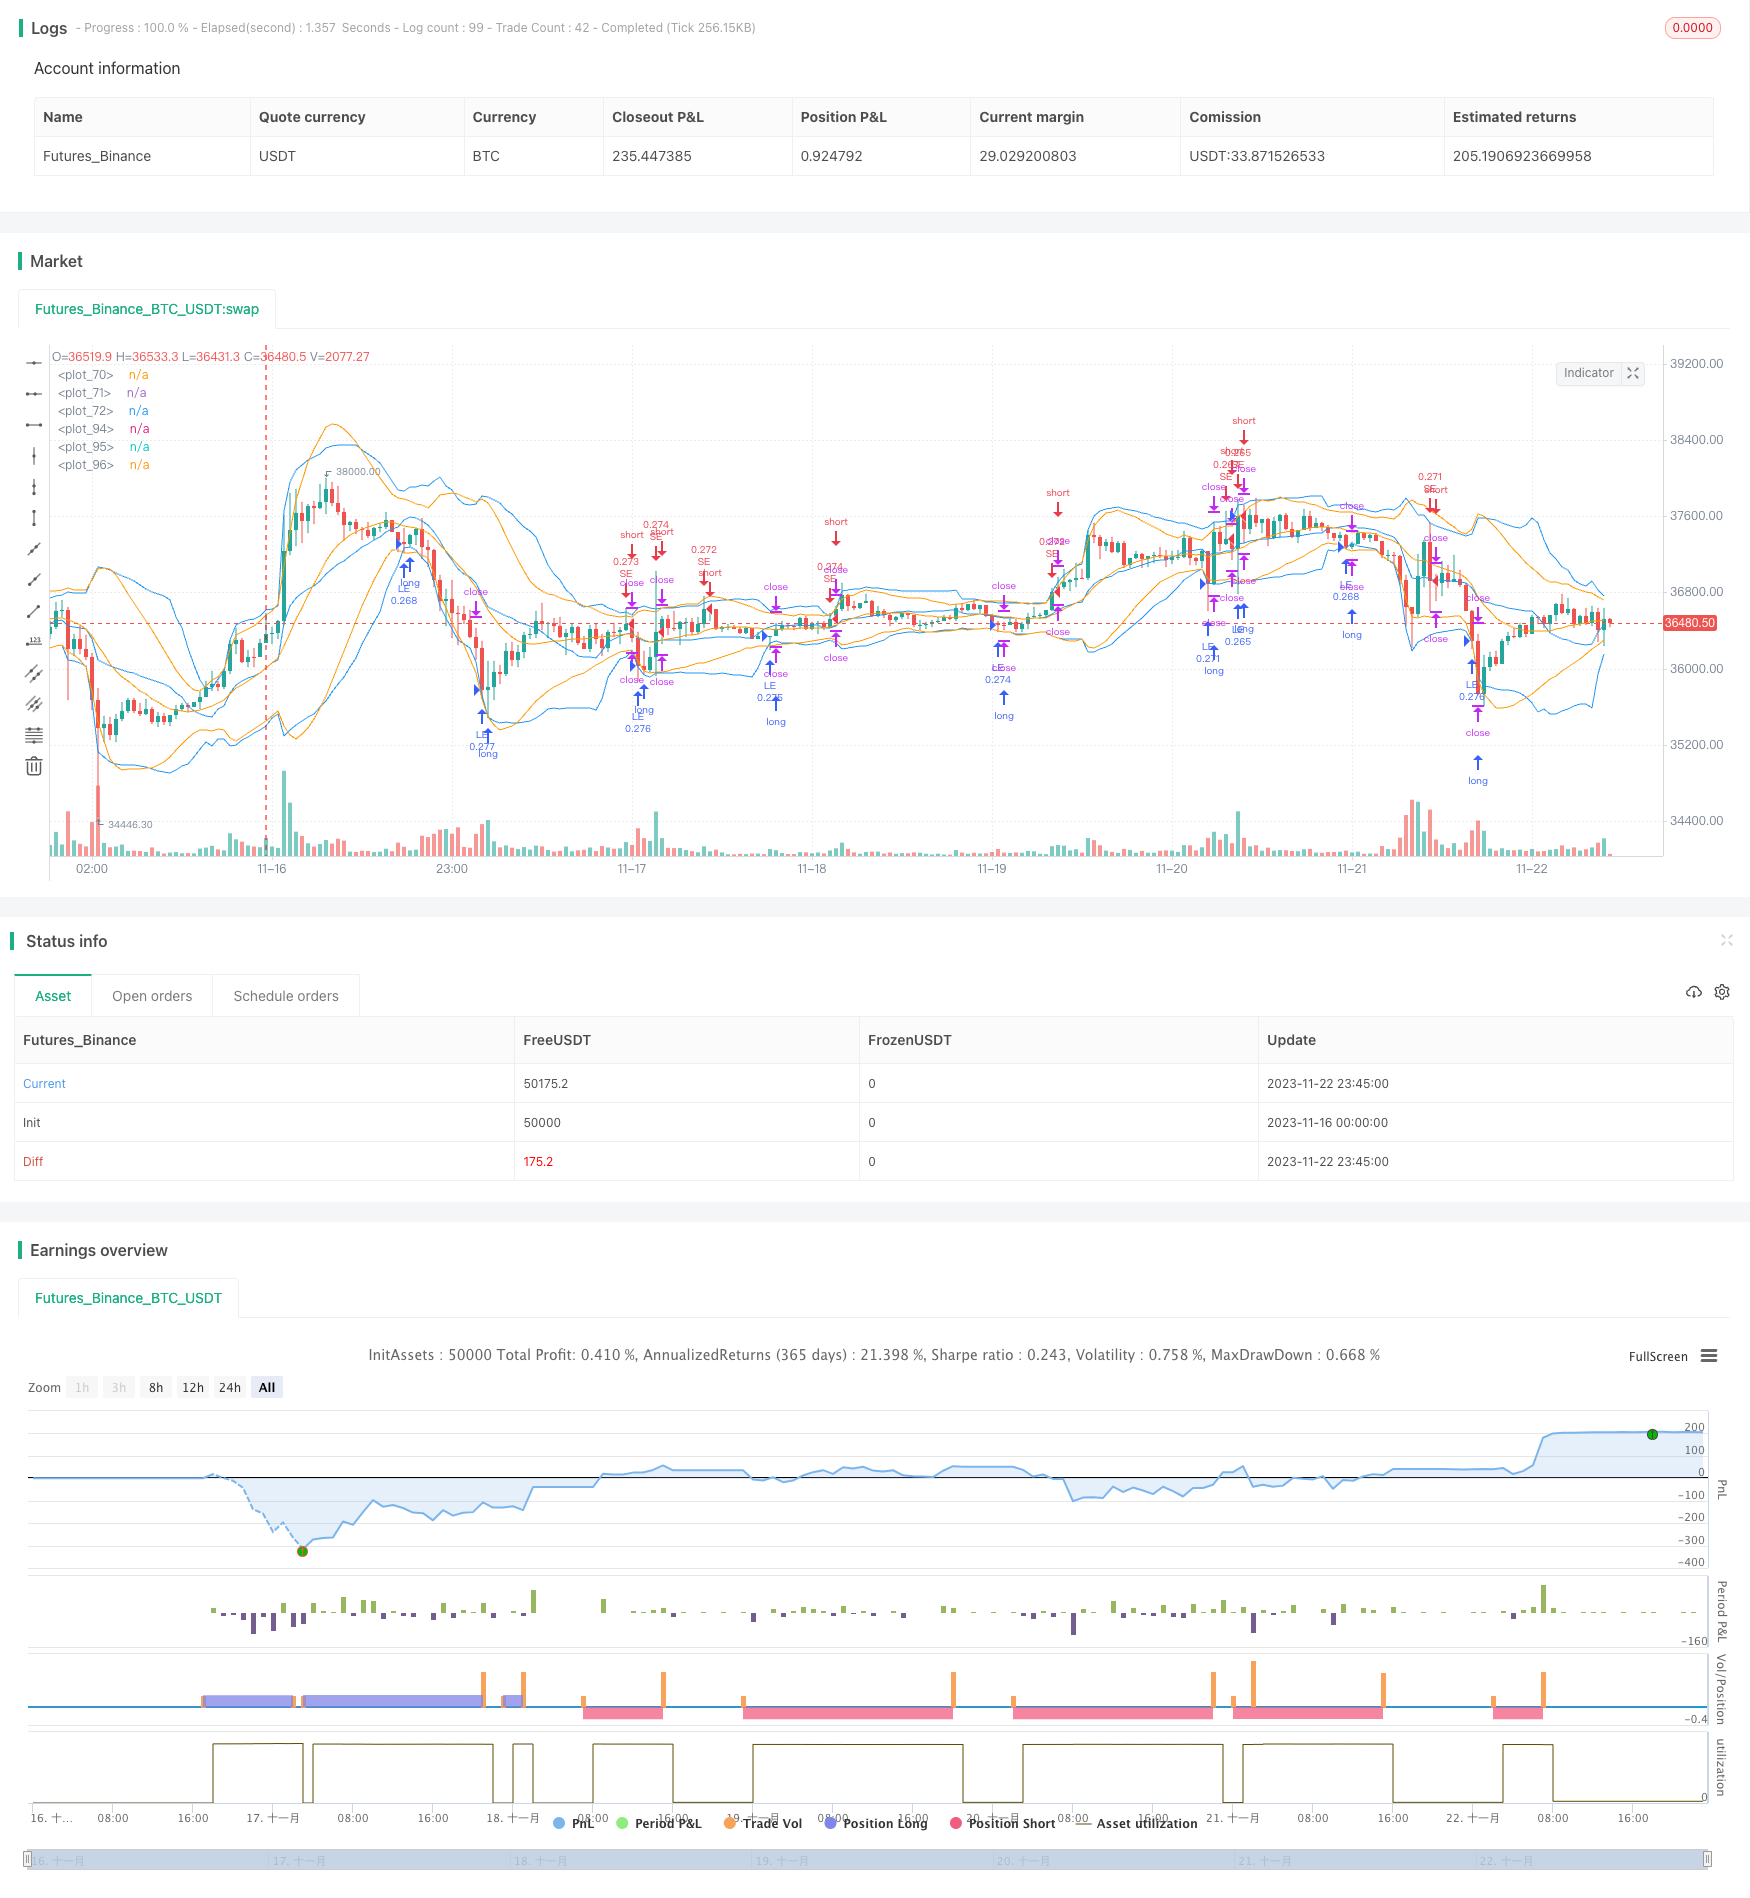
Overview
This strategy uses the weighted standard deviation indicator combined with moving average to implement trend trading on cryptocurrencies. It calculates a price channel of weighted standard deviation based on closing prices and volumes over a certain period. When the price breaks through the upper or lower channel, long or short positions are taken. Stop loss and take profit conditions are also set to limit losses per trade.
Strategy Logic
The code defines two custom functions to calculate weighted standard deviation from time series and arrays. The key steps are:
- Calculate the weighted average price based on closing price and volume
- Calculate the squared error of each candle vs the average price
- Calculate variance based on sample size, weights and adjusted mean
- Take square root to derive standard deviation
This gives us a channel centered on the weighted average price, with upper and lower bounds at one standard deviation away. When price breaks through the channel bottom from below, go long. When it breaks through the top from above, go short.
Advantage Analysis
The biggest edge of this strategy is the combination of moving average and volatility analysis. The MA judges the market trend direction while the SD range defines a sensible band - both verify each other for higher reliability. Also, the volume weighting helps filter false breaks for higher success probability on actual breaks.
The stop loss and take profit points further help trade with the trend and avoid excessive losses on reversals. This is a subtlety that many novice traders fail to implement.
Risk Analysis
The main risk is from violent market swings. This can cause the SD channel to swing wildly too, making judgements difficult. Also, choosing too short periods risks getting misled by noise and errors.
The remedy is to smooth the parameters and period settings appropriately. Consider combining other indicators like RSI to improve breakout confirmation.
Optimization Directions
- Optimize period parameters - test 5min, 15min, 30mins etc for best combo
- Optimize stop loss/take profit ratios for maximum return
- Add filters eg volume to avoid false breaks
- Add candlestick filters on close price, wick etc to improve accuracy
Conclusion
This strategy successfully employs the weighted standard deviation indicator together with MA to track cryptocurrency trends. Reasonable stop loss/take profit setups also help trade market rhythm and avoid excessive reversal losses. Further optimizations via parameter tuning and multi-indicator confirmation can improve reliability for a solid algo trading strategy.
Parameters
| Name | Default | What it controls |
|---|---|---|
| v_input_1 | 20 | len |
| v_input_2 | 3.11 | Stop Loss % |
| v_input_3 | 7.5 | Take Profit % |
Source Pine Script
/*backtest
start: 2023-11-16 00:00:00
end: 2023-11-23 00:00:00
period: 45m
basePeriod: 5m
exchanges: [{"eid":"Futures_Binance","currency":"BTC_USDT"}]
*/

// This source code is subject to the terms of the Mozilla Public License 2.0 at https://mozilla.org/MPL/2.0/
// © rumpypumpydumpy   © cache_that_pass

//@version=4
strategy("[cache_that_pass] 1m 15m Function - Weighted Standard Deviation", overlay=true, pyramiding=0, default_qty_type=strategy.percent_of_equity, default_qty_value=20, initial_capital=10000, commission_type=strategy.commission.percent, commission_value=0.075)

f_weighted_sd_from_series(_src, _weight, _n) => //{
//  @function: Calculates weighted mean, variance, standard deviation, MSE and RMSE from time series variables
//  @parameters:
//      _src: time series variable of sample values
//      _weight: time series of corresponding weight values.
//      _n : number of samples
    _xw = _src * _weight
    _sum_weight = sum(_weight, _n)
    _mean = sum(_xw, _n) / _sum_weight
    float _sqerror_sum = 0
    int _nonzero_n = 0
    for _i = 0 to _n - 1
        _sqerror_sum := _sqerror_sum + pow(_mean - _src[_i], 2) * _weight[_i]
        _nonzero_n := _weight[_i] != 0 ? _nonzero_n + 1 : _nonzero_n
    _variance = _sqerror_sum / ((_nonzero_n - 1) * _sum_weight / _nonzero_n)
    _dev = sqrt(_variance)
    _mse = _sqerror_sum / _sum_weight
    _rmse = sqrt(_mse)
    [_mean, _variance, _dev, _mse, _rmse]
//}
// -----------------------------------------------------------------------------

f_weighted_sd_from_arrays(_a_src, _a_weight, _n) => //{
//  @function: Calculates weighted mean, variance, standard deviation, MSE and RMSE from arrays
//  Expects index 0 of the arrays to be the most recent sample and weight values!
//  @parameters:
//      _a_src: array of sample values
//      _a_weight: array of corresponding weight values.
//      _n : number of samples
    float _mean = na, float _variance = na, float _dev = na, float _mse = na
    float _rmse = na, float _sqerror_sum = na, float _sum_weight = na
    float[] _a_xw = array.new_float(_n)
    int _nonzero_n = 0
    if array.size(_a_src) >= _n
        _sum_weight := 0
        _sqerror_sum := 0
        for _i = 0 to _n - 1
            array.set(_a_xw, _i, array.get(_a_src, _i) * array.get(_a_weight, _i))
            _sum_weight := _sum_weight + array.get(_a_weight, _i)
            _nonzero_n := array.get(_a_weight, _i) != 0 ? _nonzero_n + 1 : _nonzero_n
        _mean := array.sum(_a_xw) / _sum_weight
        for _j = 0 to _n - 1
            _sqerror_sum := _sqerror_sum + pow(_mean - array.get(_a_src, _j), 2) * array.get(_a_weight, _j)
        _variance := _sqerror_sum / ((_nonzero_n - 1) * _sum_weight / _nonzero_n)
        _dev := sqrt(_variance)
        _mse := _sqerror_sum / _sum_weight
        _rmse := sqrt(_mse)
    [_mean, _variance, _dev, _mse, _rmse]
//}


// -----------------------------------------------------------------------------
// Example usage :
// -----------------------------------------------------------------------------

len = input(20)

// -----------------------------------------------------------------------------
// From series :
// -----------------------------------------------------------------------------
[m, v, d, mse, rmse] = f_weighted_sd_from_series(close, volume, len)


plot(m, color = color.blue)
plot(m + d * 2, color = color.blue)
plot(m - d * 2, color = color.blue)
// -----------------------------------------------------------------------------


// -----------------------------------------------------------------------------
// From arrays :
// -----------------------------------------------------------------------------
var float[] a_src = array.new_float()
var float[] a_weight = array.new_float()

if barstate.isfirst
    for i = 1 to len
        array.unshift(a_weight, i)

array.unshift(a_src, close)

if array.size(a_src) > len
    array.pop(a_src)

[a_m, a_v, a_d, a_mse, a_rmse] = f_weighted_sd_from_arrays(a_src, a_weight, len)

plot(a_m, color = color.orange)
plot(a_m + a_d * 2, color = color.orange)
plot(a_m - a_d * 2, color = color.orange)
// -----------------------------------------------------------------------------


series_text = "Mean : " + tostring(m) + "\nVariance : " + tostring(v) + "\nSD : " + tostring(d) + "\nMSE : " + tostring(mse) +  "\nRMSE : " + tostring(rmse)
array_text = "Mean : " + tostring(a_m) + "\nVariance : " + tostring(a_v) + "\nSD : " + tostring(a_d) + "\nMSE : " + tostring(a_mse) +  "\nRMSE : " + tostring(a_rmse)
debug_text = "Volume weighted from time series : \n" + series_text + "\n\nLinearly weighted from arrays : \n" + array_text

//debug = label.new(x = bar_index, y = close, text = debug_text, style = label.style_label_left)
//.delete(debug[1])

//test strategy
if low <= (m - d * 2)
    strategy.entry("LE", strategy.long)
if high >= (m + d * 2)
    strategy.entry("SE", strategy.short)

// User Options to Change Inputs (%)
stopPer = input(3.11, title='Stop Loss %', type=input.float) / 100
takePer = input(7.50, title='Take Profit %', type=input.float) / 100

// Determine where you've entered and in what direction
longStop = strategy.position_avg_price * (1 - stopPer)
shortStop = strategy.position_avg_price * (1 + stopPer)
shortTake = strategy.position_avg_price * (1 - takePer)
longTake = strategy.position_avg_price * (1 + takePer)

if strategy.position_size > 0
    strategy.exit(id="Close Long", stop=longStop, limit=longTake)
//    strategy.close("LE", when = (longStop) or (longTake), qty_percent = 100)
if strategy.position_size < 0
    strategy.exit(id="Close Short", stop=shortStop, limit=shortTake)
// strategy.close("SE", when = (shortStop) or (shortTake), qty_percent = 100)Published by ChaoZhang on the FMZ strategy square · last modified 2023-11-24. Collected in the Quant Trading Vault. Unvalidated research: re-test with your own data and costs before trusting it.
Build this with AgenKit
A spec is not a trading system. Paste this into your coding agent and AgenKit runs a specialist team — architecture, test-first build, risk gates, review — with paper trading on by default.
/agenkit build a production-grade trading bot with a backtest engine, risk controls and paper trading by default from strategies/Weighted-Standard-Deviation-Trading-Strategy.md- npx agenkit install engineering-kit in your project
- Paste the command into your agent and approve each phase
- Get tests, backtest, risk controls and a paper-trading switch
Understand it first
Before you run this, read the lesson behind the idea and how to backtest it honestly. Specs like this one are the survivors of an unknown number of trials; deflate their results accordingly.
Related specs
- Bollinger Band Channel Breakout Trading StrategyPine Script · Breakout · 1d
- Bollinger Bands Dynamic Breakout StrategyPine Script · Breakout · 1h
- Bull Market Tracking SystemPine Script · Breakout · 1h
- Cross boundary Dynamic Range Quantitative Trading Strategy Based on Bollinger BandsPine Script · Breakout · 3h
- Cross period Value Area Breakout StrategyPine Script · Breakout · 1d
- Darvas Box Breakout and Risk Management Strategy DarvasPine Script · Breakout · 1d