Williams VIX Fix Strategy 430129
The Williams VIX Fix strategy calculates the corrected value of the CBOE Volatility Index VIX and combines multiple technical indicators such as Bollinger Bands, percentile ranges, and price momentum to determine and…
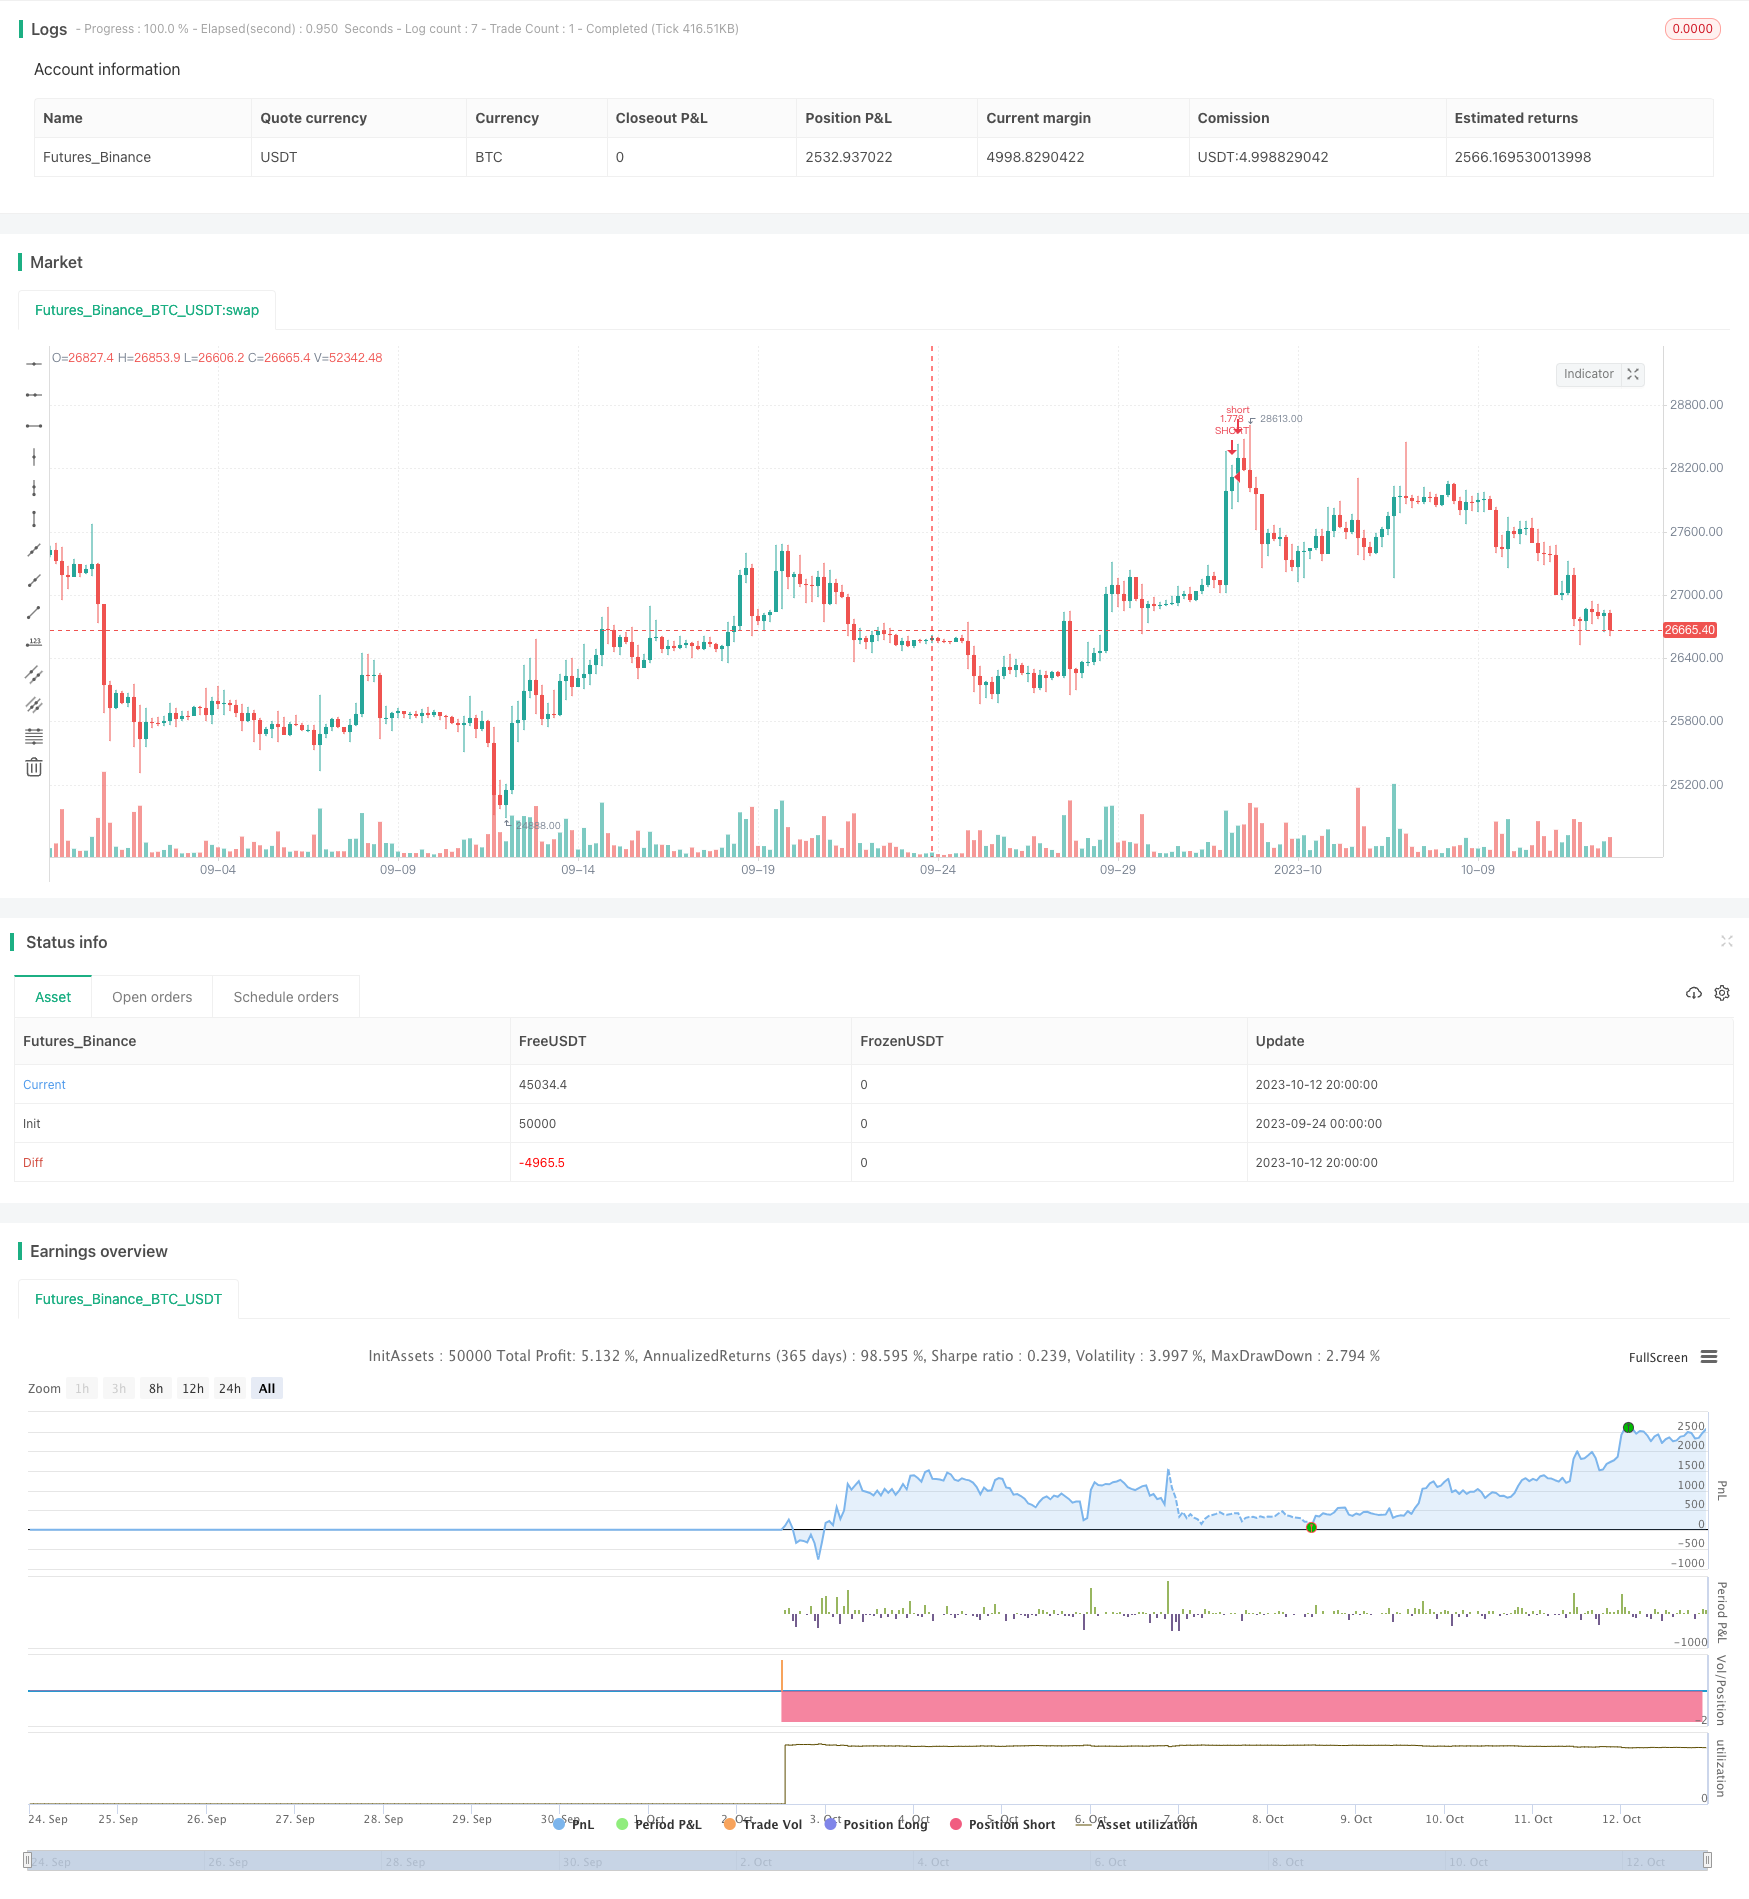
Overview
The Williams VIX Fix strategy calculates the corrected value of the CBOE Volatility Index VIX and combines multiple technical indicators such as Bollinger Bands, percentile ranges, and price momentum to determine and generate trading signals for VIX reversals. The strategy aims to capture the over-reversion phenomenon of the VIX index and take counter-trend trades during overbought and oversold situations.
Strategy Logic
The core logic of this strategy is based on the following points:
Calculate the Williams VIX Fix value (wvf) through the formula to capture fluctuations in the VIX.
Set Bollinger Band calculation parameters to obtain the midline, upper band, and lower band of the VIX index.
Set percentile range parameters to obtain the historical percentile range of the VIX index.
Use the repaired variable to determine if the VIX is at a reversal point. When repaired is true, it means the VIX was previously in an overbought or oversold state and is currently at a reversal point.
Further combine the price breakout nature (upRange, upRange_Aggr) to determine trend characteristics.
Finally, combine multiple conditions such as Bollinger Bands, percentile ranges, and price features to determine and generate trading signals.
The strategy takes full advantage of the mean reversion characteristics of the VIX and captures reversal opportunities through multiple parameter settings. The strategy logic is clear and reliable, which can effectively identify overbought and oversold opportunities.
Advantage Analysis
The strategy has the following advantages:
Take advantage of the VIX's reversion tendencies to profit when market uncertainty is very high.
The combination of multiple technical indicators for filtering can effectively identify reversal opportunities.
Adjustable parameters of the strategy can be optimized for different market environments.
Simple implementation, easy to understand and modify, suitable for live trading.
Makes full use of open-source code ideas and is easy to combine with other strategies.
The strategy shows relatively low market correlation and can serve as a hedging component in the portfolio.
Maximize eliminating ineffective trades and filter out non-reversal opportunities.
Moderate trading frequency, will not enter and exit too frequently.
Risk Analysis
The strategy also has some risks to note:
The VIX index itself has data issues that may affect strategy performance.
Reversal trading carries risk of losses. Losses may be exacerbated if the reversal is not reached.
The multiple parameter settings make parameter optimization quite complex.
Inaccurate reversal timing capture can lead to failed trades.
Reduced trading frequency may also miss some opportunities.
Both Bollinger Bands and percentile ranges are susceptible to false signals.
Inaccurate price breakout judgments can render the strategy ineffective.
The main risks can be reduced by:
Optimizing parameters to make reversal identification more accurate.
Appropriately increasing holding time to ensure reversal is established.
Adding more indicators for verification to avoid false signals.
Adjusting open position criteria to reduce ineffective trades.
Adding stops to control losses.
Optimization Directions
The strategy can be optimized in the following aspects:
Optimize Bollinger Band and percentile range parameters to improve reversal recognition accuracy.
Add more price momentum indicators to avoid trend misidentification.
Adjust opening position criteria to ensure higher trading efficiency.
Set different stop loss methods to control risks.
Hedge with VIX futures contracts.
Adjust parameters according to different market environments to make the strategy more adaptive.
Add machine learning models to determine reversal timing.
Combine with other alphas to increase overall return.
Incorporate quantitative methods for automatic parameter optimization.
Set range stops and trailing stops.
Summary
The Williams VIX Fix strategy captures the reversal characteristics of the VIX index and takes counter-trend trades during market panic. It is a typical hedging strategy. The strategy combines the advantages of various indicators, and parameters can control risks. With proper parameter optimization, it can achieve good risk-adjusted returns. However, trading frequency should not be too high, and risks must be controlled. Overall, the strategy logic is clear, uses open-source code strategy ideas, and is a VIX trading strategy that can be used in live trading.
Parameters
| Name | Default | What it controls |
|---|---|---|
| v_input_1 | 22 | LookBack Period Standard Deviation High |
| v_input_2 | 20 | Bolinger Band Length |
| v_input_3 | 2 | Bollinger Band Standard Devaition Up |
| v_input_4 | 50 | Look Back Period Percentile High |
| v_input_5 | 0.85 | Highest Percentile - 0.90=90%, 0.95=95%, 0.99=99% |
| v_input_6 | 40 | Long-Term Look Back Current Bar Has To Close Below This Value OR Medium Term--Default=40 |
| v_input_7 | 14 | Medium-Term Look Back Current Bar Has To Close Below This Value OR Long Term--Default=14 |
| v_input_8 | 3 | Entry Price Action Strength--Close > X Bars Back---Default=3 |
| v_input_9 | 8 | monthfrom |
| v_input_10 | 12 | monthuntil |
| v_input_11 | true | dayfrom |
| v_input_12 | 31 | dayuntil |
Source Pine Script
/*backtest
start: 2023-09-24 00:00:00
end: 2023-10-13 00:00:00
period: 4h
basePeriod: 15m
exchanges: [{"eid":"Futures_Binance","currency":"BTC_USDT"}]
*/

//@version=2
strategy(title = "CM Vix V3 Strategy ",shorttitle="Vix3", overlay = true,default_qty_type = strategy.percent_of_equity, default_qty_value = 100,commission_type=strategy.commission.percent,commission_value=0.1,initial_capital=100000)


pd = input(22, title="LookBack Period Standard Deviation High")
bbl = input(20, title="Bolinger Band Length")
mult = input(2.0    , minval=1, maxval=5, title="Bollinger Band Standard Devaition Up")
lb = input(50  , title="Look Back Period Percentile High")
ph = input(.85, title="Highest Percentile - 0.90=90%, 0.95=95%, 0.99=99%")

ltLB = input(40, minval=25, maxval=99, title="Long-Term Look Back Current Bar Has To Close Below This Value OR Medium Term--Default=40")
mtLB = input(14, minval=10, maxval=20, title="Medium-Term Look Back Current Bar Has To Close Below This Value OR Long Term--Default=14")
str = input(3, minval=1, maxval=9, title="Entry Price Action Strength--Close > X Bars Back---Default=3")


//Williams Vix Fix Formula
wvf = ((highest(close, pd)-low)/(highest(close, pd)))*100
sDev = mult * stdev(wvf, bbl)
midLine = sma(wvf, bbl)
lowerBand = midLine - sDev
upperBand = midLine + sDev
rangeHigh = (highest(wvf, lb)) * ph

//Filtered Bar Criteria
upRange = low > low[1] and close > high[1]
upRange_Aggr = close > close[1] and close > open[1]
//Filtered Criteria
filtered = ((wvf[1] >= upperBand[1] or wvf[1] >= rangeHigh[1]) and (wvf < upperBand and wvf < rangeHigh))
filtered_Aggr = (wvf[1] >= upperBand[1] or wvf[1] >= rangeHigh[1]) and not (wvf < upperBand and wvf < rangeHigh)

//Alerts Criteria
alert1 = wvf >= upperBand or wvf >= rangeHigh ? 1 : 0
alert2 = (wvf[1] >= upperBand[1] or wvf[1] >= rangeHigh[1]) and (wvf < upperBand and wvf < rangeHigh) ? 1 : 0
alert3 = upRange and close > close[str] and (close < close[ltLB] or close < close[mtLB]) and filtered ? 1 : 0
alert4 = upRange_Aggr and close > close[str] and (close < close[ltLB] or close < close[mtLB]) and filtered_Aggr ? 1 : 0


//Coloring Criteria of Williams Vix Fix
col = wvf >= upperBand or wvf >= rangeHigh ? lime : gray

//Plots for Williams Vix Fix Histogram and Alerts

longCond=alert3

shortCond = alert2


monthfrom =input(8)
monthuntil =input(12)
dayfrom=input(1)
dayuntil=input(31)

if (  longCond    and  month>=monthfrom and month <=monthuntil and dayofmonth>=dayfrom and dayofmonth < dayuntil)
    strategy.entry("LONG", strategy.long, stop=close, oca_name="TREND",  comment="LONG")

else
    strategy.cancel(id="LONG")


if ( shortCond   and month>=monthfrom and month <=monthuntil and dayofmonth>=dayfrom and dayofmonth < dayuntil )

    strategy.entry("SHORT", strategy.short,stop=close, oca_name="TREND",  comment="SHORT")
else
    strategy.cancel(id="SHORT")
Published by ChaoZhang on the FMZ strategy square · last modified 2023-10-25. Collected in the Quant Trading Vault. Unvalidated research: re-test with your own data and costs before trusting it.
Build this with AgenKit
A spec is not a trading system. Paste this into your coding agent and AgenKit runs a specialist team — architecture, test-first build, risk gates, review — with paper trading on by default.
/agenkit build a production-grade trading bot with a backtest engine, risk controls and paper trading by default from strategies/Williams-VIX-Fix-Strategy-430129.md- npx agenkit install engineering-kit in your project
- Paste the command into your agent and approve each phase
- Get tests, backtest, risk controls and a paper-trading switch
Understand it first
Before you run this, read the lesson behind the idea and how to backtest it honestly. Specs like this one are the survivors of an unknown number of trials; deflate their results accordingly.
Related specs
- Adaptive Bollinger Breakout with Moving Average Quantitative Strategy SystemPine Script · Breakout · 1h
- BB Breakout StrategyPine Script · Breakout · 1d
- Bollinger Band Breakout Trend Following StrategyPine Script · Breakout · 1d
- Bollinger Band Channel Breakout Trading StrategyPine Script · Breakout · 1d
- Bollinger Band T3 Moving Average StrategyPine Script · Breakout · 10m
- Bollinger Bands Breakout Trading StrategyPine Script · Breakout · 1h