Z Score Price Breakout Strategy
The Z-Score price breakout strategy uses the z-score indicator of price to determine whether the current price is in an abnormal state, so as to generate trading signals. When the z-score of price is higher or lower…
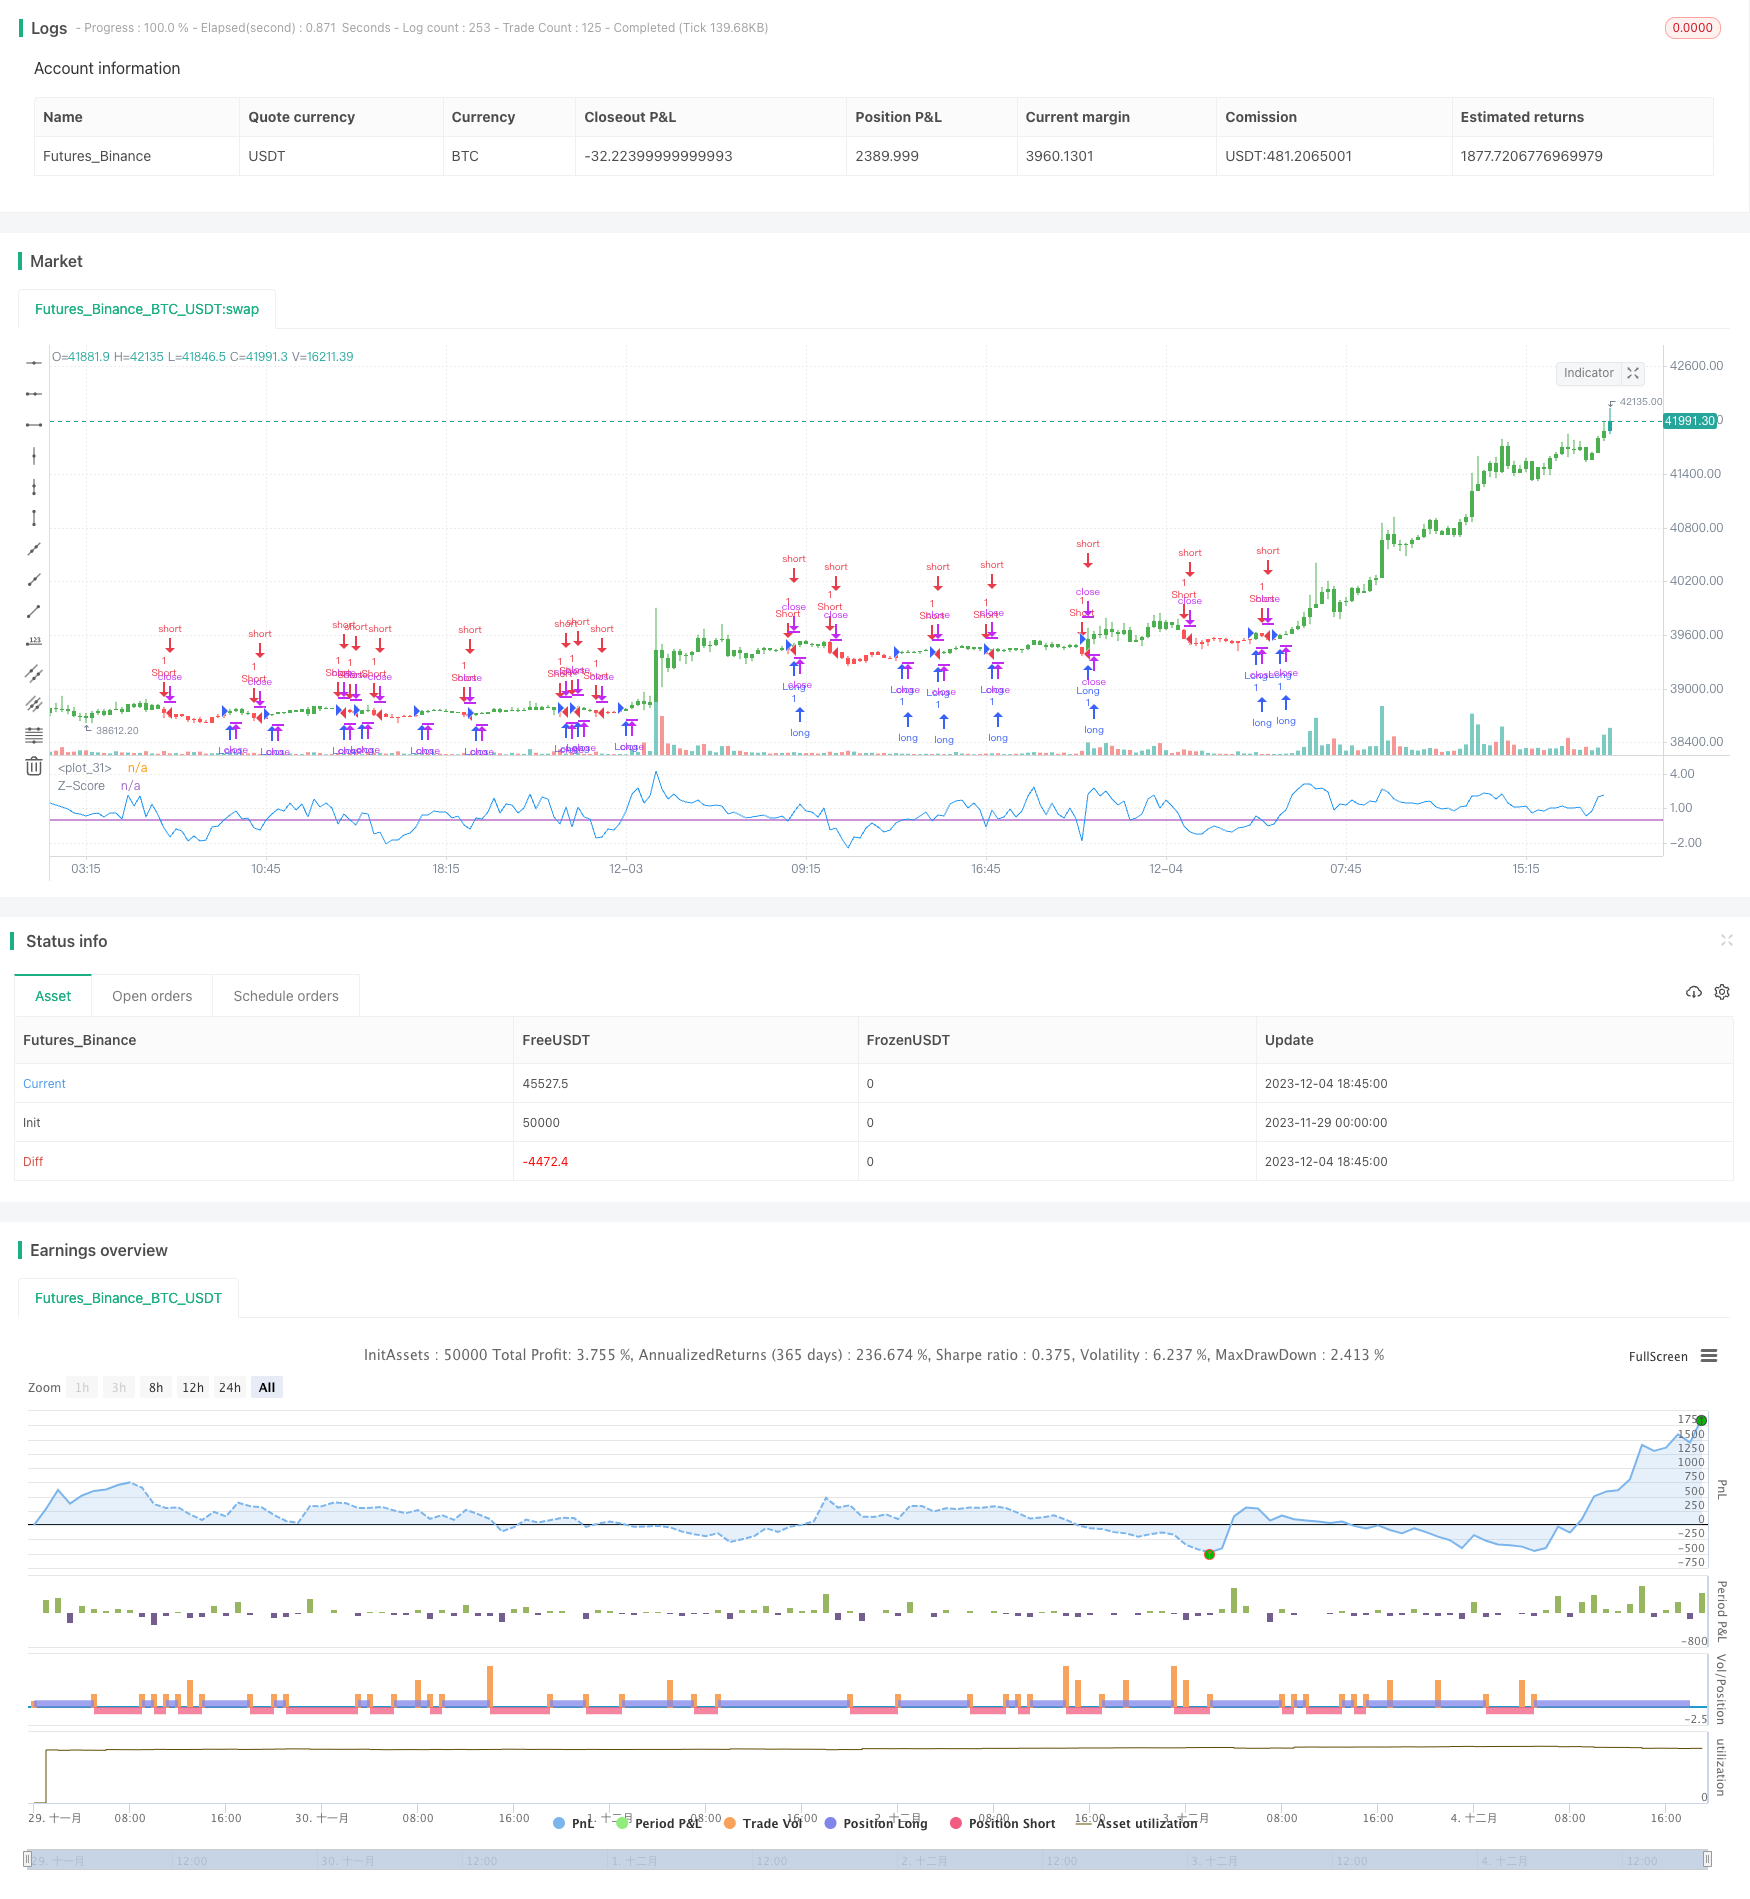
Overview
The Z-Score price breakout strategy uses the z-score indicator of price to determine whether the current price is in an abnormal state, so as to generate trading signals. When the z-score of price is higher or lower than a threshold, it means the price has entered an abnormal state, at which point long or short positions can be taken.
Strategy Principle
The core indicator of this strategy is the z-score of price, calculated as follows:
Z_score = (C - SMA(n)) / StdDev(C,n)
Where C is the closing price, SMA(n) is the simple moving average of n periods, and StdDev(C,n) is the standard deviation of closing price for n periods.
The z-score reflects the degree of deviation of the current price from the average price. When the price z-score is greater than a certain positive threshold (e.g. +2), it means the current price is above the average price by 2 standard deviations, which is a relatively high level. When it is less than a certain negative threshold (e.g. -2), it means the current price is below the average price by 2 standard deviations, which is a relatively low level.
This strategy first calculates the z-score of price, then sets a positive and negative threshold (e.g. 0 and 0). When the z-score is higher than the positive threshold, it generates a buy signal. When lower than the negative threshold, it generates a sell signal.
Advantage Analysis
- Using price z-score to judge price anomalies is a common and effective quantitative method
- Easily achieve both long and short trading
- Flexible parameter settings, adjustable cycle, threshold, etc.
- Can be combined with other indicators to form a trading system
Risk Analysis
- The z-score strategy is crude and prone to false signals
- Need to set appropriate parameters like cycle and threshold
- Need to consider stop loss strategies to control risk
Optimization Directions
- Optimize cycle parameters to find the best cycle
- Optimize positive and negative thresholds to reduce false signals
- Add filter conditions, combine with other indicators
- Add stop loss strategies
Summary
The z-score price breakout strategy judges whether the current price is in an abnormal state, and trades according to the positive and negative of the price z-score. This strategy is simple and easy to implement, allows two-way trading, but also has some risks. By optimizing parameters, adding stop loss and combining with other indicators, this strategy can be enhanced to form a complete quantitative trading system.
Parameters
| Name | Default | What it controls |
|---|---|---|
| v_input_1 | 20 | Period |
| v_input_2 | false | Trigger |
| v_input_3 | false | Trade reverse |
Source Pine Script
/*backtest
start: 2023-11-29 00:00:00
end: 2023-12-04 19:00:00
period: 15m
basePeriod: 5m
exchanges: [{"eid":"Futures_Binance","currency":"BTC_USDT"}]
*/

//@version=2
////////////////////////////////////////////////////////////
//  Copyright by HPotter v1.0 18/01/2017
// The author of this indicator is Veronique Valcu. The z-score (z) for a data
// item x measures the distance (in standard deviations StdDev) and direction
// of the item from its mean (U):
//     z = (x-StdDev) / U
// A value of zero indicates that the data item x is equal to the mean U, while
// positive or negative values show that the data item is above (x>U) or below
// (x Values of +2 and -2 show that the data item is two standard deviations
// above or below the chosen mean, respectively, and over 95.5% of all data
// items are contained within these two horizontal references (see Figure 1).
// We substitute x with the closing price C, the mean U with simple moving
// average (SMA) of n periods (n), and StdDev with the standard deviation of
// closing prices for n periods, the above formula becomes:
//     Z_score = (C - SMA(n)) / StdDev(C,n)
// The z-score indicator is not new, but its use can be seen as a supplement to
// Bollinger bands. It offers a simple way to assess the position of the price
// vis-a-vis its resistance and support levels expressed by the Bollinger Bands.
// In addition, crossings of z-score averages may signal the start or the end of
// a tradable trend. Traders may take a step further and look for stronger signals
// by identifying common crossing points of z-score, its average, and average of average.
//
// You can change long to short in the Input Settings
// Please, use it only for learning or paper trading. Do not for real trading.
////////////////////////////////////////////////////////////
strategy(title="Z-Score Strategy", shorttitle="Z-Score Strategy")
Period = input(20, minval=1)
Trigger = input(0)
reverse = input(false, title="Trade reverse")
hline(Trigger, color=purple, linestyle=line)
xStdDev = stdev(close, Period)
xMA = sma(close, Period)
nRes = (close - xMA) / xStdDev
pos = iff(nRes > Trigger, 1,
	   iff(nRes < Trigger, -1, nz(pos[1], 0)))
possig = iff(reverse and pos == 1, -1,
          iff(reverse and pos == -1, 1, pos))
if (possig == 1)
    strategy.entry("Long", strategy.long)
if (possig == -1)
    strategy.entry("Short", strategy.short)
barcolor(possig == -1 ? red: possig == 1 ? green : blue )
plot(nRes, color=blue, title="Z-Score")
Published by ChaoZhang on the FMZ strategy square · last modified 2023-12-07. Collected in the Quant Trading Vault. Unvalidated research: re-test with your own data and costs before trusting it.
Build this with AgenKit
A spec is not a trading system. Paste this into your coding agent and AgenKit runs a specialist team — architecture, test-first build, risk gates, review — with paper trading on by default.
/agenkit build a production-grade trading bot with a backtest engine, risk controls and paper trading by default from strategies/Z-Score-Price-Breakout-Strategy.md- npx agenkit install engineering-kit in your project
- Paste the command into your agent and approve each phase
- Get tests, backtest, risk controls and a paper-trading switch
Understand it first
Before you run this, read the lesson behind the idea and how to backtest it honestly. Specs like this one are the survivors of an unknown number of trials; deflate their results accordingly.
Related specs
- Adaptive Bollinger Breakout with Moving Average Quantitative Strategy SystemPine Script · Breakout · 1h
- BB Breakout StrategyPine Script · Breakout · 1d
- Bollinger Band Breakout Trend Following StrategyPine Script · Breakout · 1d
- Bollinger Band Channel Breakout Trading StrategyPine Script · Breakout · 1d
- Bollinger Band T3 Moving Average StrategyPine Script · Breakout · 10m
- Bollinger Bands Breakout Trading StrategyPine Script · Breakout · 1h