Zigzag Breakout Strategy
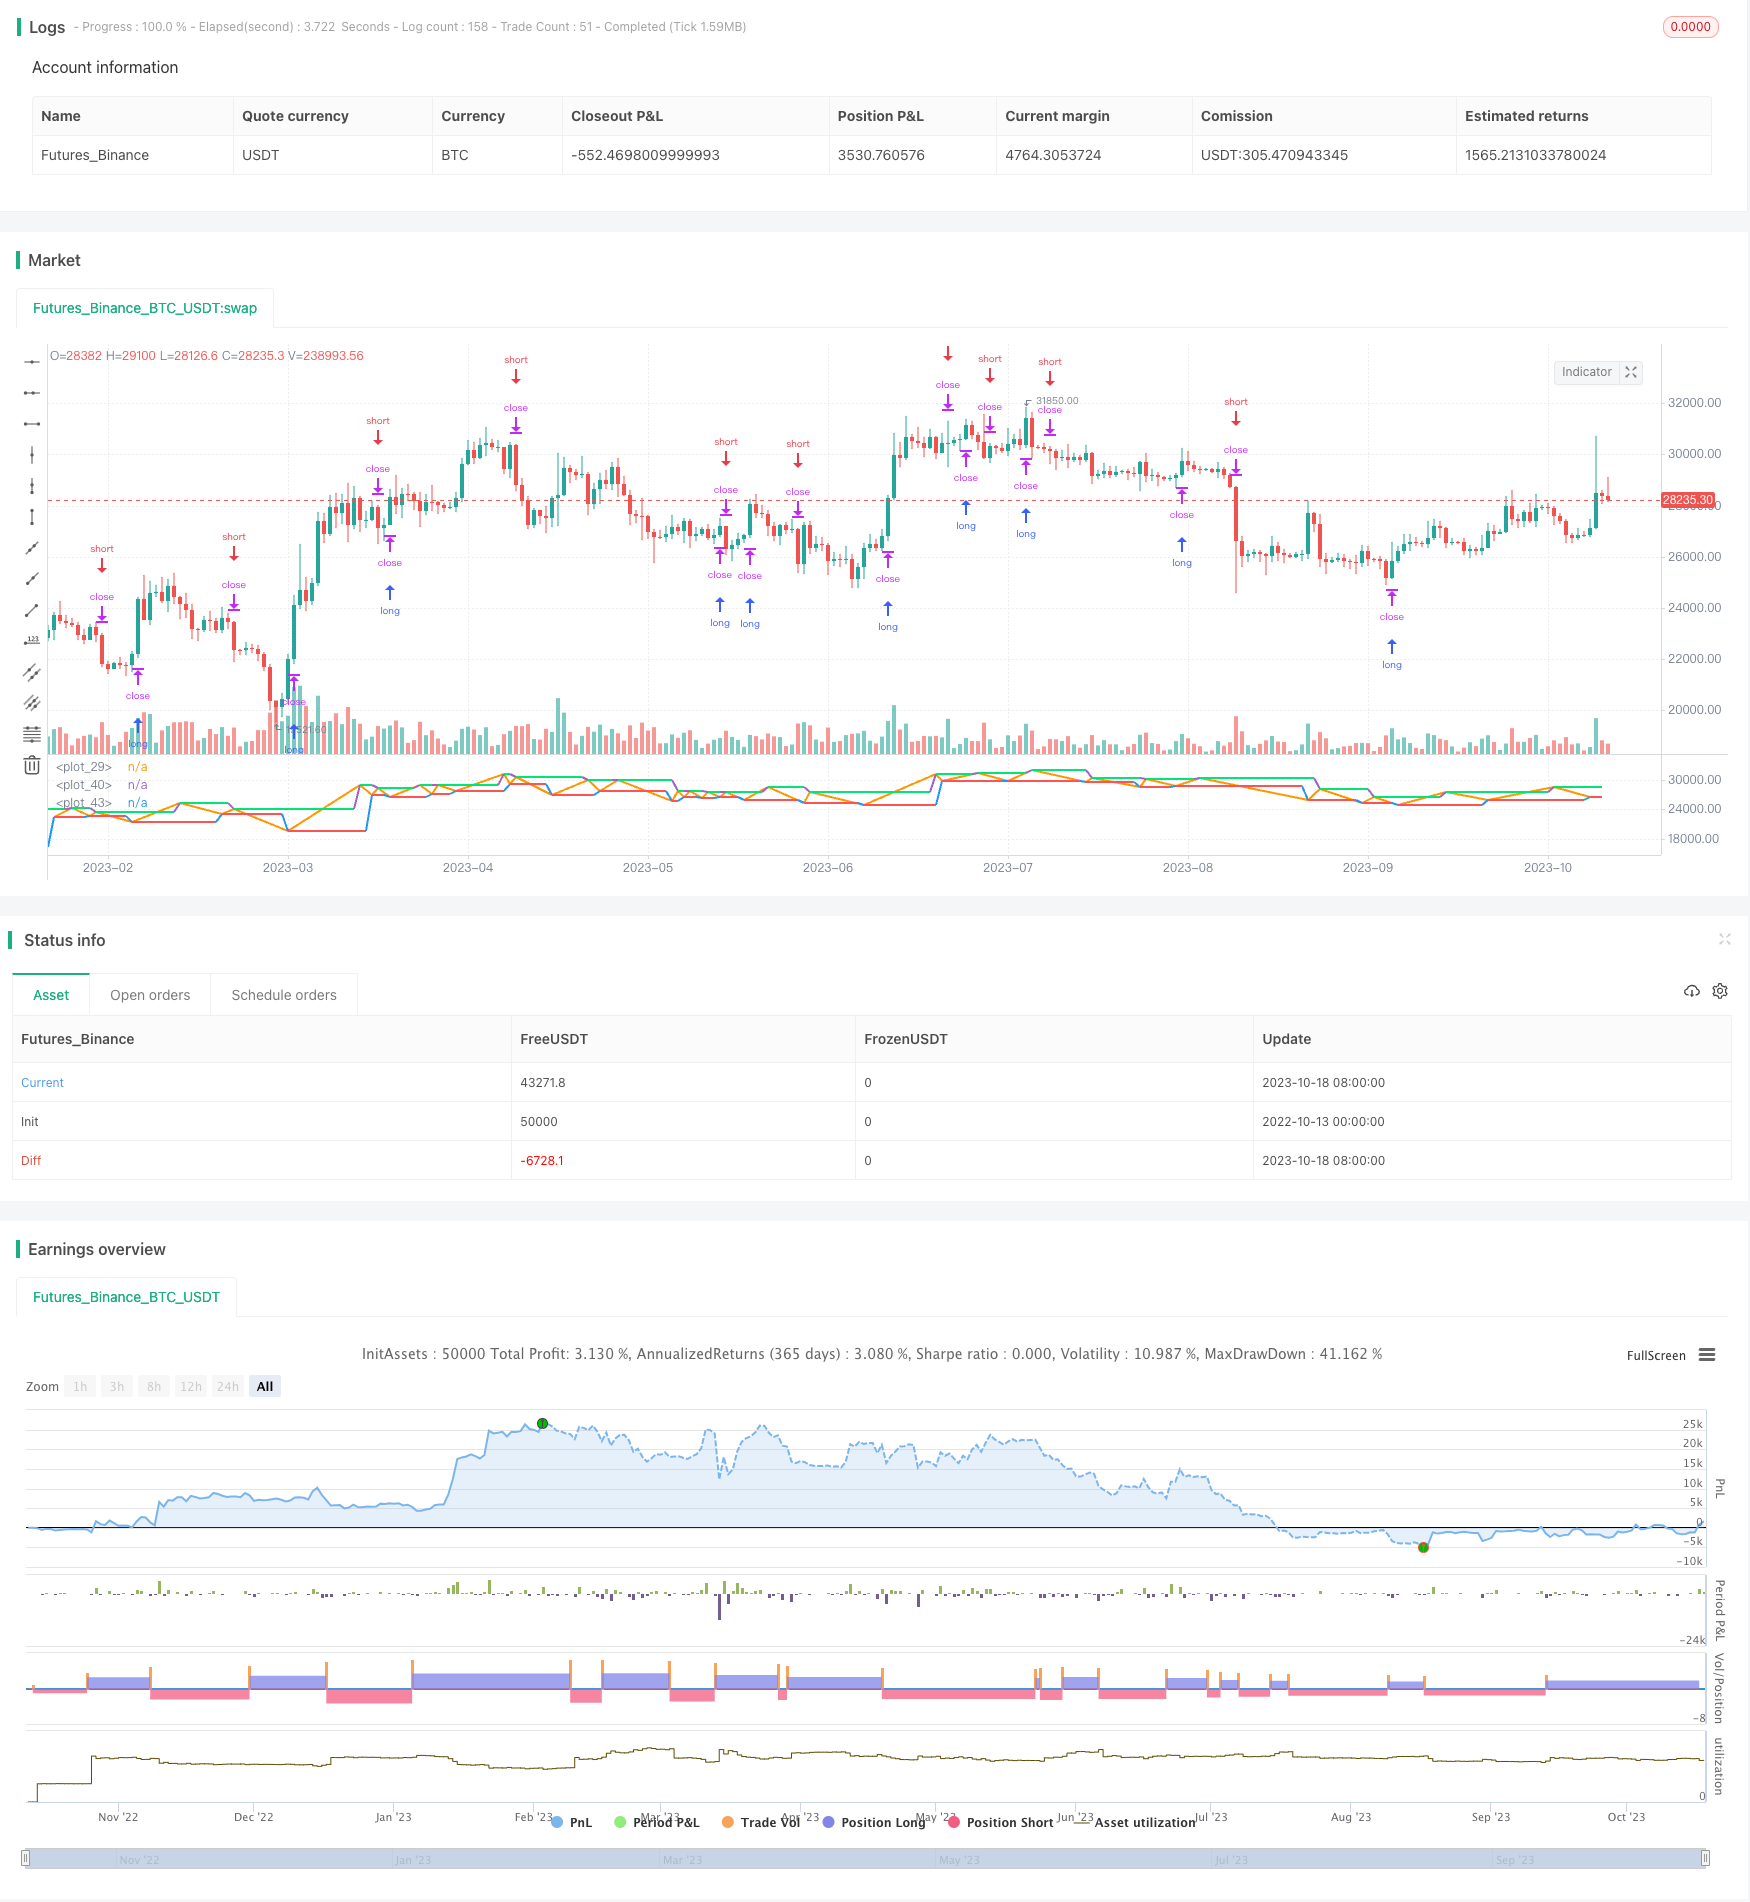
This strategy uses the Zigzag indicator to draw support and resistance lines and takes long or short positions when the price breaks through the support or resistance lines.
Overview
This strategy uses the Zigzag indicator to draw support and resistance lines and takes long or short positions when the price breaks through the support or resistance lines.
Strategy Logic
The strategy first uses the Zigzag indicator to draw Zigzag lines under certain parameters. Green support lines are drawn when the Zigzag indicator bottoms out. Red resistance lines are drawn when the Zigzag tops out. Long positions are taken when the price breaks above the green line. Short positions are taken when the price breaks below the red line.
Specifically, the core logic is:
Use ema to smooth the close price with triple exponential moving averages, obtaining the smoothed curve _hls.
Judge if the smoothed curve is rising. If rising and the previous bar was not rising, it is considered a bottom. Take the lowest price of this bar. If falling and the previous bar was rising, it is considered a top. Take the highest price of this bar. Otherwise NaN.
Repeat this process to obtain the Zigzag line zigzag.
When zigzag rises, record the current peak dot. When falling, record the current trough dot.
Draw the green support line uplevel when dot rises. Draw the red resistance line dnlevel when dot falls.
Take long position when price breaks above green line. Take short position when price breaks below red line.
Advantage Analysis
The advantages of this strategy include:
Identify key support/resistance levels using Zigzag indicator. These levels are often significant.
Zigzag filters out some market noise, generating clearer trading signals.
Enter positions by breakout, which can timely capture trend reversals.
Simple and effective way to draw support/resistance lines.
Clear logic and large parameter optimization space.
Flexibility in choosing products and timeframes. Strong adaptability.
Risk Analysis
Risks of this strategy:
Improper Zigzag parameters may miss trading opportunities.
Prices may retest support/resistance after breakout. Use stop loss to control risks.
Breakout signals may be misleading. Need validation with trends and patterns.
Prolonged sideways may generate excessive ineffective trades.
Consider transaction costs. Avoid overly frequent trading.
Solutions:
Optimize Zigzag parameters to find best combination.
Set timely stop loss after breakout to limit losses.
Add filters like trend indicators to improve accuracy.
Identify sideways and avoid trading during these periods.
Relax breakout range to reduce ineffective trades.
Optimization Directions
The strategy can be optimized in the following aspects:
Optimize Zigzag parameters by backtesting to find optimum.
Consider the possibility of retesting support/resistance after breakout. Add exit logic for retest scenarios.
Add filters like MA to screen out low probability signals.
Incorporate volume indicators to confirm breakout signals.
Implement Lachenbruch's dual methodology (long and short) to filter incorrect signals and profit.
Use machine learning to dynamically optimize parameters.
Introduce stop loss strategy to limit risks.
Conclusion
In summary, this is a simple and practical oscillation breakout strategy. It draws support/resistance using Zigzag and trades breakouts. The strategy is adaptive but with some risks. Optimization on parameters, signal filters and risk control can improve it. Such breakout strategies suit active traders who can grasp market rhythm.
Parameters
| Name | Default | What it controls |
|---|---|---|
| v_input_1 | true | Long |
| v_input_2 | true | Short |
| v_input_3 | 100 | Capital, % |
| v_input_4 | 4 | ZigZag length |
| v_input_5 | 4 | ZigZag extreme |
| v_input_6_close | 0 | Source: close | high | low | open | hl2 | hlc3 | hlcc4 | ohlc4 |
| v_input_7 | false | Show ZigZag |
| v_input_8 | 1900 | From Year |
| v_input_9 | 2100 | To Year |
| v_input_10 | true | From Month |
| v_input_11 | 12 | To Month |
| v_input_12 | true | From day |
| v_input_13 | 31 | To day |
Source Pine Script
/*backtest
start: 2022-10-13 00:00:00
end: 2023-10-19 00:00:00
period: 1d
basePeriod: 1h
exchanges: [{"eid":"Futures_Binance","currency":"BTC_USDT"}]
*/

//Noro
//2018

//@version=3
// strategy(title = "Noro's ZZ-2 Strategy", shorttitle = "Noro's ZZ-2 Strategy", overlay = true, default_qty_type = strategy.percent_of_equity, default_qty_value = 100, pyramiding = 0)

//Settings
needlong = input(true, defval = true, title = "Long")
needshort = input(true, defval = true, title = "Short")
capital = input(100, defval = 100, minval = 1, maxval = 10000, title = "Capital, %")
length = input(4, title = "ZigZag length")
Extreme = input(4, title = "ZigZag extreme")
src = input(close, title = "Source")
showzz = input(false, defval = false, title = "Show ZigZag")
fromyear = input(1900, defval = 1900, minval = 1900, maxval = 2100, title = "From Year")
toyear = input(2100, defval = 2100, minval = 1900, maxval = 2100, title = "To Year")
frommonth = input(01, defval = 01, minval = 01, maxval = 12, title = "From Month")
tomonth = input(12, defval = 12, minval = 01, maxval = 12, title = "To Month")
fromday = input(01, defval = 01, minval = 01, maxval = 31, title = "From day")
today = input(31, defval = 31, minval = 01, maxval = 31, title = "To day")

//ZigZag
f_zz(_length, _detection)=>
    _hls = ema(ema(ema(src, _length), round(_length*0.66)), round(_length*0.33))
    _isRising = _hls >= _hls[1]
    _zigzag = _isRising and not _isRising[1] ? lowest(_detection) :  not _isRising and _isRising[1] ? highest(_detection) : na
zigzag = f_zz(length, Extreme)
zzcol = showzz ? black : na
plot(zigzag, color = zzcol, linewidth = 2)

//Levels
dot = 0.0
dot := zigzag > 0 ? zigzag : dot[1]
uplevel = 0.0
uplevel := dot > dot[1] ? zigzag : uplevel[1]
dnlevel = 0.0
dnlevel := dot < dot[1] ? zigzag : dnlevel[1]
upcol = na
upcol := dot > dot[1] ? na : lime
plot(uplevel, color = upcol, linewidth = 2)
dncol = na
dncol := dot < dot[1] ? na : red
plot(dnlevel, color = dncol, linewidth = 2)

//Trading
lot = 0.0
lot := strategy.position_size != strategy.position_size[1] ? strategy.equity / close * capital / 100 : lot[1]
if dot > 0
    strategy.entry("Long", strategy.long, needlong == false ? 0 : lot, stop = uplevel)
    strategy.entry("Short", strategy.short, needshort == false ? 0 : lot, stop = dnlevel)
Published by ChaoZhang on the FMZ strategy square · last modified 2023-10-20. Collected in the Quant Trading Vault. Unvalidated research: re-test with your own data and costs before trusting it.
Build this with AgenKit
A spec is not a trading system. Paste this into your coding agent and AgenKit runs a specialist team — architecture, test-first build, risk gates, review — with paper trading on by default.
/agenkit build a production-grade trading bot with a backtest engine, risk controls and paper trading by default from strategies/Zigzag-Breakout-Strategy.md- npx agenkit install engineering-kit in your project
- Paste the command into your agent and approve each phase
- Get tests, backtest, risk controls and a paper-trading switch
Understand it first
Before you run this, read the lesson behind the idea and how to backtest it honestly. Specs like this one are the survivors of an unknown number of trials; deflate their results accordingly.
Related specs
- Exponential Moving Average Candle Stop Trading StrategyPine Script · Breakout · 1d
- Kana Candle Breakout Strategy Based on Moving Average and Support ResistancePine Script · Breakout · 1h
- Momentum Breakout Moving Average StrategyPine Script · Breakout · 1d
- Momentum Breakout Trading Strategy 435896Pine Script · Breakout · 1d
- Moving Average Crossover and Upper Rail Breakthrough Impulse StrategyPine Script · Breakout · 1m
- Multi Indicator Short Term Algorithmic Trading StrategyPine Script · Breakout · 4h