Adaptive Exponential Moving Average Range Strategy
This strategy uses the faster Exponential Hull Moving Average (EHMA) and an adaptive channel to build a trend following strategy. Since EHMA calculates faster, it can effectively identify price trend changes and…
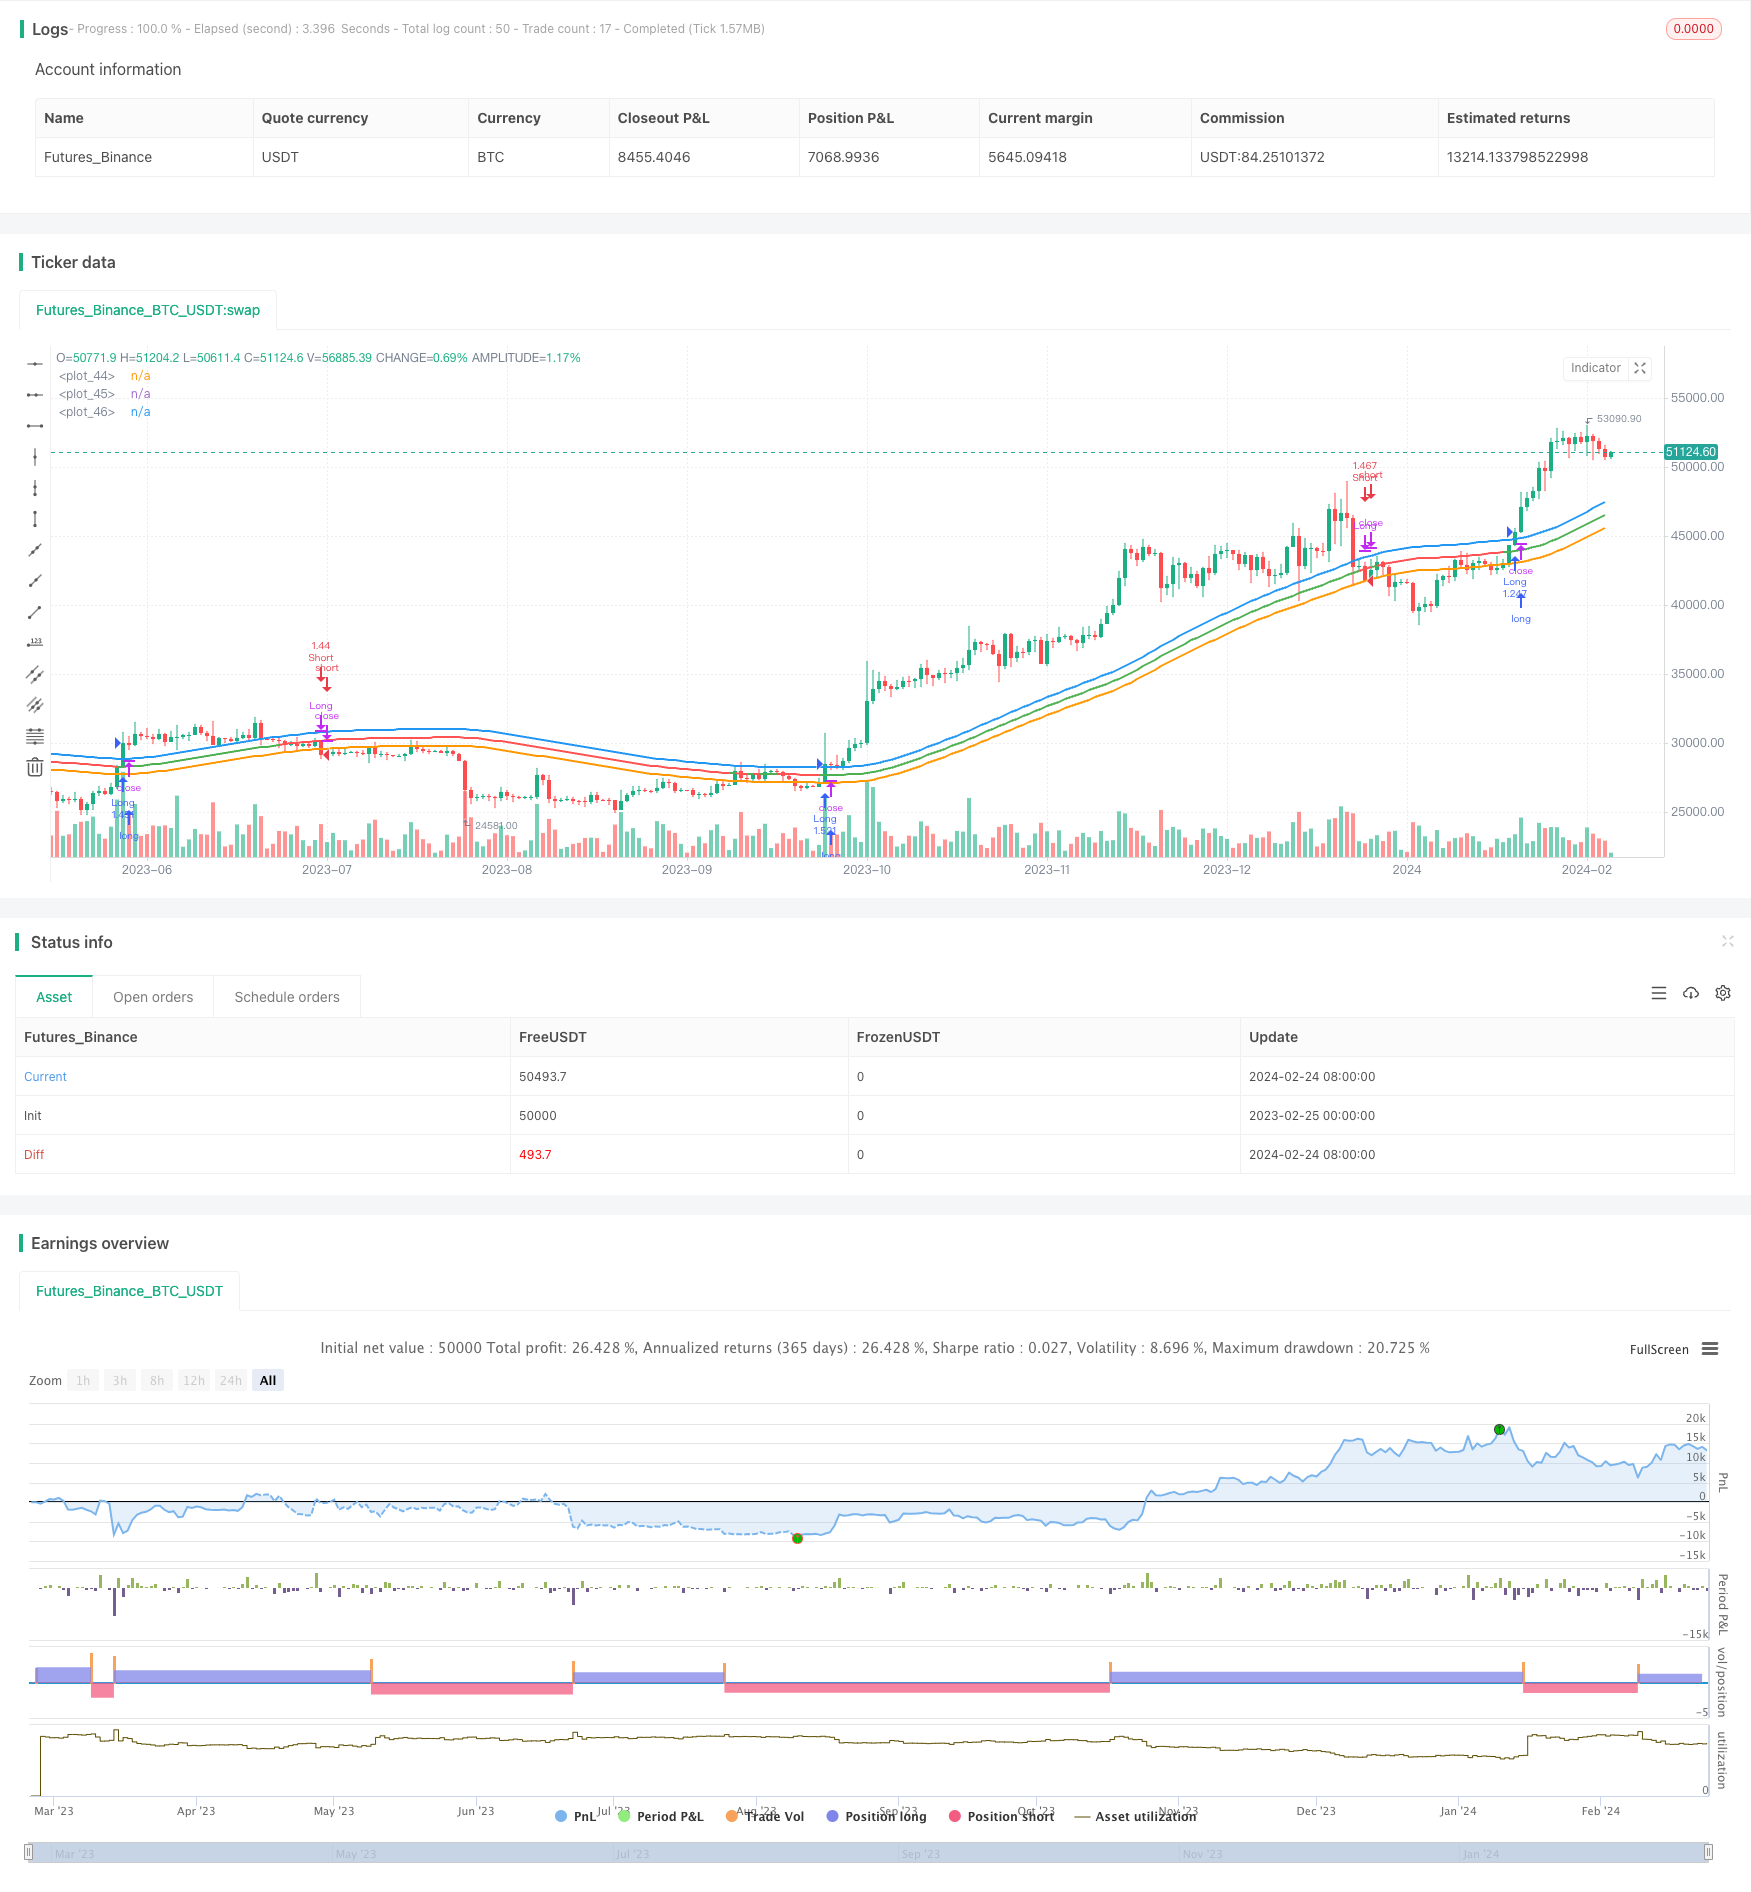
Overview
This strategy uses the faster Exponential Hull Moving Average (EHMA) and an adaptive channel to build a trend following strategy. Since EHMA calculates faster, it can effectively identify price trend changes and avoid unnecessary trades caused by false breakouts. At the same time, the adaptive channel can filter out some price fluctuations. Trades are only triggered when the price breaks through the channel, reducing the probability of ineffective trades and increasing profitability.
Strategy Principle
Calculate the exponential weighted moving average EHMA based on the Period parameter. EHMA calculates faster and can track price trend changes effectively.
Build an adaptive channel above and below the EHMA based on the RangeWidth parameter. Only when the price rises above the upper channel line or falls below the lower channel line, the trend is considered to have changed and trading signals are triggered.
Determine the price relationship with the channel. Long when price breaks through the upper line, short when breaks through the lower line. Close long position when price crosses below upper line, close short position when price crosses above lower line.
Advantage Analysis
Compared with ordinary moving average strategies, this strategy has the following advantages:
Use the EHMA algorithm to calculate the moving average. EHMA responds more sensitively to price changes and can identify trend changes effectively to avoid unnecessary trades caused by false breakouts.
The adaptive channel can filter out price fluctuations effectively. Trading signals are only triggered when the price trend has changed firmly. This could filter out some ineffective trades and improve profitability.
The channel width can be adjusted flexibly to adapt to different market conditions. Wider channels can filter more fluctuations and reduce trading frequency. Narrower channels can identify trend changes earlier and increase trading frequency.
Risk Analysis
There are also some risks with this strategy:
False breakouts are still not completely avoidable. Prices may gap beyond the channel. Parameters need to adjusted properly to control risks.
Some trading opportunities may be missed if the channel is too wide. Narrow down the channel reasonably to increase sensitivity.
Too narrow channels can increase ineffective trades. Expand channel width appropriately to enhance stability.
Optimization Directions
This strategy can be optimized in the following aspects:
Optimize the Period parameter. Adjust the moving average calculation cycle to adapt to different products and timeframes.
Optimize the RangeWidth parameter. Adjust the channel scope based on market volatility and personal risk preference.
Add stop loss strategy. Set reasonable stop loss points during holding positions to effectively control maximum loss per trade.
Combine with other indicators for entries filtering. For example, add volume to reduce false entries.
Diversify strategy applications and optimize parameters. Test and optimize universal parameters across more products and timeframes.
Summary
This strategy combines the EHMA indicator and adaptive channel indicator to form a trend following strategy. It can identify market trends effectively and filter out price fluctuations to avoid unnecessary trades. After a series of parameter optimization and risk control, stable profits can be achieved across various products and timeframes.
Parameters
| Name | Default | What it controls |
|---|---|---|
| v_input_1 | 0 | Position Type: Long | Both | Short |
| v_input_2 | 180 | Length |
| v_input_3 | 0.02 | Range Width |
| v_input_4 | timestamp(2017-01-01T00:00:00) | startDate |
| v_input_5 | timestamp(2029-01-01T00:00:00) | finishDate |
Source Pine Script
/*backtest
start: 2023-02-25 00:00:00
end: 2024-02-25 00:00:00
period: 1d
basePeriod: 1h
exchanges: [{"eid":"Futures_Binance","currency":"BTC_USDT"}]
args: [["v_input_1",1]]
*/

// Credit is due where credit is due:
// Hull Moving Average: developed by Alan Hull
// EHMA: coded by Twitter @borserman
// I've built on their work in an attempt to create a strategy more robust to fake moves
// @0xLetoII

//@version=4
strategy(
  title="EHMA Range Strategy",
  process_orders_on_close=true,
  explicit_plot_zorder=true,
  overlay=true,
  initial_capital=1500,
  default_qty_type=strategy.percent_of_equity,
  commission_type=strategy.commission.percent,
  commission_value=0.085,
  default_qty_value=100
  )


// Position Type
pos_type = input(defval = "Long", title="Position Type", options=["Both", "Long", "Short"])

// Inputs
Period = input(defval=180, title="Length")
RangeWidth = input(defval=0.02, step=0.01, title="Range Width")
sqrtPeriod = sqrt(Period)

// Function for the Borserman EMA
borserman_ema(x, y) =>
    alpha = 2 / (y + 1)
    sum = 0.0
    sum := alpha * x + (1 - alpha) * nz(sum[1])

// Calculate the Exponential Hull Moving Average
EHMA = borserman_ema(2 * borserman_ema(close, Period / 2) - borserman_ema(close, Period), sqrtPeriod)

// Create upper & lower bounds around the EHMA for broader entries & exits
upper = EHMA + (EHMA * RangeWidth)
lower = EHMA - (EHMA * RangeWidth)

// Plots
EHMAcolor = (close > EHMA ? color.green : color.red)
plot(EHMA, color=EHMAcolor, linewidth=2)
plot(lower, color=color.orange, linewidth=2)
plot(upper, color=color.blue, linewidth=2)


// Strategy
long = close > upper
exit_long = close < lower
short = close < lower
exit_short = close > upper


// Calculate start/end date and time condition
startDate  = input(timestamp("2017-01-01T00:00:00"))
finishDate = input(timestamp("2029-01-01T00:00:00"))

time_cond  = true


// Entries & Exits
if pos_type == "Both"
    strategy.entry("Long", strategy.long, comment="Long", when=long and time_cond)
    strategy.close("Long", comment="Exit Long", when=exit_long and time_cond)
    strategy.entry("Short", strategy.short, comment="Short", when=short and time_cond)
    strategy.close("Short", comment="Exit Short", when=exit_short and time_cond)
if pos_type == "Long"
    strategy.entry("Long", strategy.long, comment="Long", when=long and time_cond)
    strategy.close("Long", comment="Exit Long", when=exit_long and time_cond)
if pos_type == "Short"
    strategy.entry("Short", strategy.short, comment="Short", when=short and time_cond)
    strategy.close("Short", comment="Exit Short", when=exit_short and time_cond)
Published by ChaoZhang on the FMZ strategy square · last modified 2024-02-26. Collected in the Quant Trading Vault. Unvalidated research: re-test with your own data and costs before trusting it.
Build this with AgenKit
A spec is not a trading system. Paste this into your coding agent and AgenKit runs a specialist team — architecture, test-first build, risk gates, review — with paper trading on by default.
/agenkit build a production-grade trading bot with a backtest engine, risk controls and paper trading by default from strategies/Adaptive-Exponential-Moving-Average-Range-Strategy.md- npx agenkit install engineering-kit in your project
- Paste the command into your agent and approve each phase
- Get tests, backtest, risk controls and a paper-trading switch
Understand it first
Before you run this, read the lesson behind the idea and how to backtest it honestly. Specs like this one are the survivors of an unknown number of trials; deflate their results accordingly.
Related specs
- Adaptive Multi Period Trading Strategy Based on Wave Trend Momentum BreakoutPine Script · Breakout · 2h
- BB Breakout StrategyPine Script · Breakout · 1d
- BMSB Breakout Strategy BMSBPine Script · Breakout · 1h
- Bollinger Band T3 Moving Average StrategyPine Script · Breakout · 10m
- Bollinger Bands Dual track Breakthrough StrategyPine Script · Breakout · 30m
- Bollinger Breakout StrategyPine Script · Breakout · 30m