Advanced Bollinger Bands Multi Indicator Dynamic Trend Breakout Trading Strategy
This strategy is an advanced trend-following system based on Bollinger Bands breakouts, incorporating multiple technical indicators such as RSI and ADX as filtering conditions, along with ATR-based dynamic stop-loss…
Overview
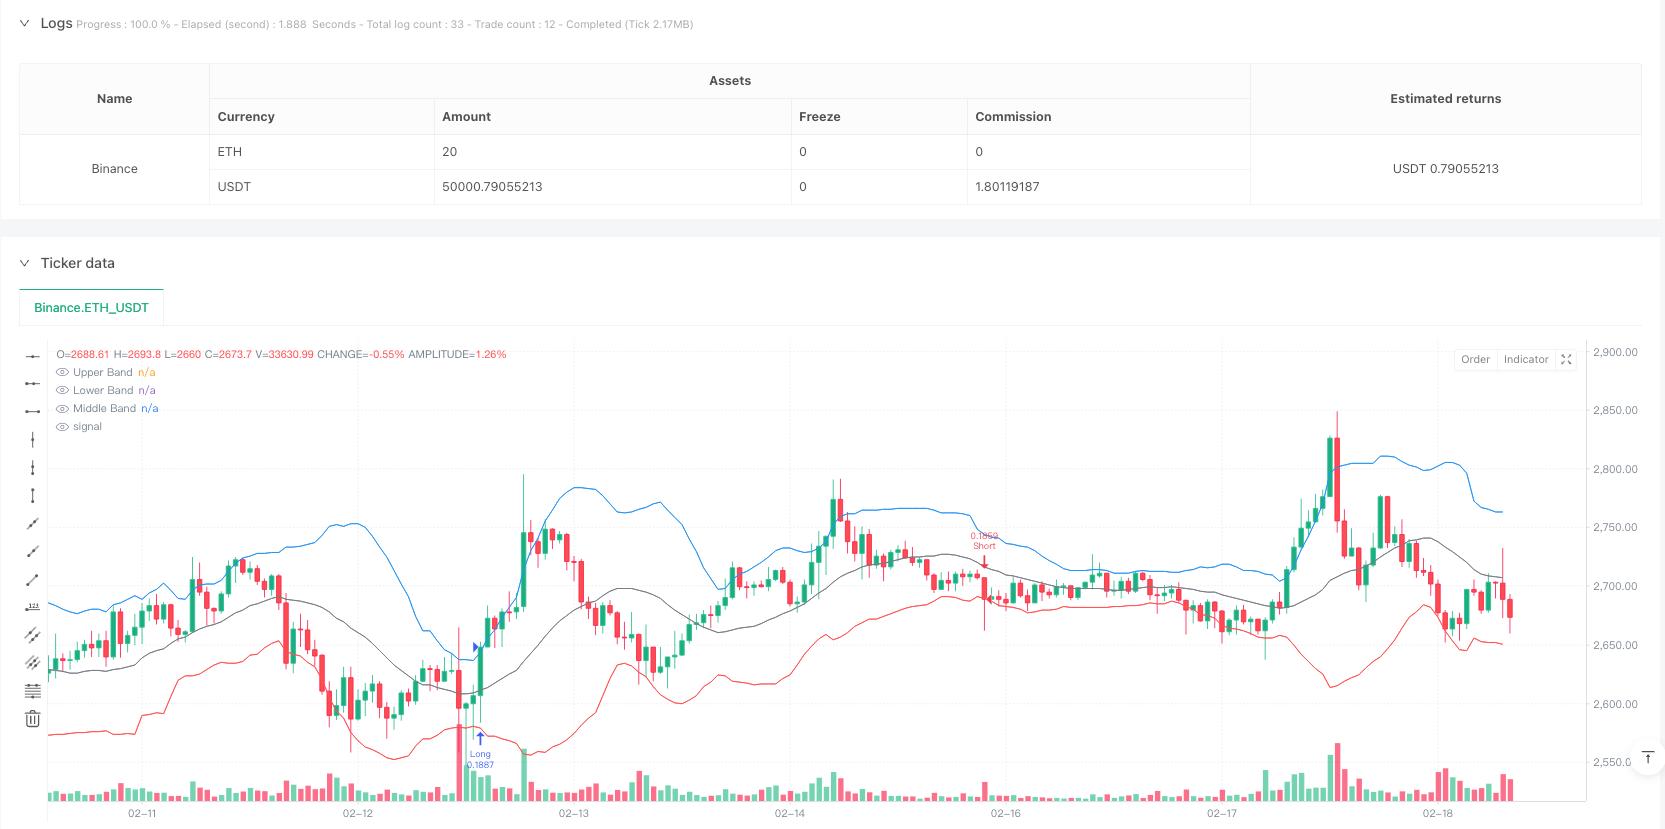
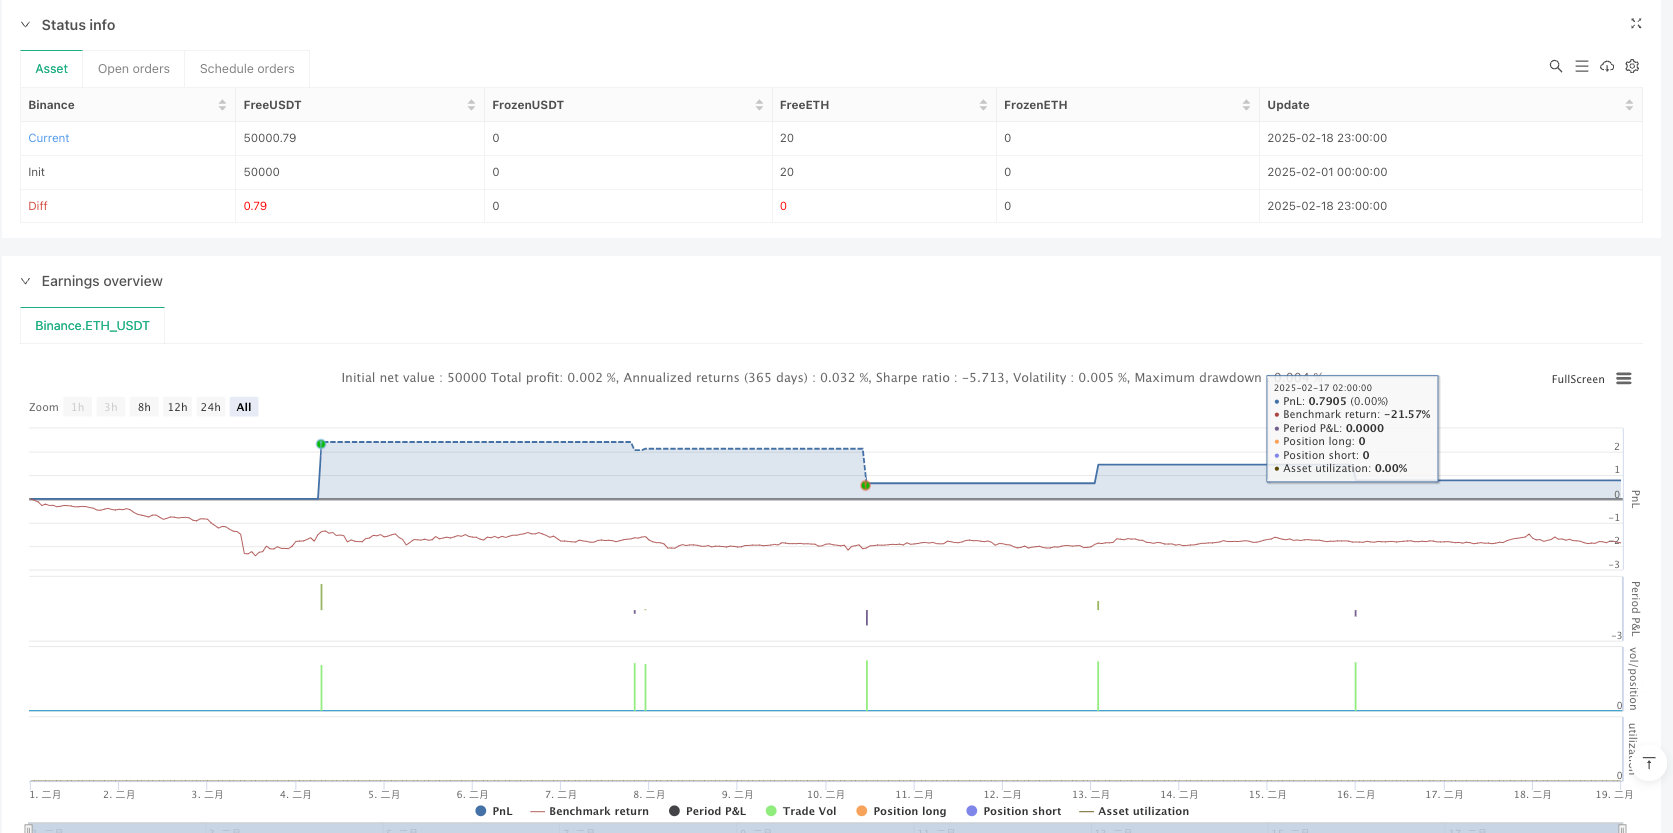
This strategy is an advanced trend-following system based on Bollinger Bands breakouts, incorporating multiple technical indicators such as RSI and ADX as filtering conditions, along with ATR-based dynamic stop-loss and trailing profit mechanisms. The strategy employs strict risk management methods and uses multiple indicators in combination to improve trading accuracy and stability.
Strategy Principles
The core logic of the strategy is based on the following key elements:
- Uses 20-period Bollinger Bands as the primary trend identification indicator with 2 standard deviations
- Filters false breakouts through RSI(14) neutral zone (40-60)
- Confirms trend strength using manually calculated ADX(14)>25
- Entry signals:
- Long: price breaks above upper band and meets RSI and ADX filtering conditions
- Short: price breaks below lower band and meets RSI and ADX filtering conditions
- Risk management:
- Initial stop-loss set at 1.5 times ATR
- Trailing stop at 1 times ATR
- Trail offset at 0.5 times ATR
Strategy Advantages
- Multiple technical indicators combination improves trading signal reliability
- Dynamic stop-loss and trailing profit mechanisms effectively protect profits
- RSI neutral zone filtering prevents overbought and oversold entries
- ADX filtering ensures trading only in strong trends
- Manually calculated ADX provides more precise trend strength measurement
- ATR-based dynamic position management adapts to different market volatility environments
Strategy Risks
- Multiple filtering conditions may cause missing some potential opportunities
- May generate frequent false breakout signals in ranging markets
- ATR stops might be triggered prematurely during sudden volatility expansion
- Requires significant price movement to generate valid trading signals
- May experience larger drawdowns at trend reversal points
Strategy Optimization Directions
- Introduce adaptive Bollinger Bands period and multiplier
- Dynamically adjust RSI filter zones based on market volatility
- Add volume indicators as additional confirmation
- Develop more intelligent trailing stop algorithms
- Add time filters to avoid trading during major news releases
- Implement volatility-based dynamic position sizing
Summary
This is a well-structured trend-following strategy that enhances trading stability through the synergy of multiple technical indicators. The strategy's risk management system is comprehensive and effectively controls downside risk. While there is room for optimization, the overall design philosophy aligns with modern quantitative trading requirements. The strategy is suitable for markets with higher volatility and is a good choice for traders seeking stable returns.
Source Pine Script
/*backtest
start: 2025-02-01 00:00:00
end: 2025-02-19 00:00:00
period: 1h
basePeriod: 1m
exchanges: [{"eid":"Binance","currency":"ETH_USDT"}]
*/

//@version=5
strategy("Optimized Bollinger Bands Breakout Strategy", overlay=true, default_qty_type=strategy.percent_of_equity, default_qty_value=1)

// ? Bollinger Bands Settings
length = input(20, title="Bollinger Length")
mult = input(2.0, title="Bollinger Multiplier")
basis = ta.sma(close, length)
dev = mult * ta.stdev(close, length)
upperBand = basis + dev
lowerBand = basis - dev

// ? ADX Calculation (Manually Calculated)
adxLength = input(14, title="ADX Length")
dmiLength = input(14, title="DMI Length")
upMove = high - ta.highest(high[1], 1)
downMove = ta.lowest(low[1], 1) - low
plusDM = upMove > downMove and upMove > 0 ? upMove : 0
minusDM = downMove > upMove and downMove > 0 ? downMove : 0
plusDI = ta.sma(plusDM, dmiLength) / ta.atr(dmiLength) * 100
minusDI = ta.sma(minusDM, dmiLength) / ta.atr(dmiLength) * 100
dx = math.abs(plusDI - minusDI) / (plusDI + minusDI) * 100
adx = ta.sma(dx, adxLength)

// ? Additional Filters
rsi = ta.rsi(close, 14)

// ✅ Entry Conditions
longCondition = ta.crossover(close, upperBand) and rsi > 40 and rsi < 60 and adx > 25
shortCondition = ta.crossunder(close, lowerBand) and rsi > 40 and rsi < 60 and adx > 25

// ? ATR-based Stop Loss
stopLossMultiplier = input(1.5, title="Stop Loss (ATR Multiplier)")
atrValue = ta.atr(14)
longSL = close - (atrValue * stopLossMultiplier)
shortSL = close + (atrValue * stopLossMultiplier)

// ✅ Trailing Stop
trailMultiplier = input(1, title="Trailing Stop Multiplier")
longTrailStop = close - (atrValue * trailMultiplier)
shortTrailStop = close + (atrValue * trailMultiplier)

// ? Executing Trades
if (longCondition)
    strategy.entry("Long", strategy.long)
    strategy.exit("Exit Long", from_entry="Long", stop=longSL, trail_price=longTrailStop, trail_offset=atrValue * 0.5)

if (shortCondition)
    strategy.entry("Short", strategy.short)
    strategy.exit("Exit Short", from_entry="Short", stop=shortSL, trail_price=shortTrailStop, trail_offset=atrValue * 0.5)

// ? Plot Bollinger Bands
plot(upperBand, title="Upper Band", color=color.blue)
plot(lowerBand, title="Lower Band", color=color.red)
plot(basis, title="Middle Band", color=color.gray)
Published by ianzeng123 on the FMZ strategy square · last modified 2025-02-20. Collected in the Quant Trading Vault. Unvalidated research: re-test with your own data and costs before trusting it.
Build this with AgenKit
A spec is not a trading system. Paste this into your coding agent and AgenKit runs a specialist team — architecture, test-first build, risk gates, review — with paper trading on by default.
/agenkit build a production-grade trading bot with a backtest engine, risk controls and paper trading by default from strategies/Advanced-Bollinger-Bands-Multi-Indicator-Dynamic-Trend-Breakout-Trading-Strategy.md- npx agenkit install engineering-kit in your project
- Paste the command into your agent and approve each phase
- Get tests, backtest, risk controls and a paper-trading switch
Understand it first
Before you run this, read the lesson behind the idea and how to backtest it honestly. Specs like this one are the survivors of an unknown number of trials; deflate their results accordingly.
Related specs
- Momentum Breakout Trading Strategy 440964Pine Script · Breakout · 5m
- Moving Average Crossover and Upper Rail Breakthrough Impulse StrategyPine Script · Breakout · 1m
- Dynamic Range Breakout Trading Strategy Based on Bollinger Bands and RSIPine Script · Breakout · 1d
- Multi Moving Average Supertrend with Bollinger Breakout Trading StrategyPine Script · Breakout · 1d
- Post Open Breakout Trading Strategy with Dynamic ATR Based Position ManagementPine Script · Breakout · 1h
- Triple Pattern Oscillation Trading StrategyPine Script · Breakout · 1h