Strategy vault / Trend following
An Advanced Dual Timeframe Trend Tracking Strategy for a Hot Stock
The "Dual Timeframe Trend Tracking Strategy for a Hot Stock" is a sophisticated algorithmic trading strategy designed to capture and track trends of a popular stock in 2023. It combines indicators across daily and…
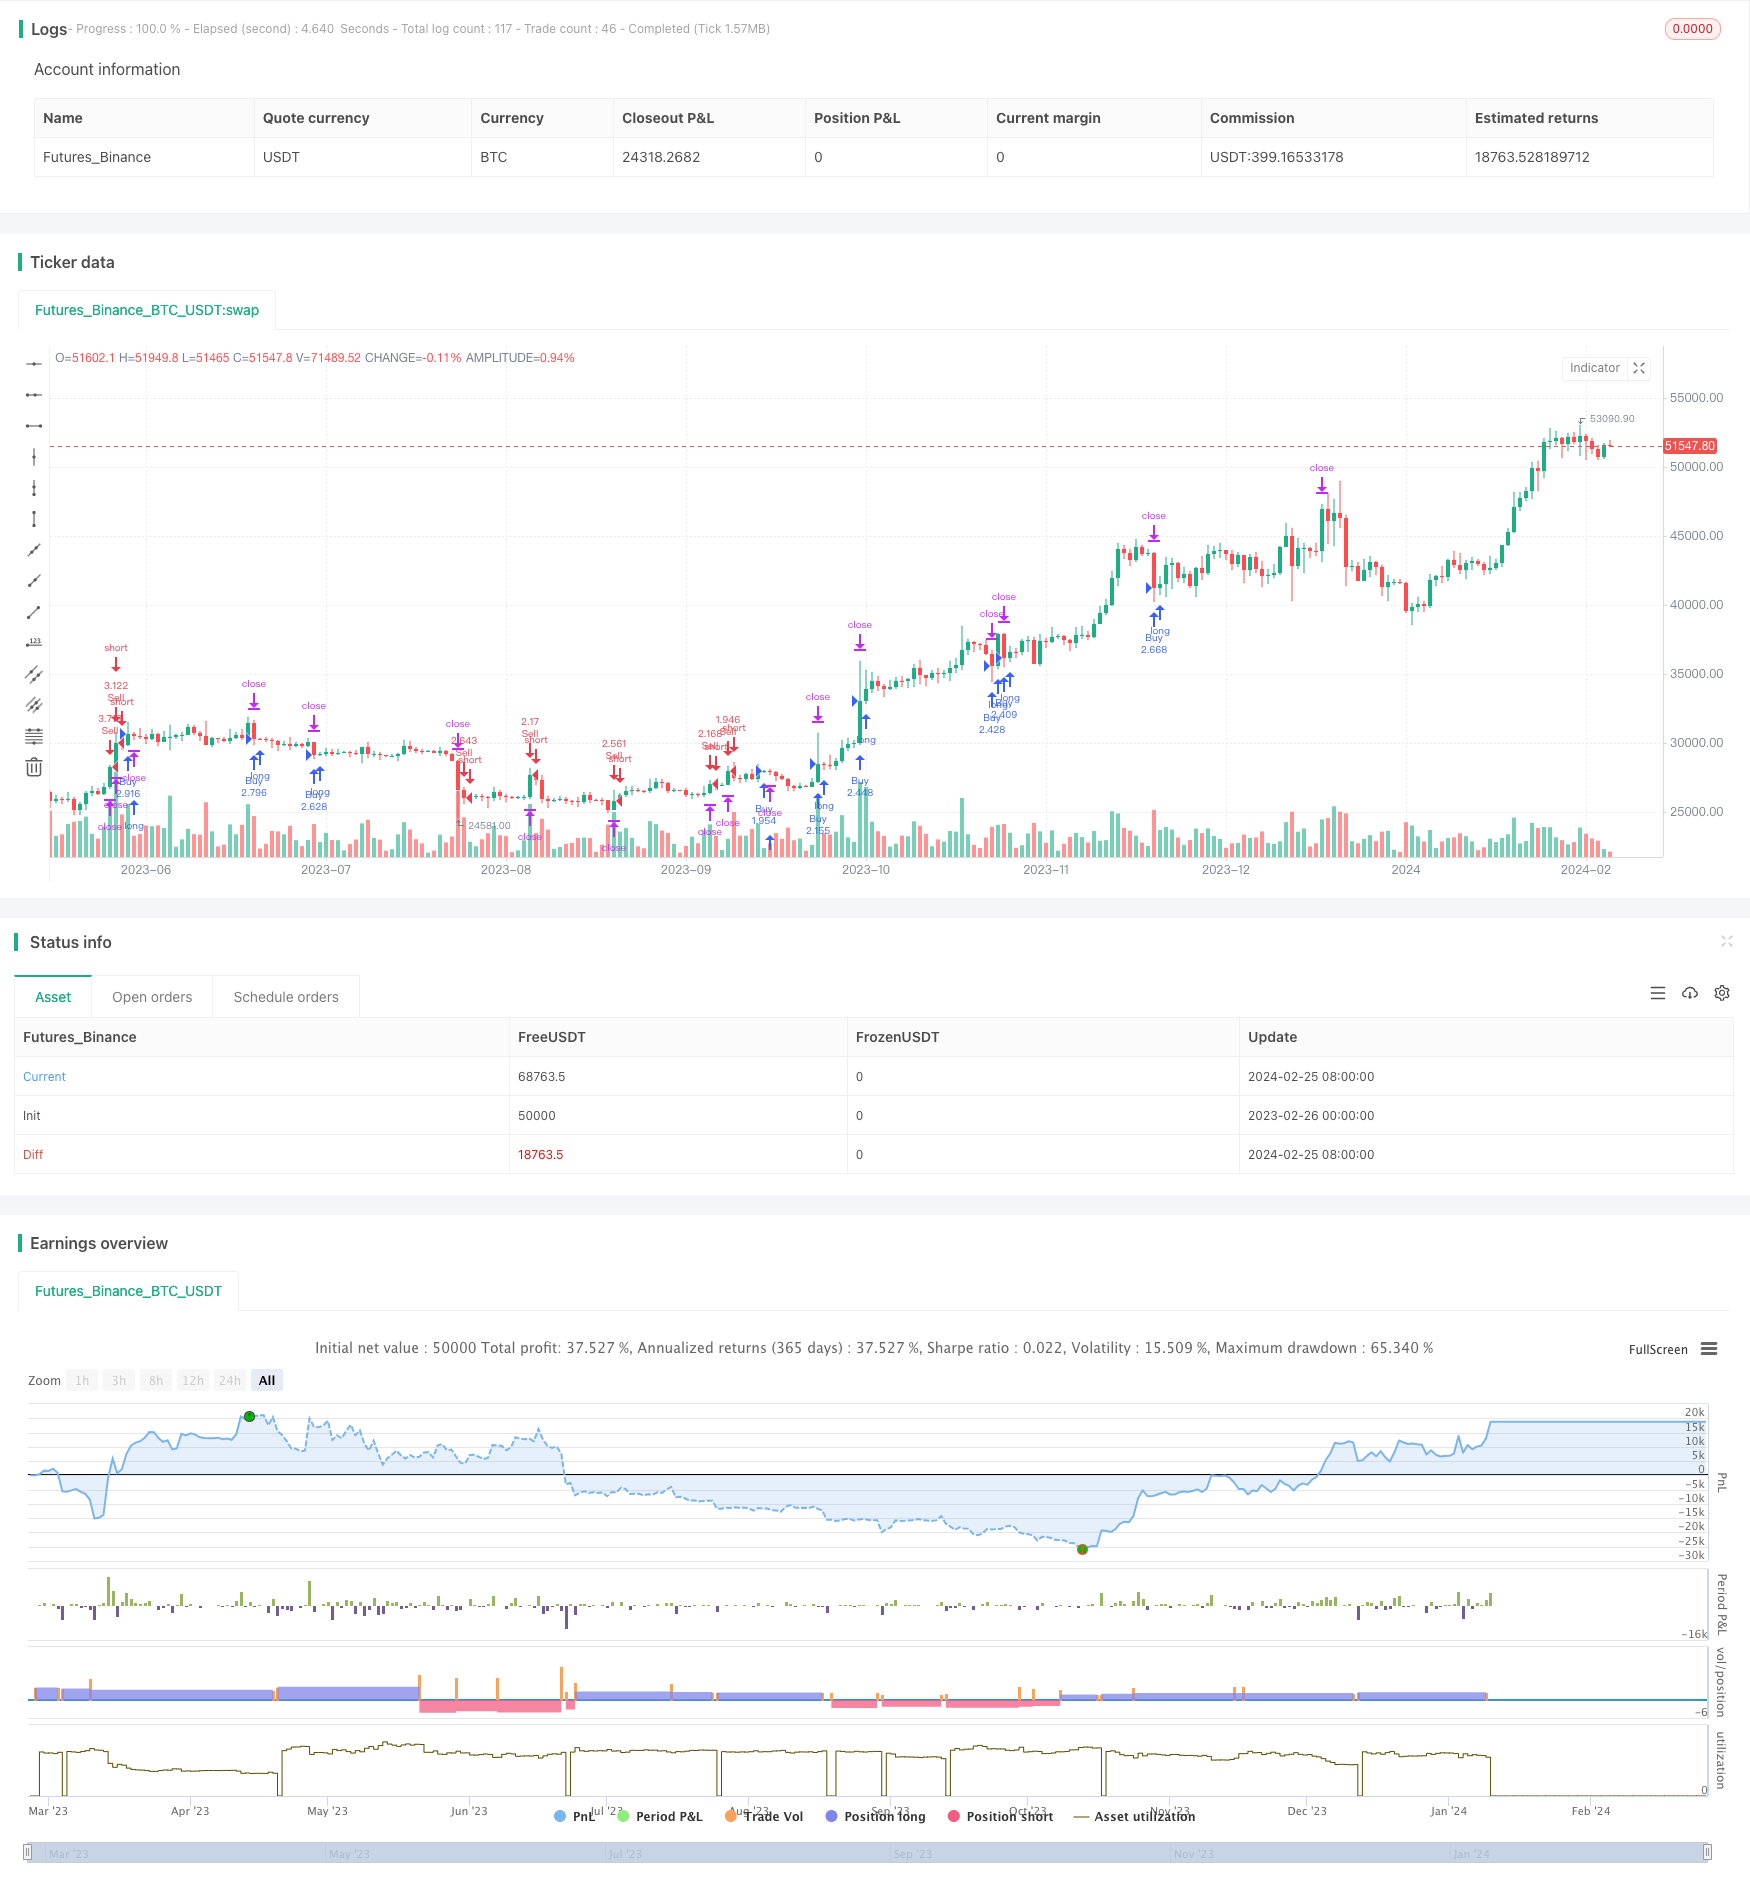
Overview
The "Dual Timeframe Trend Tracking Strategy for a Hot Stock" is a sophisticated algorithmic trading strategy designed to capture and track trends of a popular stock in 2023. It combines indicators across daily and hourly timeframes to generate trade signals while implementing dynamic stop loss and take profit for optimized risk management. The strategy aims to achieve steady profits while controlling risk.
Strategy Logic
The strategy uses 20-period and 50-period Exponential Moving Averages (EMA) to determine trend direction on both daily and hourly timeframes. A buy signal is generated when the 20-day EMA crosses above the 50-day EMA on both timeframes. A sell signal is triggered when the 20-day EMA crosses below the 50-day EMA on both daily and hourly charts. The indicator combinations effectively identify trend initiations.
In addition, the Average True Range (ATR) indicator is used to set adaptive stop loss and take profit levels. The stop loss is set at 1.5 times the ATR, while take profit is 3 times the ATR. This allows dynamic adjustments of the risk parameters based on market volatility.
Advantage Analysis
The key advantages of this strategy include:
Combination of multi-timeframe indicators improves signal accuracy in detecting trend starts.
Dynamic stop loss and take profit settings enable more intelligent risk management.
Clear signal for entry and exit points to capitalize on trend opportunities.
Strict risk control for individual trades helps achieve steady returns.
Risk Analysis
There are also some risks to consider:
Optimized specifically for a hot stock in 2023 only. May not work for other stocks or years.
Extreme volatility can still cause losses.
Multi-timeframe signals may have occasional false signals.
Systemic market risk can also impact strategy performance.
Enhancement Opportunities
Some ways to further improve the strategy:
Incorporate market benchmarks to avoid trades during high systemic risk events.
Consider fundamentals and events for stop loss and take profit sizing.
Test EMA parameter tuning for performance.
Add machine learning for signal forecasting.
Conclusion
In summary, this strategy comprehensively accounts for trend, risk management and optimization. With appropriate risk control, it is suitable for experienced investors to capitalize on hot stock trend trading opportunities and achieve steady returns. Proper programming skill and quant trading knowledge are required to implement this strategy, along with the willingness to undertake potential losses. Overall this is a recommended algorithmic trading approach for a hot stock.
Source Pine Script
/*backtest
start: 2023-02-26 00:00:00
end: 2024-02-26 00:00:00
period: 1d
basePeriod: 1h
exchanges: [{"eid":"Futures_Binance","currency":"BTC_USDT"}]
*/

//@version=5
strategy("TSLA Enhanced Trend Master 2023", overlay=true)

// Daily timeframe indicators
ema20_daily = ta.ema(close, 20)
ema50_daily = ta.ema(close, 50)

// 1-hour timeframe indicators
ema20_hourly = request.security(syminfo.tickerid, "60", ta.ema(close, 20))
ema50_hourly = request.security(syminfo.tickerid, "60", ta.ema(close, 50))

// Check if the year is 2023
is_2023 = year(time) == 2023

// Counter for short trades
var shortTradeCount = 0

// Entry Conditions
buySignal = is_2023 and (ema20_daily > ema50_daily) and (ema20_hourly > ema50_hourly)
sellSignal = is_2023 and (ema20_daily < ema50_daily) and (ema20_hourly < ema50_hourly) and (shortTradeCount < 0.5 * ta.highest(close, 14))

// Dynamic Stop Loss and Take Profit
atr_value = ta.atr(14)
stopLoss = atr_value * 1.5
takeProfit = atr_value * 3

// Calculate Position Size based on Volatility-Adjusted Risk
riskPercent = 2
positionSize = strategy.equity * riskPercent / close

// Strategy
if (buySignal)
    strategy.entry("Buy", strategy.long, qty=positionSize)
    strategy.exit("Take Profit/Stop Loss", "Buy", stop=close - stopLoss, limit=close + takeProfit)

if (sellSignal)
    strategy.entry("Sell", strategy.short, qty=positionSize)
    strategy.exit("Take Profit/Stop Loss", "Sell", stop=close + stopLoss, limit=close - takeProfit)
    shortTradeCount := shortTradeCount + 1
Published by ChaoZhang on the FMZ strategy square · last modified 2024-02-27. Collected in the Quant Trading Vault. Unvalidated research: re-test with your own data and costs before trusting it.
Build this with AgenKit
A spec is not a trading system. Paste this into your coding agent and AgenKit runs a specialist team — architecture, test-first build, risk gates, review — with paper trading on by default.
/agenkit build a production-grade trading bot with a backtest engine, risk controls and paper trading by default from strategies/An-Advanced-Dual-Timeframe-Trend-Tracking-Strategy-for-a-Hot-Stock.md- npx agenkit install engineering-kit in your project
- Paste the command into your agent and approve each phase
- Get tests, backtest, risk controls and a paper-trading switch
Understand it first
Before you run this, read the lesson behind the idea and how to backtest it honestly. Specs like this one are the survivors of an unknown number of trials; deflate their results accordingly.
Related specs
- ATR Dynamic Trend Following and EMA Crossover Trading StrategyPine Script · Trend following · 1d
- ATR and Moving Average Crossover Hybrid StrategyPine Script · Trend following · 1h
- ATR and T3 Moving Average StrategyPine Script · Trend following · 5m
- Adaptive ATR and RSI Trend Following Strategy with Trailing Stop LossPine Script · Trend following · 1h
- Bollinger Bands and RSI Trend Following StrategyPine Script · Trend following · 1h
- Dual ATR Channel Trend Following StrategyPine Script · Trend following · 15m