Strategy vault / Trend following
An Intraday Trend Following Quantitative Strategy Based on Multi indicator Condition Filtering
This strategy combines PSAR to judge price trends, ADX to judge trend strength, RSI to locate overbought and oversold zones, and CMF to judge fund flows to construct an intraday trend-following quantitative trading…
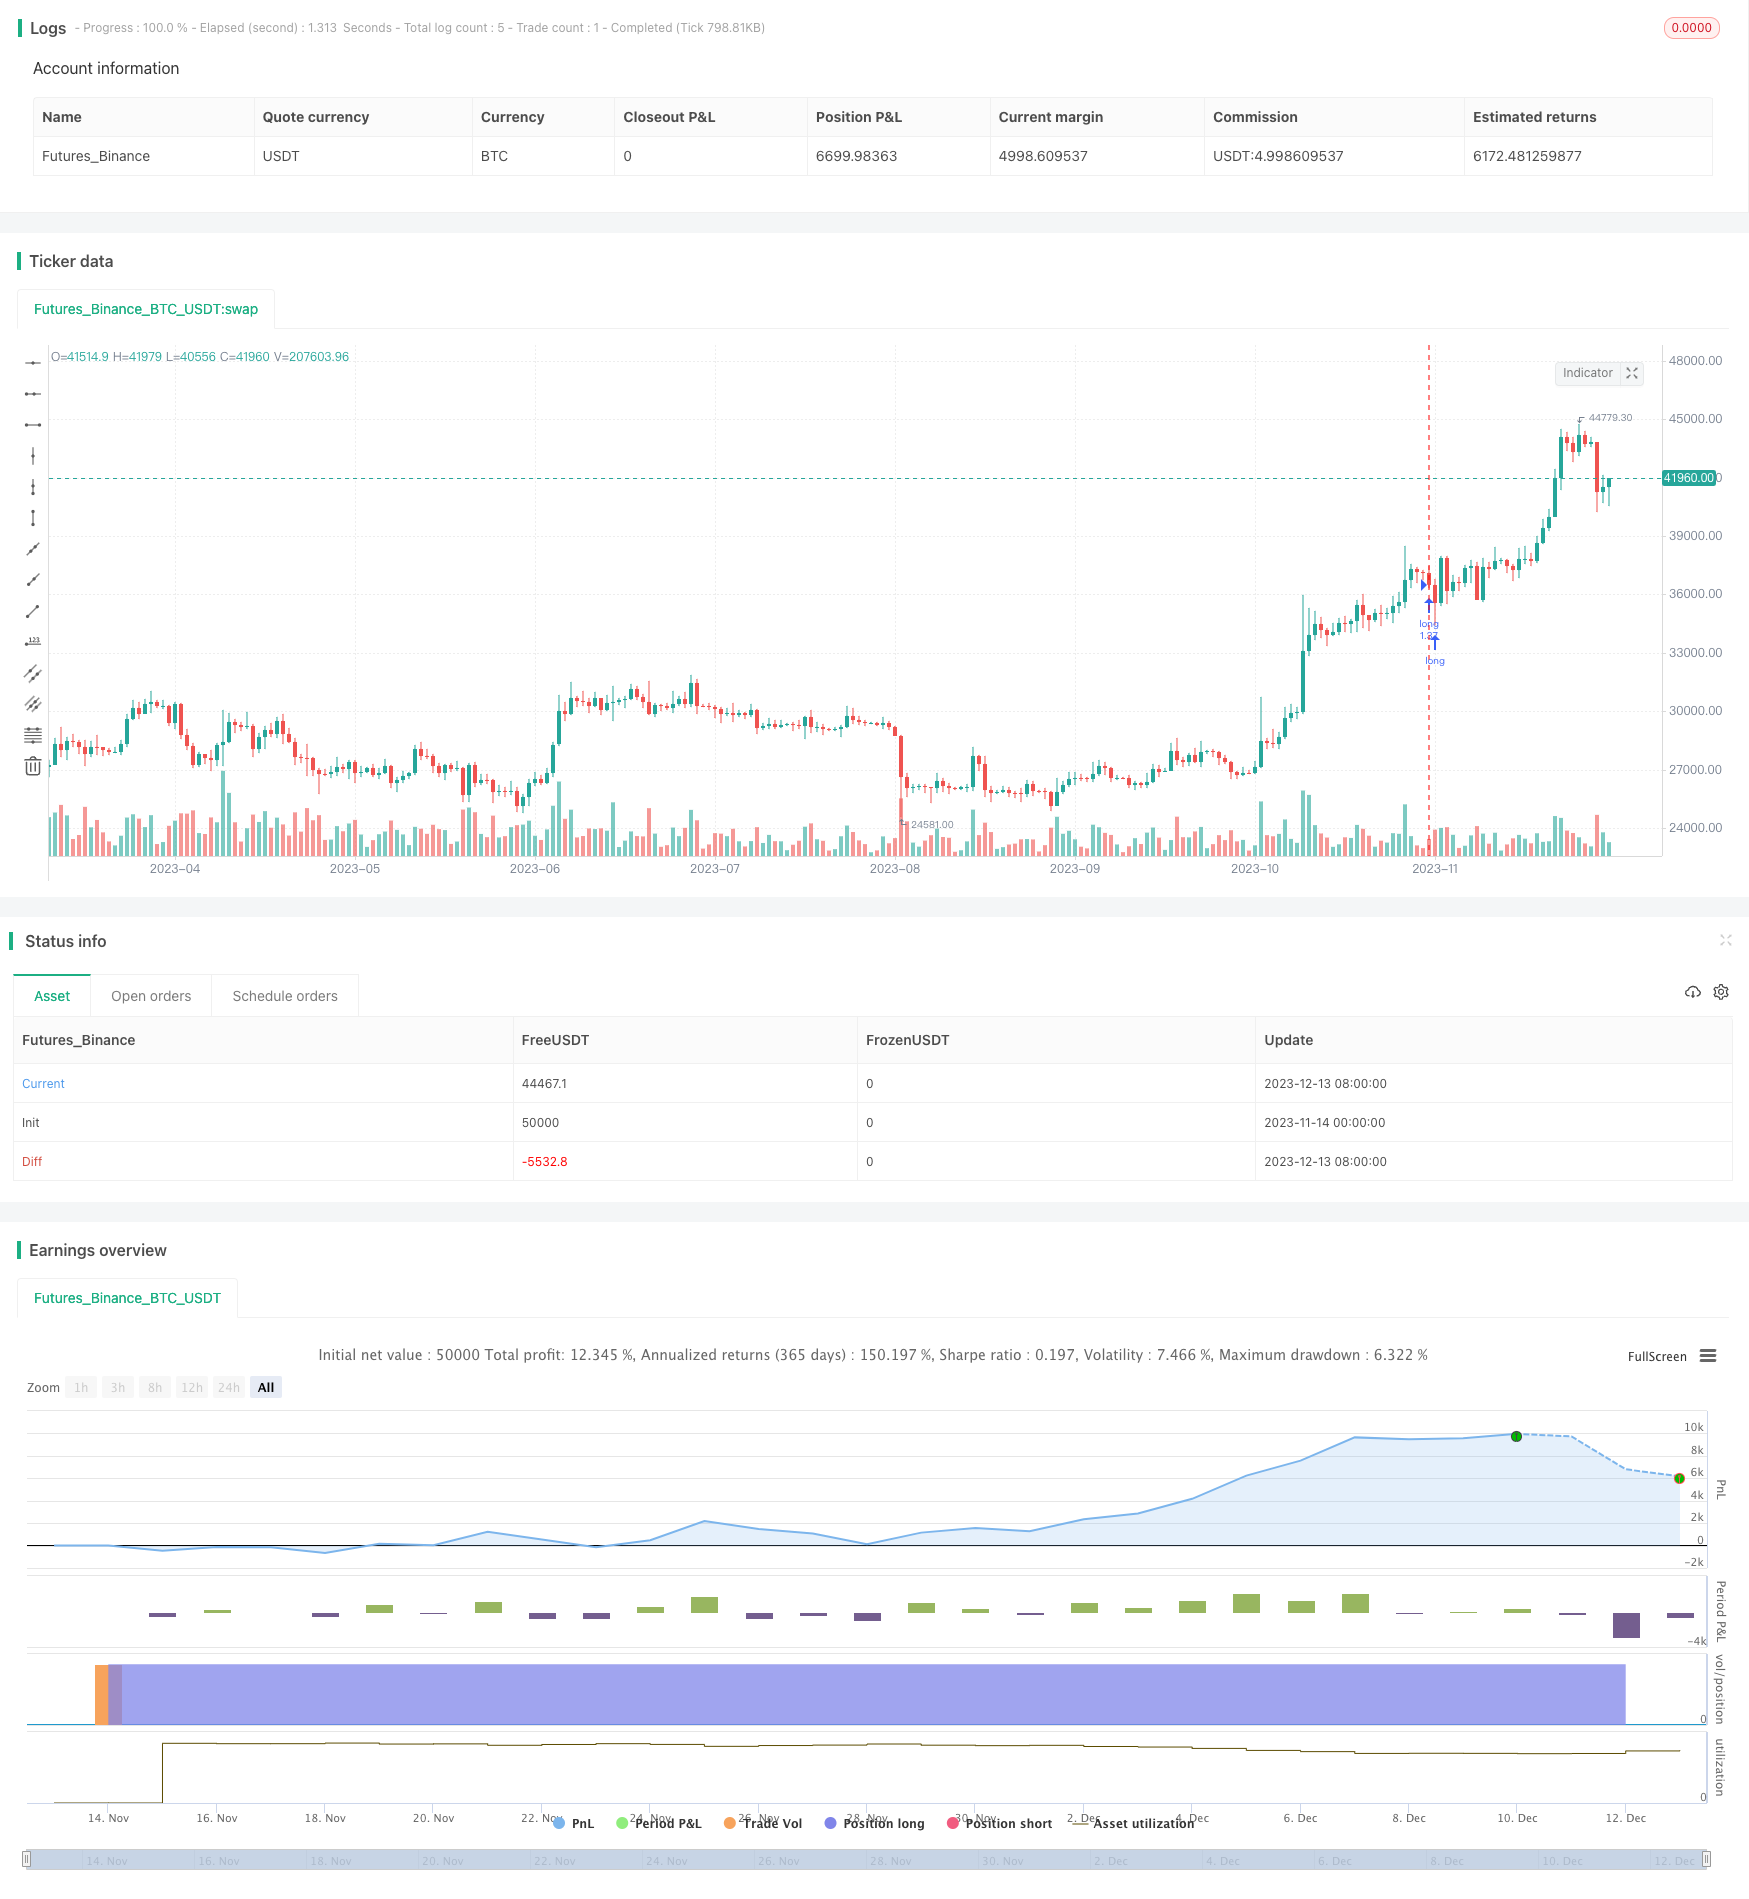
Overview
This strategy combines PSAR to judge price trends, ADX to judge trend strength, RSI to locate overbought and oversold zones, and CMF to judge fund flows to construct an intraday trend-following quantitative trading strategy across cycles. It can quickly locate new trend directions when prices break out of consolidation and form new trends, and continues to track trends afterwards. While ensuring that main trend gains are captured, filtering conditions are also set during the process to reduce holding risks.
Principles
The main judging rules of this strategy are:
Use the PSAR indicator to judge whether prices are in an uptrend. PSAR's decline below prices indicates the end of the upward trend and the start of a downward trend.
Require RSI to be above the midpoint of 50 to filter out false breakouts occurring in oversold zones.
Require ADX to be above its EMA line, indicating a sustainable signal in trend analysis.
Require CMF to be greater than 0, judging increased funds flowing in.
Buying signals are generated when all four conditions above are met. Selling conditions occur when PSAR rises above prices, RSI drops below 50, ADX drops below its EMA and CMF becomes less than 0.
This strategy comprehensively considers the price trend direction, trend strength, the overbought/oversold state and fund flows when setting up trading rules. By setting strict logical rules when generating trading signals, false breakouts can be effectively filtered and high probability sustainable trend directions can be captured.
Advantages
The main advantages of this strategy include:
Combining multiple indicators in setting up trading rules can effectively prevent false breakouts and ensures signal quality.
Rapidly locating budding trend directions and tracking enables capturing most trend profits.
Setting up process filtering conditions can effectively control risks and ensures tracking efficacy.
Considering trend strength helps avoiding trading range congestions.
Risk Analysis
The main risks of this strategy include:
A single strategy accumulation poses portfolio risks, requiring appropriate position sizing.
Closely monitor filtering condition changes during tracking to avoid losses when cancelled.
This mid/long-term strategy can be disrupted short-term by fluctuations and incurs stop loss risks.
Corresponding risk management measures include: optimizing position sizing rules, setting risk alert lines and widening stop distances etc.
Optimization Directions
Optimization spaces include:
Parameter optimization via machine learning given current subjective settings.
Add position sizing module that dynamically sizes based on risks.
Enhance stop mechanisms e.g. trailing stops, time stops or breakout stops.
Conclusion
This strategy combining indicators proved effective in rapidly locating and tracking nascent trends, validating quantitative trading based on multiple dimensions like trends and funds. As a base, it can be indexed across cycles. With parameter tuning and modular enhancements, it can also become a stable mid/long-term strategy.
Parameters
| Name | Default | What it controls |
|---|---|---|
| v_input_1 | 1.02 | start |
| v_input_2 | 1.02 | increment |
| v_input_3 | 1.2 | maximum |
| v_input_4 | 50 | length |
| v_input_5 | 49 | middle_RSI |
| v_input_6 | 20 | lengthCMF |
| v_input_7 | 14 | ADX Smoothing |
| v_input_8 | 14 | DI Length |
| v_input_9 | 10 | ema_length |
Source Pine Script
/*backtest
start: 2023-11-14 00:00:00
end: 2023-12-14 00:00:00
period: 1d
basePeriod: 1h
exchanges: [{"eid":"Futures_Binance","currency":"BTC_USDT"}]
*/

//@version=4
strategy("psar+ adx + cmf + rsi Strategy", overlay=true,initial_capital = 1000, default_qty_type=strategy.percent_of_equity, default_qty_value=100, commission_type=strategy.commission.percent , commission_value=0.1 )

start = input(1.02)
increment = input(1.02)
maximum = input(1.2)
var bool uptrend = na
var float EP = na
var float SAR = na
var float AF = start
var float nextBarSAR = na
if bar_index > 0
	firstTrendBar = false
	SAR := nextBarSAR
	if bar_index == 1
		float prevSAR = na
		float prevEP = na
		lowPrev = low[1]
		highPrev = high[1]
		closeCur = close
		closePrev = close[1]
		if closeCur > closePrev
			uptrend := true
			EP := high
			prevSAR := lowPrev
			prevEP := high
		else
			uptrend := false
			EP := low
			prevSAR := highPrev
			prevEP := low
		firstTrendBar := true
		SAR := prevSAR + start * (prevEP - prevSAR)
	if uptrend
		if SAR > low
			firstTrendBar := true
			uptrend := false
			SAR := max(EP, high)
			EP := low
			AF := start
	else
		if SAR < high
			firstTrendBar := true
			uptrend := true
			SAR := min(EP, low)
			EP := high
			AF := start
	if not firstTrendBar
		if uptrend
			if high > EP
				EP := high
				AF := min(AF + increment, maximum)
		else
			if low < EP
				EP := low
				AF := min(AF + increment, maximum)
	if uptrend
		SAR := min(SAR, low[1])
		if bar_index > 1
			SAR := min(SAR, low[2])
	else
		SAR := max(SAR, high[1])
		if bar_index > 1
			SAR := max(SAR, high[2])
	nextBarSAR := SAR + AF * (EP - SAR)

//rsi strat
length = input( 50 )
middle_RSI=input(49)
price = close
vrsi = rsi(price, length)

//cmf
lengthCMF = input(20, minval=1)
ad = close==high and close==low or high==low ? 0 : ((2*close-low-high)/(high-low))*volume
mf = sum(ad, lengthCMF) / sum(volume, lengthCMF)

//ADX
adxlen = input(14, title="ADX Smoothing")
dilen = input(14, title="DI Length")
dirmov(len) =>
	up = change(high)
	down = -change(low)
	plusDM = na(up) ? na : (up > down and up > 0 ? up : 0)
	minusDM = na(down) ? na : (down > up and down > 0 ? down : 0)
	truerange = rma(tr, len)
	plus = fixnan(100 * rma(plusDM, len) / truerange)
	minus = fixnan(100 * rma(minusDM, len) / truerange)
	[plus, minus]
adx(dilen, adxlen) =>
	[plus, minus] = dirmov(dilen)
	sum = plus + minus
	adx = 100 * rma(abs(plus - minus) / (sum == 0 ? 1 : sum), adxlen)
sig = adx(dilen, adxlen)
ema_length=input(10)
ema_sig= ema(sig,ema_length)


long = not uptrend  and vrsi > middle_RSI and sig > ema_sig   and mf>0
short= uptrend   and vrsi < middle_RSI and sig<ema_sig and mf<0

strategy.entry("long",1,when=long)
strategy.close('long',when=short)Published by ChaoZhang on the FMZ strategy square · last modified 2023-12-15. Collected in the Quant Trading Vault. Unvalidated research: re-test with your own data and costs before trusting it.
Build this with AgenKit
A spec is not a trading system. Paste this into your coding agent and AgenKit runs a specialist team — architecture, test-first build, risk gates, review — with paper trading on by default.
/agenkit build a production-grade trading bot with a backtest engine, risk controls and paper trading by default from strategies/An-Intraday-Trend-Following-Quantitative-Strategy-Based-on-Multi-indicator-Condition-Filtering.md- npx agenkit install engineering-kit in your project
- Paste the command into your agent and approve each phase
- Get tests, backtest, risk controls and a paper-trading switch
Understand it first
Before you run this, read the lesson behind the idea and how to backtest it honestly. Specs like this one are the survivors of an unknown number of trials; deflate their results accordingly.
Related specs
- Trend Tracking Four Elements StrategyPine Script · Trend following · 3m
- Multi Factor Trend Following Quantitative StrategyPine Script · Trend following · 1d
- Indicator Verification Automated Trading StrategyPine Script · Trend following · 10m
- Quant Trend Trading StrategyPine Script · Trend following · 1h
- Dual ATR Channel Trend Following StrategyPine Script · Trend following · 15m
- EMA AROON ASHPine Script · Trend following · 3m