Strategy vault / Trend following
ATR and Volatility Index Based Trend Tracking Strategy
This strategy uses Average True Range (ATR) and CHOP index as the main technical indicators to identify and track trends. It enters when the index breaks through the upper and lower rails, combined with the trend…
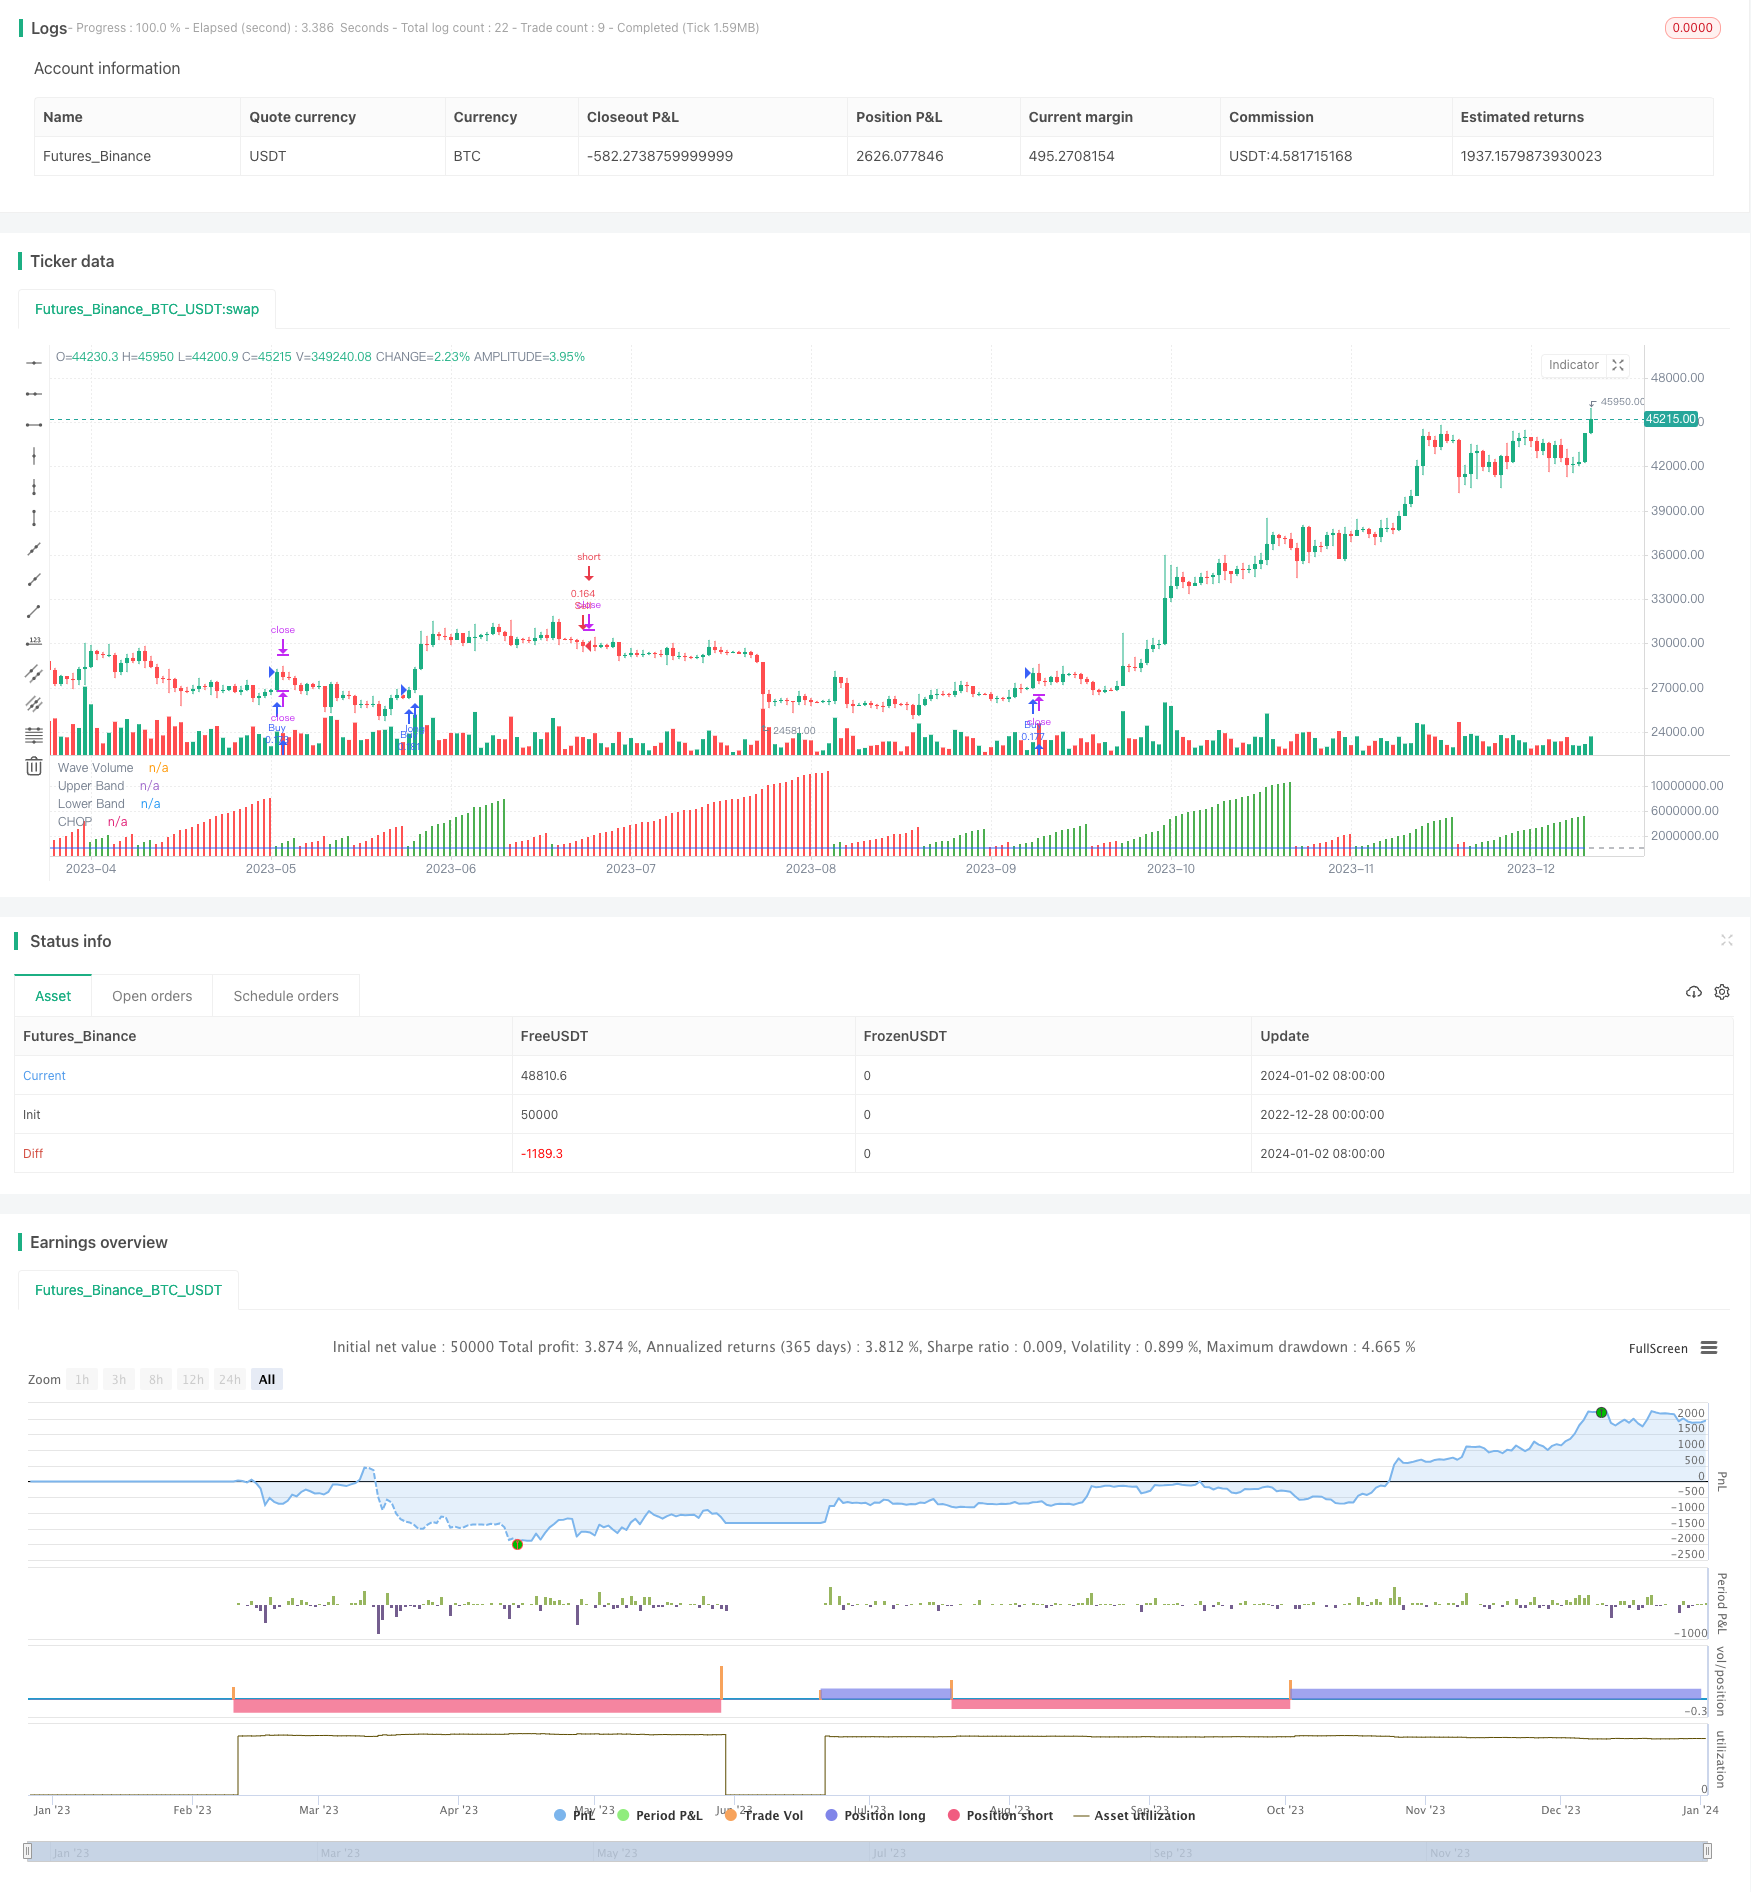
Overview
This strategy uses Average True Range (ATR) and CHOP index as the main technical indicators to identify and track trends. It enters when the index breaks through the upper and lower rails, combined with the trend direction as entry signals; and exits with stop loss or take profit when the index re-enters the belt area.
Strategy Principle
Use ATR to calculate the box size and construct the Renko channel to determine the price trend direction.
Apply the CHOP index to judge if the market is suitable for trading. This index incorporates highest price, lowest price and ATR. When it is between 38.2-61.8, it indicates low market volatility; otherwise, it signals high volatility and unsuitable trading market.
When the CHOP index breaks down the 61.8 upper rail, the price enters a downward trend. If the short-term fast EMA also shows the price is leading, go short. Conversely, when CHOP breaks up the 38.2 lower rail and the short-term EMA rises, go long.
Use stop loss/take profit strategy. When the price re-enters the 38.2-61.8 belt area of CHOP, close the position with stop loss or take profit.
Advantage Analysis
This strategy combines trend judgment and volatility control, which can both capture price trends and control risks. It is a relatively stable trend tracking strategy.
The Renko channel constructed by ATR can effectively track price trends.
The CHOP index judges market volatility rate to avoid incorrect trading in violent fluctuations.
Combining fast EMA to determine short-term trend direction avoids reverse operation.
Stop loss/take profit strategy controls single loss.
Risk Analysis
The main risks this strategy faces:
In sideways market, ATR channel and CHOP signals may produce incorrect signals. Fine tune parameters to filter out wrong signals appropriately.
Single technical indicator combo cannot fully avoid losses. Manual intervention is needed to determine major trends.
Stop loss position set too loose may lead to oversized single loss. Should narrow down stop loss magnitude properly.
Optimization Direction
This strategy can be optimized in the following aspects:
Increase other auxiliary indicators to determine signals, like candlestick patterns, volume etc to improve signal accuracy.
Optimize parameters of ATR and CHOP to capture price fluctuations better.
Set dynamic stop loss/take profit positions for larger profit margins and faster stop loss.
Properly loosen stop loss range after determining major trend to gain more profits in the trend.
Conclusion
This strategy integrates commonly-used technical indicators and is simple & practical. With parameter adjustment and optimization, satisfactory tracking effects can be obtained. But it still requires manual judgment of major trends and cannot be fully automated. It can serve as an auxiliary decision-making tool and reference for other strategies.
Parameters
| Name | Default | What it controls |
|---|---|---|
| v_input_1 | true | Max Intraday Loss(%) |
| v_input_2 | 0 | Renko Assignment Method: ATR | Traditional | Part of Price |
| v_input_3 | 14 | Value |
| v_input_4 | 0 | Price Source: Close | Open / Close | High / Low |
| v_input_5 | 0 | Use True Range instead of Volume: Auto | Always | Never |
| v_input_6 | false | Oscillating |
| v_input_7 | false | Normalize |
| v_input_8 | 14 | length |
| v_input_9 | false | Offset |
Source Pine Script
/*backtest
start: 2022-12-28 00:00:00
end: 2024-01-03 00:00:00
period: 1d
basePeriod: 1h
exchanges: [{"eid":"Futures_Binance","currency":"BTC_USDT"}]
*/

// This source code is subject to the terms of the Mozilla Public License 2.0 at https://mozilla.org/MPL/2.0/
// © sharatgbhat

//@version=4
strategy("Weis Chop Strategy", overlay=false, default_qty_type = strategy.percent_of_equity, default_qty_value = 10,max_lines_count = 500, max_labels_count = 500)
maxIdLossPcnt = input(1, "Max Intraday Loss(%)", type=input.float)
// strategy.risk.max_intraday_loss(maxIdLossPcnt, strategy.percent_of_equity)

method = input(defval="ATR", options=["ATR", "Traditional", "Part of Price"], title="Renko Assignment Method")
methodvalue = input(defval=14.0, type=input.float, minval=0, title="Value")
pricesource = input(defval="Close", options=["Close", "Open / Close", "High / Low"], title="Price Source")
useClose = pricesource == "Close"
useOpenClose = pricesource == "Open / Close" or useClose
useTrueRange = input(defval="Auto", options=["Always", "Auto", "Never"], title="Use True Range instead of Volume")
isOscillating = input(defval=false, type=input.bool, title="Oscillating")
normalize = input(defval=false, type=input.bool, title="Normalize")
vol = useTrueRange == "Always" or useTrueRange == "Auto" and na(volume) ? tr : volume
op = useClose ? close : open
hi = useOpenClose ? close >= op ? close : op : high
lo = useOpenClose ? close <= op ? close : op : low

if method == "ATR"
    methodvalue := atr(round(methodvalue))
if method == "Part of Price"
    methodvalue := close / methodvalue

currclose = float(na)
prevclose = nz(currclose[1])
prevhigh = prevclose + methodvalue
prevlow = prevclose - methodvalue
currclose := hi > prevhigh ? hi : lo < prevlow ? lo : prevclose

direction = int(na)
direction := currclose > prevclose ? 1 : currclose < prevclose ? -1 : nz(direction[1])
directionHasChanged = change(direction) != 0
directionIsUp = direction > 0
directionIsDown = direction < 0

barcount = 1
barcount := not directionHasChanged and normalize ? barcount[1] + barcount : barcount
vol := not directionHasChanged ? vol[1] + vol : vol
res = barcount > 1 ? vol / barcount : vol

plot(isOscillating and directionIsDown ? -res : res, style=plot.style_columns, color=directionIsUp ? color.green : color.red, transp=75, linewidth=3, title="Wave Volume")

length = input(14, minval=1)
ci = 100 * log10(sum(atr(1), length) / (highest(length) - lowest(length))) / log10(length)
offset = input(0, "Offset", type = input.integer, minval = -500, maxval = 500)
plot(ci, "CHOP", color=#2962FF, offset = offset)
band1 = hline(61.8, "Upper Band", color=#787B86, linestyle=hline.style_dashed)
band0 = hline(38.2, "Lower Band", color=#787B86, linestyle=hline.style_dashed)
fill(band1, band0, color = color.rgb(33, 150, 243, 90), title = "Background")

MomentumBull = close>ema(close,8)
MomentumBear = close<ema(close,8)
Tradecon = crossunder(ci,61.8)

if (MomentumBull and directionIsUp and Tradecon)
	strategy.entry("Buy", strategy.long)
if (MomentumBear and directionIsDown and Tradecon )
    strategy.entry("Sell", strategy.short)
    strategy.exit("exit","Buy",when=directionIsDown,qty_percent=100,profit=20,loss=10)
    strategy.exit("exit","Sell",when=directionIsUp,qty_percent=100,profit=20,loss=10)
Published by ChaoZhang on the FMZ strategy square · last modified 2024-01-04. Collected in the Quant Trading Vault. Unvalidated research: re-test with your own data and costs before trusting it.
Build this with AgenKit
A spec is not a trading system. Paste this into your coding agent and AgenKit runs a specialist team — architecture, test-first build, risk gates, review — with paper trading on by default.
/agenkit build a production-grade trading bot with a backtest engine, risk controls and paper trading by default from strategies/ATR-and-Volatility-Index-Based-Trend-Tracking-Strategy.md- npx agenkit install engineering-kit in your project
- Paste the command into your agent and approve each phase
- Get tests, backtest, risk controls and a paper-trading switch
Understand it first
Before you run this, read the lesson behind the idea and how to backtest it honestly. Specs like this one are the survivors of an unknown number of trials; deflate their results accordingly.
Related specs
- ATR Dynamic Trend Following and EMA Crossover Trading StrategyPine Script · Trend following · 1d
- ATR and Moving Average Crossover Hybrid StrategyPine Script · Trend following · 1h
- ATR and T3 Moving Average StrategyPine Script · Trend following · 5m
- Adaptive ATR and RSI Trend Following Strategy with Trailing Stop LossPine Script · Trend following · 1h
- Bollinger Bands and RSI Trend Following StrategyPine Script · Trend following · 1h
- Dual ATR Channel Trend Following StrategyPine Script · Trend following · 15m