Bollinger Band Fitting Strategy
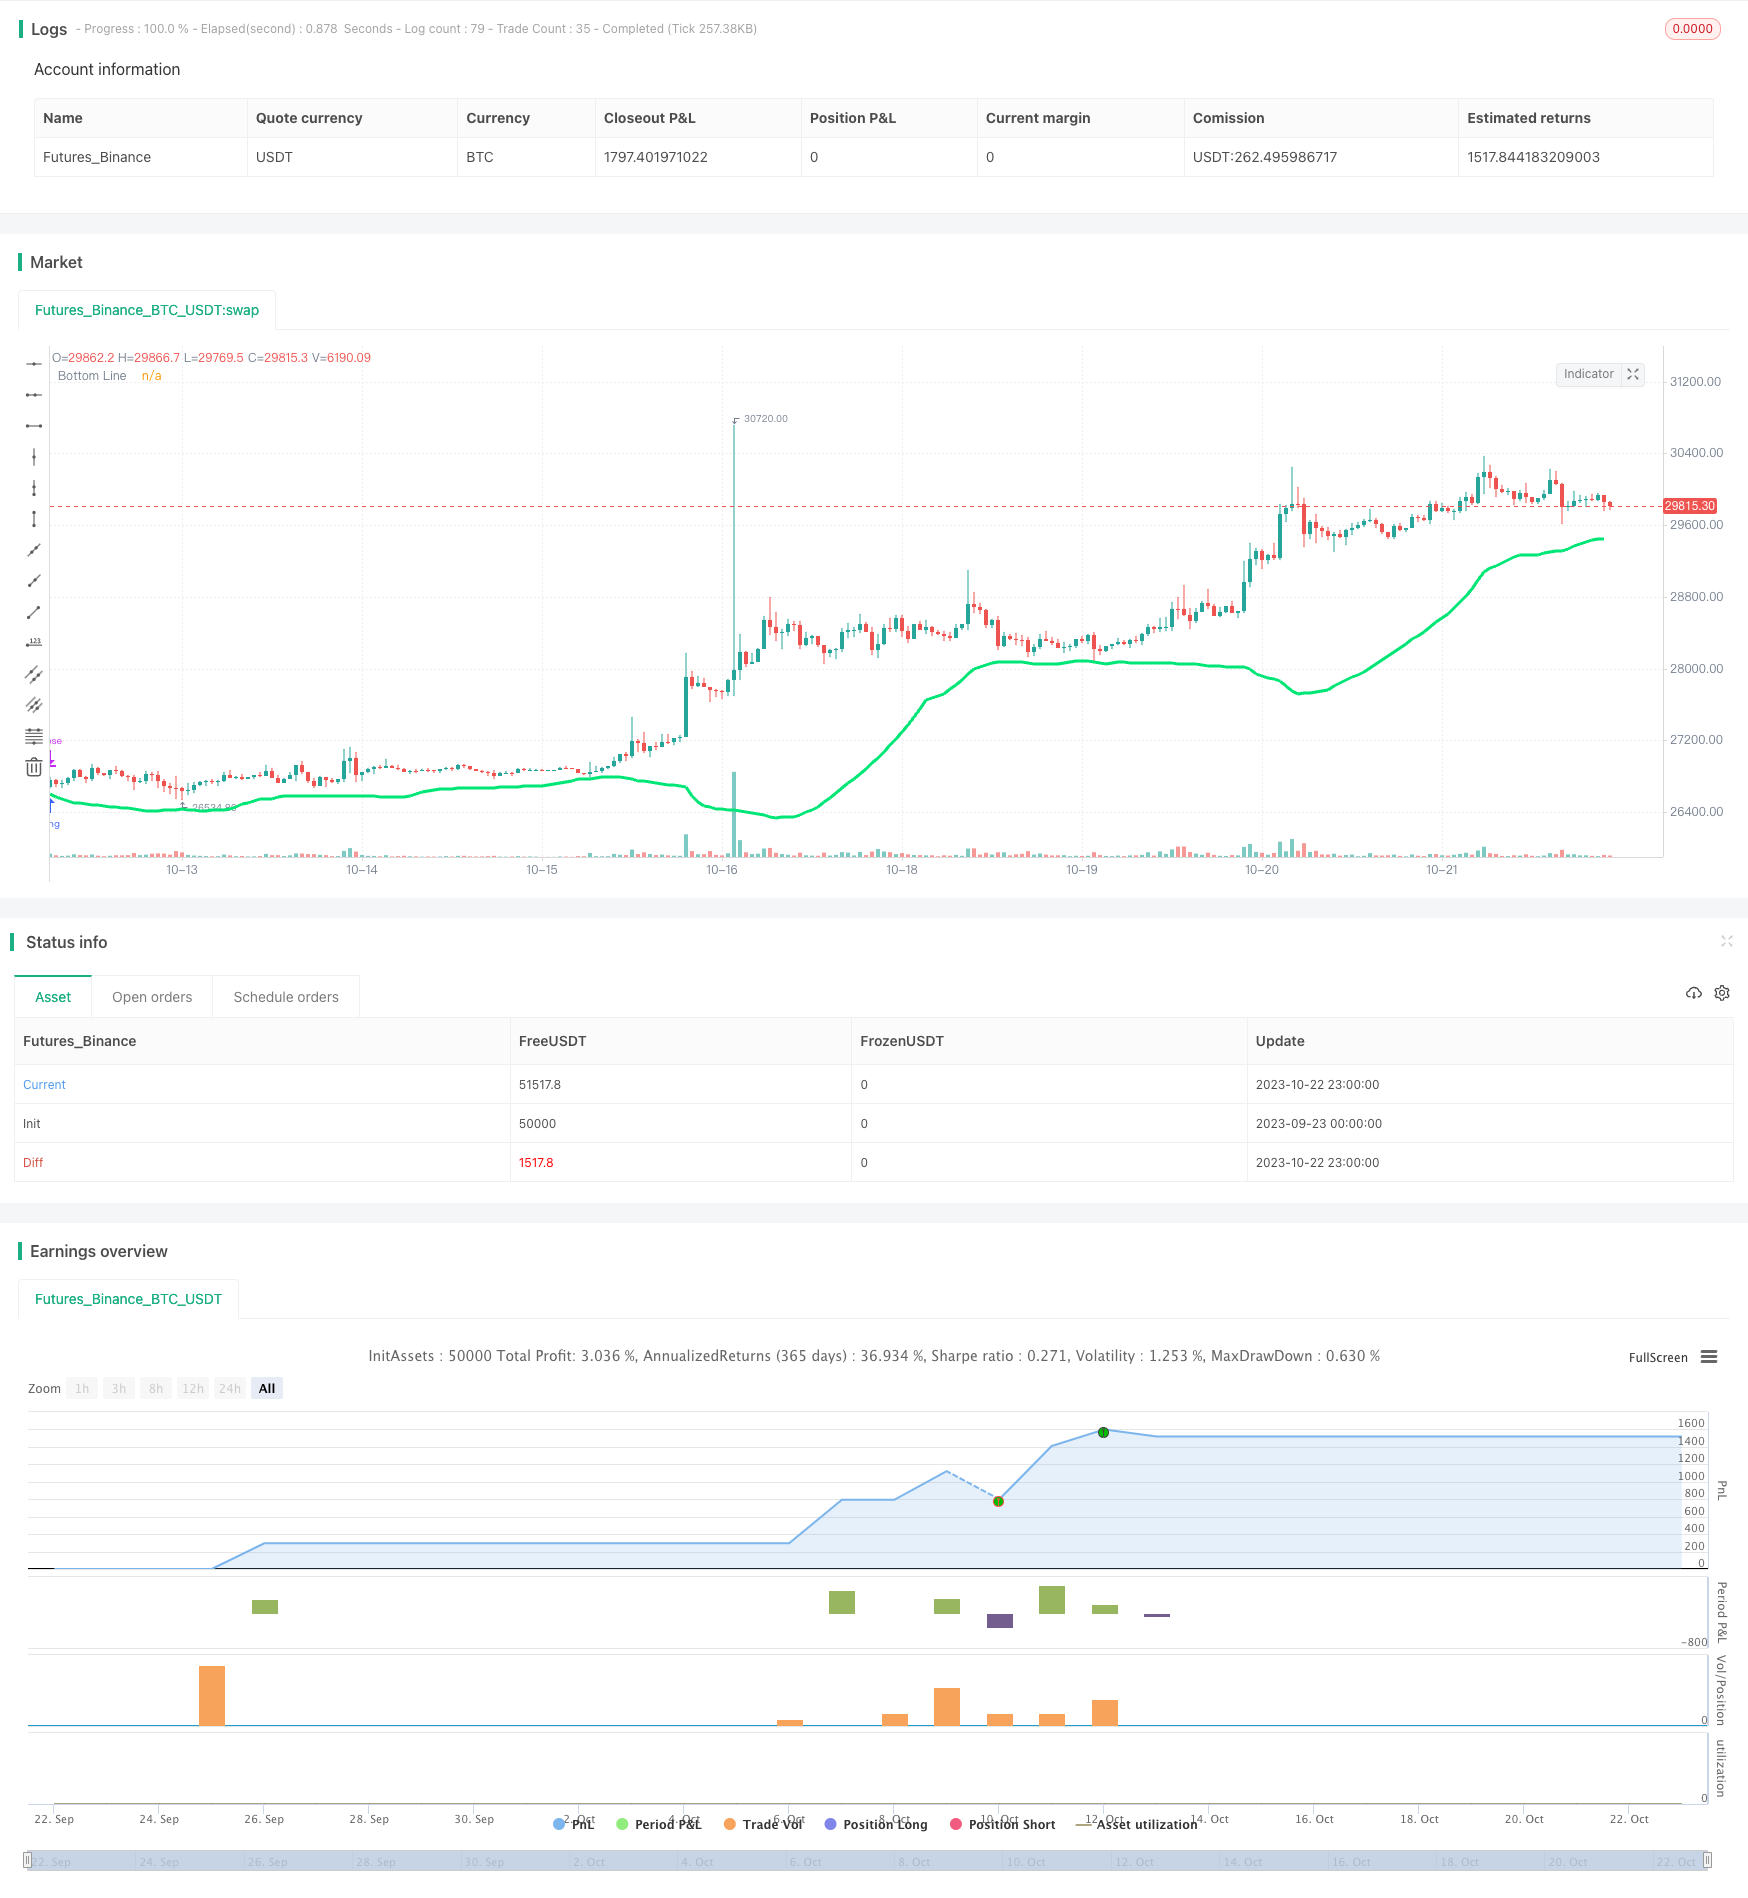
This strategy uses the Bollinger Bands indicator for trend judgment, combined with the RSI indicator to avoid overbuying, as well as candle body filters and color filters to further validate trading signals. Overall…
Overview
This strategy uses the Bollinger Bands indicator for trend judgment, combined with the RSI indicator to avoid overbuying, as well as candle body filters and color filters to further validate trading signals. Overall, the main idea of this strategy is to buy at the beginning of a trend and exit before the trend reversal, in order to profit.
Principles
This strategy first uses the lower band of the Bollinger Bands indicator. When the price is below the lower band, it is considered an opportunity to open a position. To avoid overbuying, the strategy also introduces the RSI indicator, which requires the RSI to be less than 30 to generate a buy signal. In addition, the strategy sets a candle body filter that requires the body of the current candlestick to be greater than half the average body of the candlesticks over the past 10 periods in order to trigger a buy. Finally, the color filter requires the candle to be green (closing higher) to further validate the timing of the buy.
When the price breaks through the lower band of the Bollinger Bands, the RSI is less than 30, the body is sufficiently large, and the candle is green, a buy signal is generated. When the closing price is higher than the opening price and the body is greater than half of the average body, it is a trend reversal signal indicating closing the position.
Advantage Analysis
The biggest advantage of this strategy is that it can successfully determine the beginning of a trend and enter the market, and exit before the trend reversal, thus profit potential is large. Specifically, the main advantages are:
The Bollinger Bands indicator accurately judges trend direction. It uses the price fluctuation range to determine price movements, so using this indicator can effectively determine the start and end of trends.
The RSI indicator avoids overbuying. RSI can measure overbought and oversold conditions. Using it avoids wrongly buying during temporary price corrections.
Entity filtering increases signal reliability. A larger candle body represents a more powerful breakthrough. Entity filtering ensures buying strong breakthroughs.
Color filtering confirms timing. Only buying on green candles further validates proper timing.
Candle turning green indicates trend reversal after buying. Traders say "trends take turns", and candle turning green can judge reversal timing.
Risk Analysis
The strategy also has some risks to note:
Possibility of false signals from Bollinger Bands. It may also produce false breakout signals when the market oscillates.
Losses enlarge without stop loss. The lack of stop loss can lead to larger losses if judgements are wrong.
Filtering conditions too strict miss buying opportunities. Multiple stacked filters may miss opportunities.
Relies on optimized backtesting results. Parameter and filter settings need optimization and verification, real trading results also need verification.
Candle turning green unreliable for determining reversals. It doesn't fully confirm trend reversal.
For the risks, stop loss can control losses, optimizing filters reduces missed buys, using multiple indicators verifies signals, and verifying results in live trading.
Improvement Directions
The strategy can be optimized in several aspects:
Optimize Bollinger Band parameters for best settings. Test different periods, standard deviation multiples, etc.
Test different oscillators instead of RSI. e.g. KDJ, Williams %R, etc.
Add trailing stop loss to control risks. Set reasonable stops based on backtest data.
Optimize filter condition parameters. Test different body filter sizes and periods.
Incorporate other indicators to confirm signals. e.g. volume-price confirmation indicators.
Test different reversal signals. e.g. moving average crosses to determine trend reversal.
Test on different products and time frames. Evaluate strategy across different markets.
Conclusion
Overall, the strategy has relatively strong trend following ability and adaptiveness. The core strengths are using Bollinger Bands to determine trend direction and using RSI and filters to ensure timing. But there are also certain risks that need targeted optimization and testing. If parameters and rules can be verified, it may achieve good results in live trading. In conclusion, the strategy has practical value worth exploring.
Parameters
| Name | Default | What it controls |
|---|---|---|
| v_input_1 | 100 | Capital, % |
| v_input_2 | 40 | BB Period |
| v_input_3 | false | Use Body-Filter |
| v_input_4 | false | Use Color-Filter |
| v_input_5 | true | Use RSI-Filter |
| v_input_6 | false | Show Arrows |
| v_input_7 | 1900 | From Year |
| v_input_8 | 2100 | To Year |
| v_input_9 | true | From Month |
| v_input_10 | 12 | To Month |
| v_input_11 | true | From day |
| v_input_12 | 31 | To day |
Source Pine Script
/*backtest
start: 2023-09-23 00:00:00
end: 2023-10-23 00:00:00
period: 1h
basePeriod: 15m
exchanges: [{"eid":"Futures_Binance","currency":"BTC_USDT"}]
*/

//Noro
//2018

//Donate: 3BMEXvKkuJLobJrcpMm12bKTZoCnojZTjh

//@version=2
strategy(title = "Noro's Wizard Strategy v1.1", shorttitle = "Wizard str 1.1", overlay = true, default_qty_type = strategy.percent_of_equity, default_qty_value = 100, pyramiding = 10)

//Settings
capital = input(100, defval = 100, minval = 1, maxval = 10000, title = "Capital, %")
length = input(40, defval = 40, minval = 1, maxval = 200, title = "BB Period")
usebod = input(false, defval = false, title = "Use Body-Filter")
usecol = input(false, defval = false, title = "Use Color-Filter")
usersi = input(true, defval = true, title = "Use RSI-Filter")
showar = input(false, defval = false, title = "Show Arrows")
fromyear = input(1900, defval = 1900, minval = 1900, maxval = 2100, title = "From Year")
toyear = input(2100, defval = 2100, minval = 1900, maxval = 2100, title = "To Year")
frommonth = input(01, defval = 01, minval = 01, maxval = 12, title = "From Month")
tomonth = input(12, defval = 12, minval = 01, maxval = 12, title = "To Month")
fromday = input(01, defval = 01, minval = 01, maxval = 31, title = "From day")
today = input(31, defval = 31, minval = 01, maxval = 31, title = "To day")

//Bollinger
src = low
mult = 2
basis = sma(src, length)
dev = mult * stdev(src, length)
lower = basis - dev
plot(lower, color = lime, linewidth = 3, title="Bottom Line")

//Fast RSI Filter
fastup = rma(max(change(close), 0), 7)
fastdown = rma(-min(change(close), 0), 7)
rsi = fastdown == 0 ? 100 : fastup == 0 ? 0 : 100 - (100 / (1 + fastup / fastdown))
rsif = rsi < 30 or usersi == false

//Body Filter
nbody = abs(close - open)
abody = sma(nbody, 10)
body = nbody > abody / 2 or usebod == false

//Signals
up1 = low < lower and (close < open or usecol == false) and body and rsif
exit = close > open and nbody > abody / 2

//Arrows
needar = up1 and showar
plotarrow(needar ? 1 : na)

//Trading
lot = strategy.position_size == 0 ? strategy.equity / close * capital / 100 : lot[1]

if up1
    if strategy.position_size < 0
        strategy.close_all()

    strategy.entry("Long", strategy.long, lot, when=(time > timestamp(fromyear, frommonth, fromday, 00, 00) and time < timestamp(toyear, tomonth, today, 23, 59)))

if time > timestamp(toyear, tomonth, today, 23, 59) or exit
strategy.close_all()Published by ChaoZhang on the FMZ strategy square · last modified 2023-10-24. Collected in the Quant Trading Vault. Unvalidated research: re-test with your own data and costs before trusting it.
Build this with AgenKit
A spec is not a trading system. Paste this into your coding agent and AgenKit runs a specialist team — architecture, test-first build, risk gates, review — with paper trading on by default.
/agenkit build a production-grade trading bot with a backtest engine, risk controls and paper trading by default from strategies/Bollinger-Band-Fitting-Strategy.md- npx agenkit install engineering-kit in your project
- Paste the command into your agent and approve each phase
- Get tests, backtest, risk controls and a paper-trading switch
Understand it first
Before you run this, read the lesson behind the idea and how to backtest it honestly. Specs like this one are the survivors of an unknown number of trials; deflate their results accordingly.
Related specs
- Bollinger Band Channel Breakout Trading StrategyPine Script · Breakout · 1d
- Bollinger Bands Dynamic Breakout StrategyPine Script · Breakout · 1h
- Cross boundary Dynamic Range Quantitative Trading Strategy Based on Bollinger BandsPine Script · Breakout · 3h
- EMA and Bollinger Bands Breakout StrategyPine Script · Breakout · 1h
- Momentum Breakout Moving Average StrategyPine Script · Breakout · 1d
- Momentum Breakout Trading Strategy 440964Pine Script · Breakout · 5m