Bollinger Band Short term Reversion Quantitative Strategy Based on Moving Average
This strategy is a short-term reversal trading strategy based on the Bollinger Band indicator. It combines moving averages, standard deviations and Bollinger bands to look for opportunities for reversal trading when…
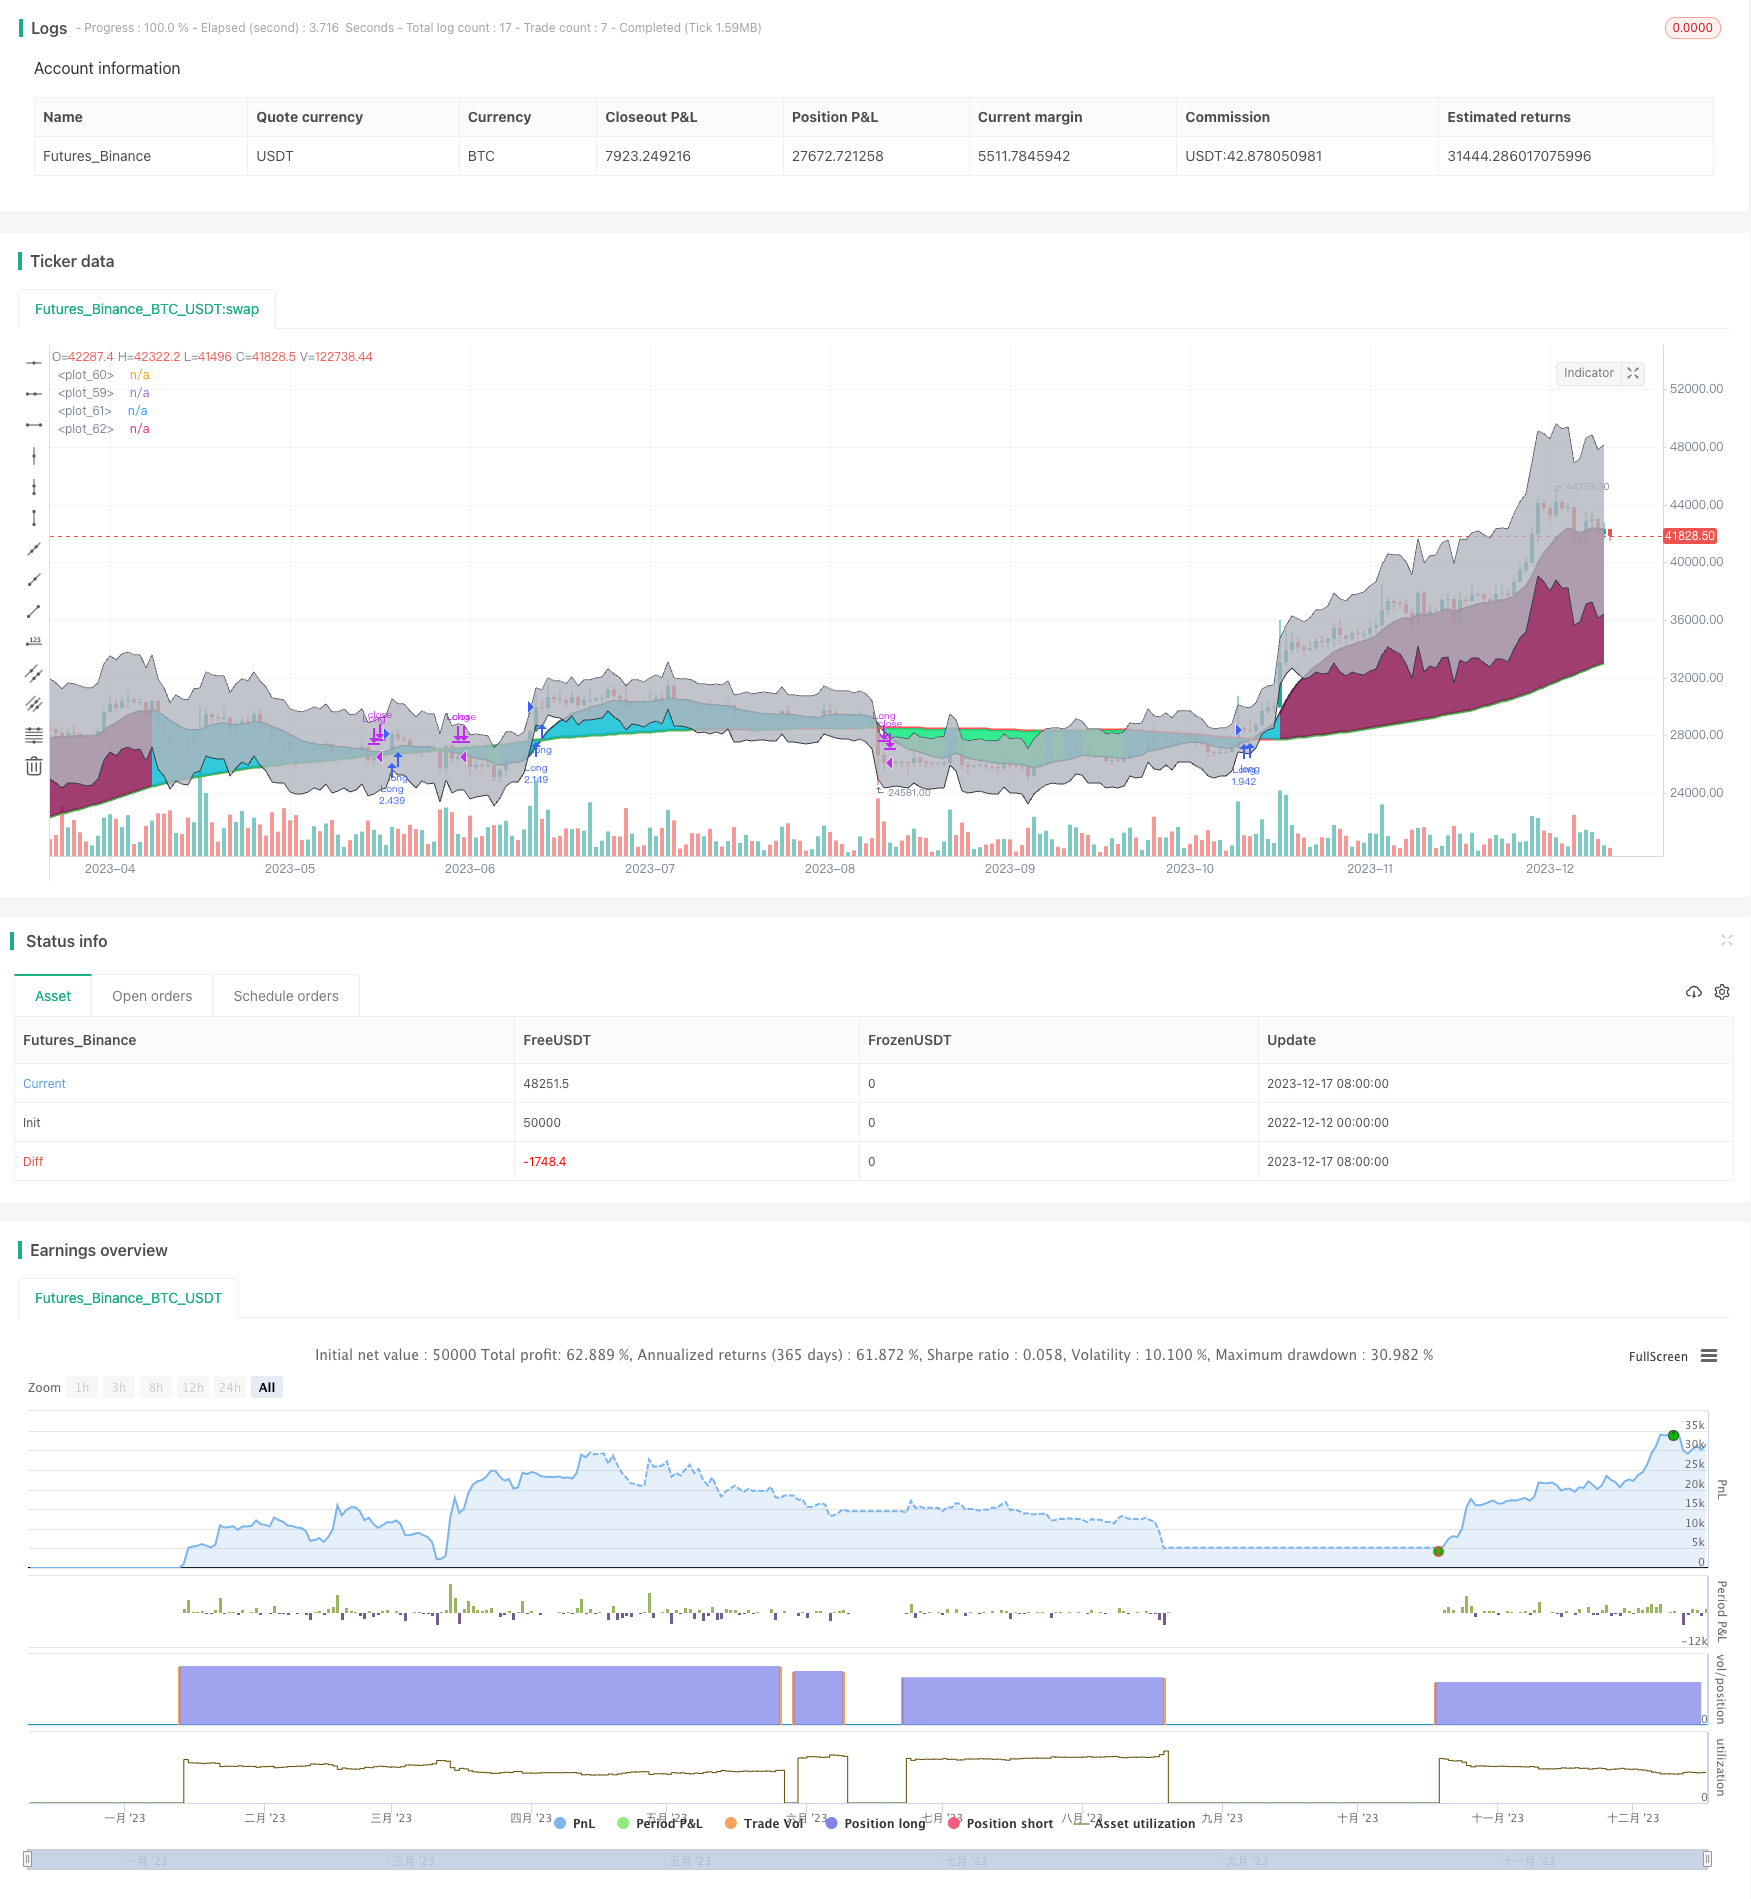
Overview
This strategy is a short-term reversal trading strategy based on the Bollinger Band indicator. It combines moving averages, standard deviations and Bollinger bands to look for opportunities for reversal trading when prices are abnormally dispersed.
Strategy Principle
Calculate moving average and standard deviation. Use sma() function to calculate sma moving average and stdev() function to calculate standard deviation.
Calculate upper and lower rail of Bollinger band according to moving average and standard deviation. The upper rail is price+standard deviation1 and the lower rail is price-standard deviation1.
When the price breaks through the upper or lower rail, it indicates that the price is abnormal. At this time, we determine to do reverse trading.
Specifically, if the price is lower than the lower rail, we go long; if the price is higher than the upper rail, we go short.
Advantage Analysis
Use Bollinger band channel to judge abnormal prices, which provides basis for reverse trading.
Combined with the moving average factor, some noisy trades can be effectively filtered out.
The introduction of standard deviation factor makes the Bollinger band channel more dynamic to better judge abnormal prices.
This strategy has relatively small drawdowns and certain stability.
Risk Analysis
The Bollinger Band indicator cannot completely determine the abnormal situation of prices. There may be false breakouts.
The trading frequency may be too high. It is recommended to adjust the parameters appropriately to control the trading frequency.
The breakout signals of the upper and lower Bollinger bands may last for a long time. Appropriate adjustment of parameters is needed to obtain better reversal effects.
Introduce stop loss appropriately to control risks.
Optimization Directions
Optimize the moving average cycle and standard deviation parameters to obtain a more reasonable Bollinger band channel.
Increase auxiliary factors such as EMA and MACD to filter some signals.
Introduce stop loss and position control mechanisms.
Optimize position size and position control measures.
Summary
This strategy judges abnormal prices through the Bollinger Band indicator and makes reversal trades with moving averages and standard deviation parameters. It has certain stability. We need to further reduce the maximum drawdown of the strategy and improve stability through means such as parameter optimization, introduction of auxiliary factors, stop loss management and position control.
Parameters
| Name | Default | What it controls |
|---|---|---|
| v_input_1 | 2017 | Backtest Start Year |
| v_input_2 | true | Backtest Start Month |
| v_input_3 | true | Backtest Start Day |
| v_input_4 | 2025 | Backtest End Year |
| v_input_5 | true | Backtest End Month |
| v_input_6 | true | Backtest End Day |
| v_input_7 | 100 | Lookback Period For SMA |
| v_input_8 | 10 | Lookback Period For EMA |
| v_input_9 | 6 | Percentage Deviation From SMA to go Long |
| v_input_10 | 20 | Percentage Deviation From SMA to go Short |
| v_input_11 | 4 | The number of bars the EMA must rise/fall |
| v_input_12 | true | Allow Longs? |
| v_input_13 | true | Allow Shorts? |
| v_input_14 | true | Use Stoploss? |
| v_input_15 | 30 | Stop Loss Percentage |
Source Pine Script
/*backtest
start: 2022-12-12 00:00:00
end: 2023-12-18 00:00:00
period: 1d
basePeriod: 1h
exchanges: [{"eid":"Futures_Binance","currency":"BTC_USDT"}]
*/

//@version=3
strategy("BCE Version of EMA, SMA Mean Reversion", overlay=true, default_qty_type=strategy.percent_of_equity, default_qty_value=100)

// Inputs
st_yr_inp = input(defval=2017, title='Backtest Start Year')
st_mn_inp = input(defval=01, title='Backtest Start Month')
st_dy_inp = input(defval=01, title='Backtest Start Day')
en_yr_inp = input(defval=2025, title='Backtest End Year')
en_mn_inp = input(defval=01, title='Backtest End Month')
en_dy_inp = input(defval=01, title='Backtest End Day')
sma_lookback = input(defval=100, title="Lookback Period For SMA")
ema_lookback = input(defval=10, title="Lookback Period For EMA")
long_diff_perc = input(defval=6, title="Percentage Deviation From SMA to go Long")/100
short_diff_perc = input(defval=20, title="Percentage Deviation From SMA to go Short")/100
ema_filter_bars = input(defval=4, title="The number of bars the EMA must rise/fall")
lng_allwd = input(defval=true, title="Allow Longs?")
srt_allwd = input(defval=true, title="Allow Shorts?")
use_stop = input(defval=true, title="Use Stoploss?")
stop_perc = input(defval=30, title="Stop Loss Percentage")/100

// Dates
start = timestamp(st_yr_inp, st_mn_inp, st_dy_inp,00,00)
end = timestamp(en_yr_inp, en_mn_inp, en_dy_inp,00,00)
can_trade = time >= start and time <= end
// Indicators Setup
sma = sma(close, sma_lookback)
ema = ema(close, ema_lookback)

// Strategy Calcuations
close_stdev = stdev(close, sma_lookback)
sd1_upper = close + (close_stdev * 1)
sd1_lower = close - (close_stdev * 1)
close_diff = (close - sma) / sma

// Entries and Exits
longCondition = close > sma and open > sma
if (time >= start and time <= end)
    if (longCondition)
        strategy.entry("Long", strategy.long)
    if use_stop
        stop_price = close * (1 - stop_perc)
        strategy.order("Long Stoploss", false, stop=stop_price)

shortCondition = close < sma and open < sma
if (shortCondition)
//    strategy.entry("Short", strategy.short)
//    if use_stop
//        stop_price = close * (1 + stop_perc)
//        strategy.order("Short Stoploss", true, stop=stop_price)
//if (time >= start)
    strategy.close("Long", when=close < sma and open < sma)
//strategy.cancel("Long Stoploss", when=sma < sma[1])
//    strategy.close("Short", when=close > sma and open > sma)
//strategy.cancel("Short Stoploss", when=close_diff<=0)

// Plotting
sma_col = sma > sma[1] ? green : red
ema_fill = close_diff <= -long_diff_perc ? lime : close_diff >= short_diff_perc ? maroon : aqua
p_sma = plot(sma, color=sma_col, linewidth=3)
p_ema = plot(ema, color=black, linewidth=2)
p_sd1 = plot(sd1_upper, color=black, linewidth=1, transp=85)
p_sd2 = plot(sd1_lower, color=black, linewidth=1, transp=85)
fill(p_sd1, p_sd2, title='STDEV Fill', color=silver, transp=80)
fill(p_sma, p_ema, title='EMA > Mean Percentage', color=ema_fill, transp=80)Published by ChaoZhang on the FMZ strategy square · last modified 2023-12-19. Collected in the Quant Trading Vault. Unvalidated research: re-test with your own data and costs before trusting it.
Build this with AgenKit
A spec is not a trading system. Paste this into your coding agent and AgenKit runs a specialist team — architecture, test-first build, risk gates, review — with paper trading on by default.
/agenkit build a production-grade trading bot with a backtest engine, risk controls and paper trading by default from strategies/Bollinger-Band-Short-term-Reversion-Quantitative-Strategy-Based-on-Moving-Average.md- npx agenkit install engineering-kit in your project
- Paste the command into your agent and approve each phase
- Get tests, backtest, risk controls and a paper-trading switch
Understand it first
Before you run this, read the lesson behind the idea and how to backtest it honestly. Specs like this one are the survivors of an unknown number of trials; deflate their results accordingly.
Related specs
- Momentum Breakout Moving Average StrategyPine Script · Breakout · 1d
- Momentum Breakout Trading Strategy 440964Pine Script · Breakout · 5m
- Momentum Breakout Trading StrategyPine Script · Breakout · 4h
- Moving Average Crossover and Upper Rail Breakthrough Impulse StrategyPine Script · Breakout · 1m
- Multiple Moving Average Bollinger Bands StrategyPine Script · Breakout · 1d
- Quadruple Crossing StrategyPine Script · Breakout · 1h