Bollinger Bands and RSI Combination Strategy 440426
This strategy combines Bollinger Bands and Relative Strength Index (RSI) to identify opportunities when Bollinger Bands are squeezing and RSI is rising, with trailing stop loss to control risks.
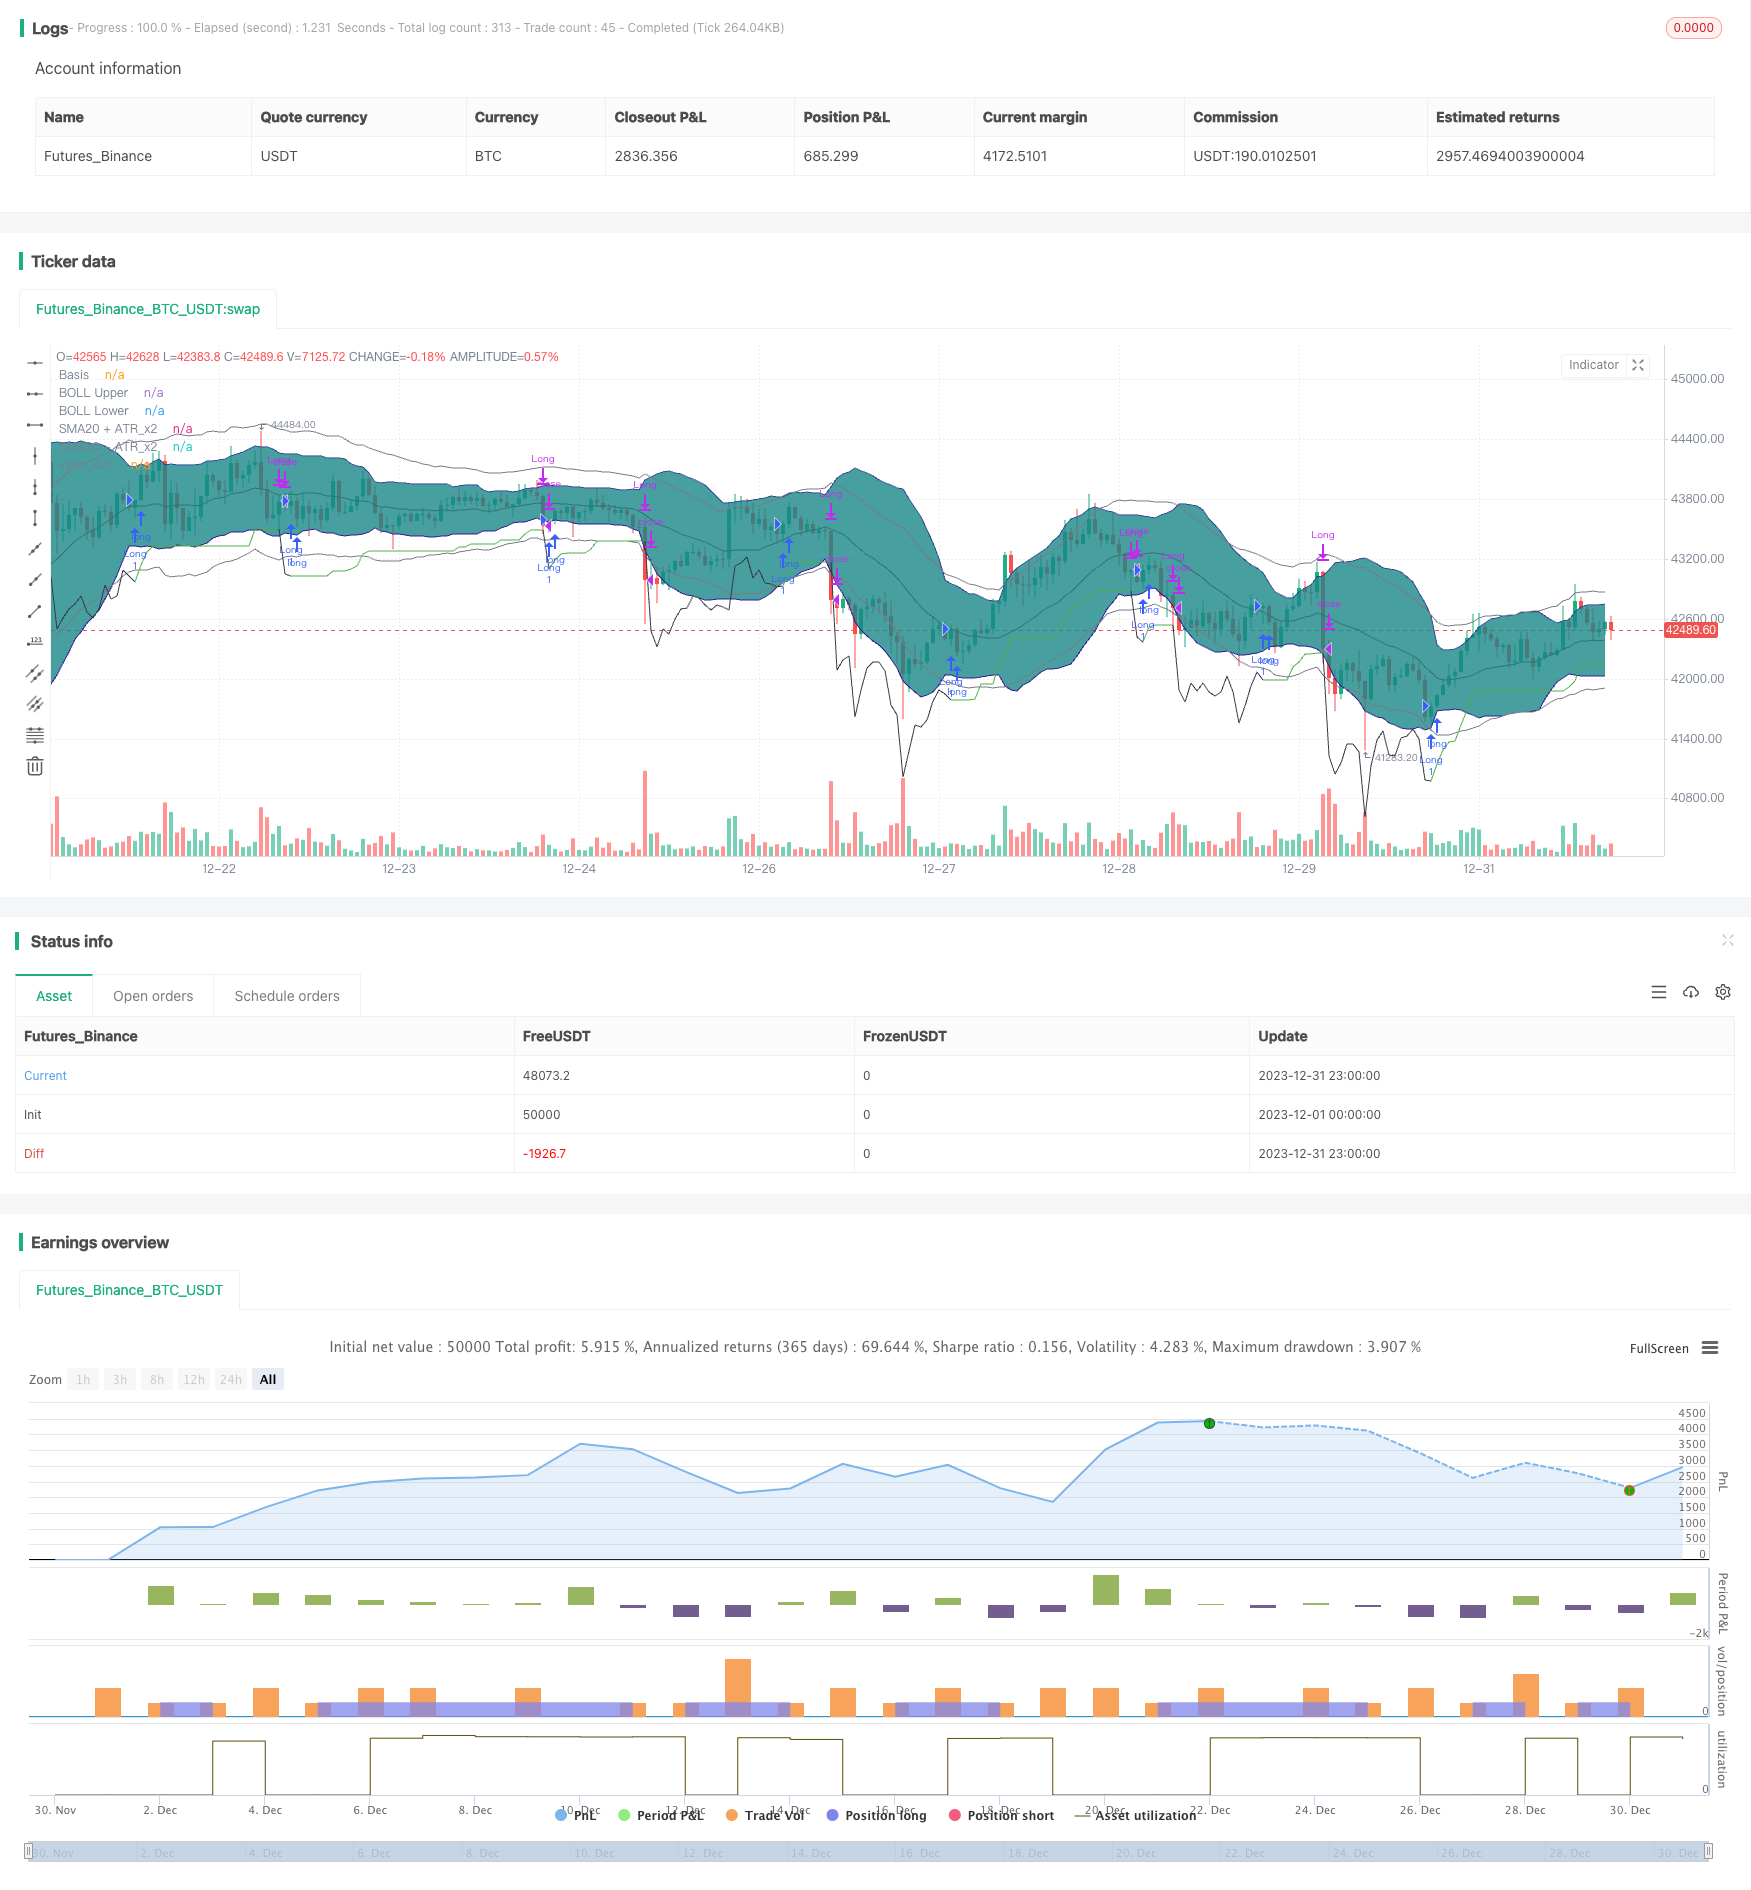
Overview
This strategy combines Bollinger Bands and Relative Strength Index (RSI) to identify opportunities when Bollinger Bands are squeezing and RSI is rising, with trailing stop loss to control risks.
Strategy Logic
The core logic of this strategy is to identify Bollinger Bands squeeze and predict price breakout when RSI is in uptrend. Specifically, when 20-period BB middle band standard deviation is less than ATR*2, we determine BB squeeze happening; meanwhile, if both 10 and 14 period RSI are rising, we predict prices may break above BB upper band soon and go long.
After entering the market, we use ATR safety distance + adaptive stop loss to lock profit and manage risks. Positions will be closed when price hits stop loss or RSI becomes overbought (14-period RSI above 70 and 10-period RSI exceeds 14).
Advantage Analysis
The biggest advantage of this strategy is to identify consolidation period with BB squeeze and predict breakout direction with RSI. Also, using adaptive stop loss based on market volatility rather than fixed stop loss can better lock profit while controlling risk.
Risk Analysis
The major risk of this strategy is misidentification of BB squeeze and RSI uptrend, which may lead to false breakout. Besides, adaptive stop loss may fail to close positions timely during high volatility. Improving stop loss methods like curve stop loss can mitigate this risk.
Optimization Guidelines
This strategy can be further optimized in the following aspects:
Improve BB parameters to identify squeeze more accurately
Test different values for RSI periods
Examine other stop loss techniques like curve SL or back-looking SL
Adjust parameters based on symbol characteristics
Conclusion
This strategy leverages the complementarity of BB and RSI to achieve good risk-adjusted returns. Further optimizations on aspects like stop loss and parameter tuning can make it fit better for different trading instruments.
Parameters
| Name | Default | What it controls |
|---|---|---|
| v_input_1 | timestamp(01 Apr 2016 13:30 +0000) | Backtest Start Time |
| v_input_2 | false | Define backtest end-time (If false, will test up to most recent candle) |
| v_input_3 | timestamp(01 May 2021 19:30 +0000) | Backtest End Time (if checked above) |
| v_input_4 | true | No. of candles to lookback when determining ATR is decreasing |
| v_input_5 | 70 | [Exit] RSI(14) value considered as overbought |
Source Pine Script
/*backtest
start: 2023-12-01 00:00:00
end: 2023-12-31 23:59:59
period: 1h
basePeriod: 15m
exchanges: [{"eid":"Futures_Binance","currency":"BTC_USDT"}]
*/

// This source code is subject to the terms of the Mozilla Public License 2.0 at https://mozilla.org/MPL/2.0/
// © DojiEmoji
//

//@version=4
strategy("[KL] BOLL + RSI Strategy",overlay=true,pyramiding=1)

// Timeframe {
backtest_timeframe_start = input(defval = timestamp("01 Apr 2016 13:30 +0000"), title = "Backtest Start Time", type = input.time)
USE_ENDTIME = input(false,title="Define backtest end-time (If false, will test up to most recent candle)")
backtest_timeframe_end = input(defval = timestamp("01 May 2021 19:30 +0000"), title = "Backtest End Time (if checked above)", type = input.time)
within_timeframe = true
// }

// Bollinger bands (sdv=2, len=20) {
BOLL_length = 20, BOLL_src = close, SMA20 = sma(BOLL_src, BOLL_length), BOLL_sDEV_x2 = 2 * stdev(BOLL_src, BOLL_length)
BOLL_upper = SMA20 + BOLL_sDEV_x2, BOLL_lower = SMA20 - BOLL_sDEV_x2
plot(SMA20, "Basis", color=#872323, offset = 0)
BOLL_p1 = plot(BOLL_upper, "BOLL Upper", color=color.navy, offset = 0, transp=50)
BOLL_p2 = plot(BOLL_lower, "BOLL Lower", color=color.navy, offset = 0, transp=50)
fill(BOLL_p1, BOLL_p2, title = "Background", color=#198787, transp=85)
// }

// Volatility Indicators {
ATR_x2 = atr(BOLL_length) * 2 // multiplier aligns with BOLL
avg_atr = sma(ATR_x2, input(1,title="No. of candles to lookback when determining ATR is decreasing"))
plot(SMA20+ATR_x2, "SMA20 + ATR_x2", color=color.gray, offset = 0, transp=50)
plot(SMA20-ATR_x2, "SMA20 - ATR_x2", color=color.gray, offset = 0, transp=50)
plotchar(ATR_x2, "ATR_x2", "", location = location.bottom)
//}

// Trailing stop loss {
TSL_source = low
var entry_price = float(0), var stop_loss_price = float(0)

trail_profit_line_color = color.green
if strategy.position_size == 0 or not within_timeframe
    trail_profit_line_color := color.black
    stop_loss_price := TSL_source - ATR_x2
else if strategy.position_size > 0
    stop_loss_price := max(stop_loss_price, TSL_source - ATR_x2)
plot(stop_loss_price, color=trail_profit_line_color)

if strategy.position_size > 0 and stop_loss_price > stop_loss_price[1]
	alert("Stop loss limit raised", alert.freq_once_per_bar)

// } end of Trailing stop loss

//Buy setup - Long positions {
is_squeezing = ATR_x2 > BOLL_sDEV_x2
if is_squeezing and within_timeframe and not is_squeezing[1]
	alert("BOLL bands are squeezing", alert.freq_once_per_bar)
else if not is_squeezing and within_timeframe and is_squeezing[1]
	alert("BOLL bands stopped squeezing", alert.freq_once_per_bar)

ema_trend = ema(close, 20)

concat(a, b) =>
	concat = a
	if a != ""
		concat := concat + ", "
	concat := concat + b
	concat
// }

// Sell setup - Long position {
rsi_10 = rsi(close, 10), rsi_14 = rsi(close, 14)
overbought = rsi_14 > input(70,title="[Exit] RSI(14) value considered as overbought") and rsi_10 > rsi_14
// } end of Sell setup - Long position

// MAIN: {
if within_timeframe
	entry_msg = ""
	exit_msg = ""

    // ENTRY {
	conf_count = 0
    volat_decr = avg_atr <= avg_atr[1]
	rsi_upslope = rsi_10 > rsi_10[1] and rsi_14 > rsi_14[1]

	if volat_decr and rsi_upslope and is_squeezing and strategy.position_size == 0
		strategy.entry("Long",strategy.long, comment=entry_msg)
		entry_price := close
		stop_loss_price := TSL_source - ATR_x2
	// }

    // EXIT	{
	if strategy.position_size > 0
		bExit = false
		if close <= entry_price and TSL_source <= stop_loss_price
            exit_msg := concat(exit_msg, "stop loss [TSL]")
			bExit := true
        else if close > entry_price and TSL_source <= stop_loss_price
            exit_msg := concat(exit_msg, "take profit [TSL]")
            bExit := true
		else if overbought
			exit_msg := concat(exit_msg, "overbought")
			bExit := true

        strategy.close("Long", when=bExit, comment=exit_msg)
	// }
// }

// CLEAN UP:
if strategy.position_size == 0 and not is_squeezing
	entry_price := 0
	stop_loss_price := float(0)
Published by ChaoZhang on the FMZ strategy square · last modified 2024-01-30. Collected in the Quant Trading Vault. Unvalidated research: re-test with your own data and costs before trusting it.
Build this with AgenKit
A spec is not a trading system. Paste this into your coding agent and AgenKit runs a specialist team — architecture, test-first build, risk gates, review — with paper trading on by default.
/agenkit build a production-grade trading bot with a backtest engine, risk controls and paper trading by default from strategies/Bollinger-Bands-and-RSI-Combination-Strategy-440426.md- npx agenkit install engineering-kit in your project
- Paste the command into your agent and approve each phase
- Get tests, backtest, risk controls and a paper-trading switch
Understand it first
Before you run this, read the lesson behind the idea and how to backtest it honestly. Specs like this one are the survivors of an unknown number of trials; deflate their results accordingly.
Related specs
- EMA and Bollinger Bands Breakout StrategyPine Script · Breakout · 1h
- Momentum Breakout Moving Average StrategyPine Script · Breakout · 1d
- Momentum Breakout Trading Strategy 440964Pine Script · Breakout · 5m
- Moving Average Crossover and Upper Rail Breakthrough Impulse StrategyPine Script · Breakout · 1m
- Enhanced Bollinger Breakout Quantitative Strategy with Momentum Filter Integration SystemPine Script · Breakout · 2d
- Momentum Breakout Strategy 432076Pine Script · Breakout · 1d