Bollinger Bands Breakout Trend Trading Strategy
The Bollinger Bands Trend Breakout trading strategy is designed to identify potential trend reversals at extreme price levels relative to recent volatility. It combines Bollinger Bands as a mean reversion indicator…
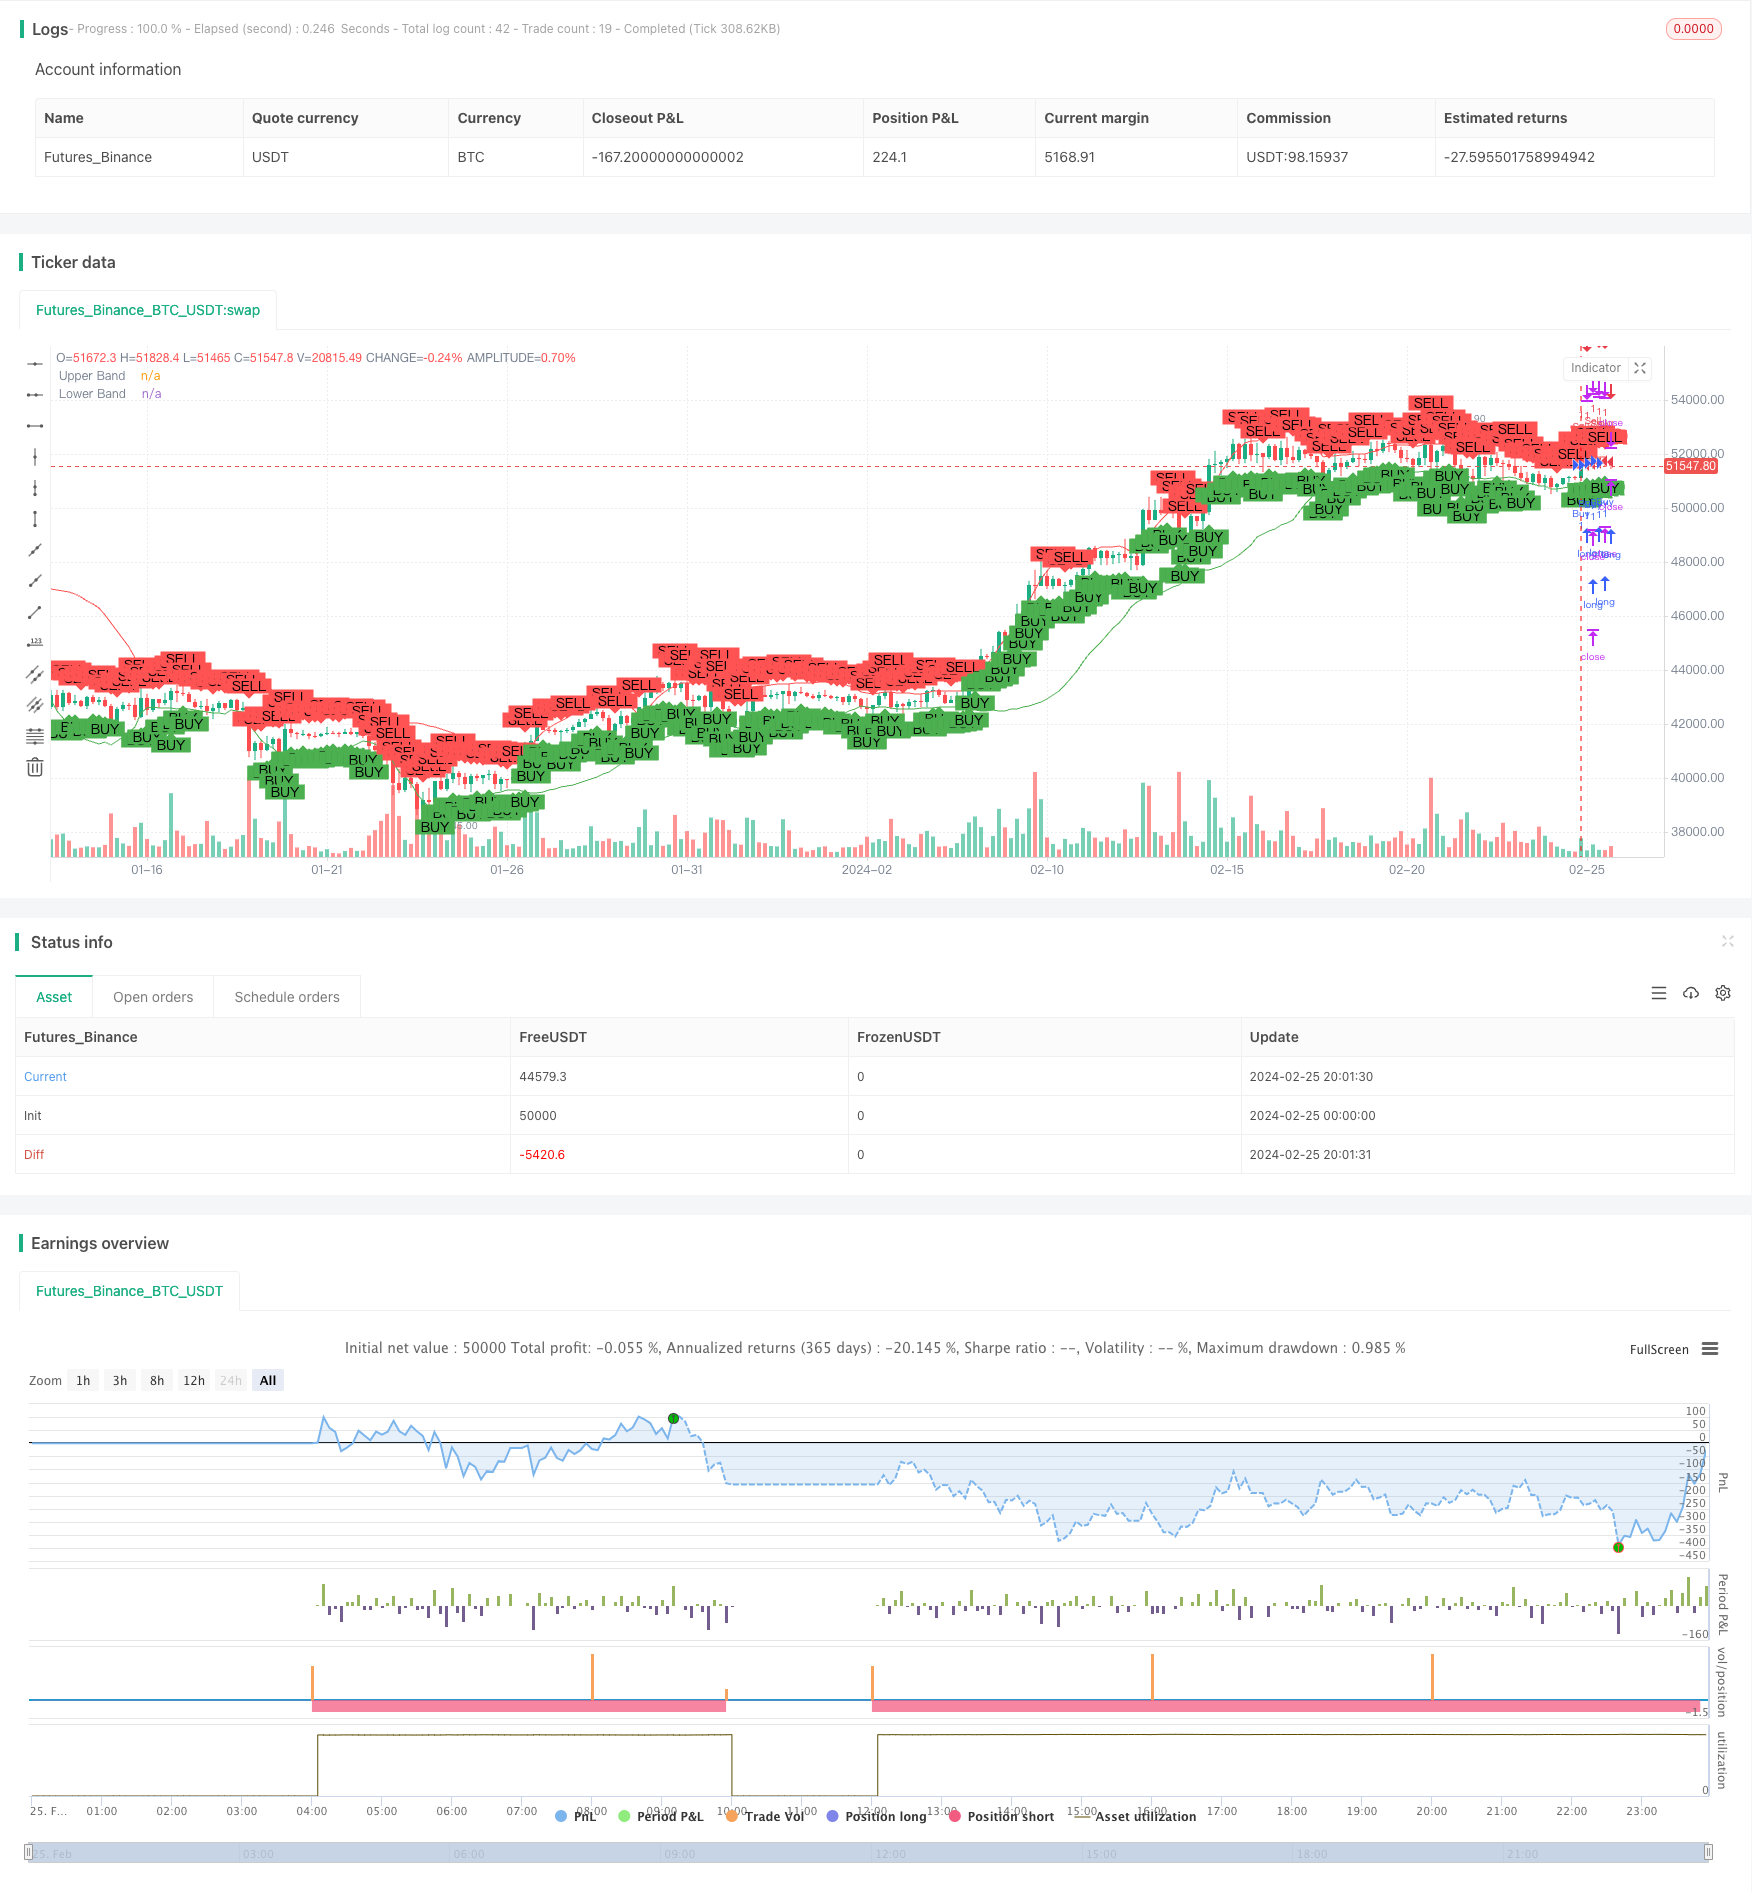
Overview
The Bollinger Bands Trend Breakout trading strategy is designed to identify potential trend reversals at extreme price levels relative to recent volatility. It combines Bollinger Bands as a mean reversion indicator with the logic of breakouts through Bollinger Bands to capture the beginning of a new trend.
Strategy Logic
The core logic of this strategy consists of the following parts:
Bollinger Bands are plotted as 20-period EMA ± 1.5 standard deviations to identify upper and lower bands.
Track when the price closes above or below the Bollinger Band two periods ago to predict potential reversals.
An entry signal is issued when the current candlestick closes above the highest or lowest price on the other side of the Bollinger Bands before breaking out of 2 cycles.
The stop loss position is set slightly outside the highest price or lowest price of the current candlestick.
Determine the take-profit level based on a predefined risk-reward ratio.
Advantage
The main advantages of this strategy are::
Bollinger Bands adapt to changes in market volatility. When volatility is high, the Bollinger Bands expand, reducing the likelihood of false signals.
Aims to capture the trend reversal in advance when the price re-enters the Bollinger Bands.
Adjustable risk-reward ratio input, providing flexible risk management.
Can generate considerable backtesting results in trending markets.
Once coded to the trading platform, automatic entry, stop-loss, and take-profit can be achieved.
Risk
Main risks to consider:
May incur repeated stop-loss losses in sideways markets.
Stop loss is only based on the current candlestick range, so gaps may cause unexpected forced liquidation.
Without extensive backtesting, it is difficult to accurately evaluate the strategy's performance.
Coding errors may cause unexpected orders or trading risks.
These risks can be mitigated by adding filters, conducting comprehensive performance evaluations, and fully testing before live trading.
Optimization idea
The strategy can be enhanced through the following aspects:
Add filters such as volume, RSI or MACD to improve signal accuracy.
Optimize the Bollinger Bands period or multiple of standard deviation for specific varieties.
Set different risk-reward ratios for different markets based on backtest results.
Integrate trailing stop to lock in profit.
Implemented in algorithm form and automatically manage orders.
Careful optimization and selection of varieties will be key to successfully implementing this strategy.
Summary
The Bollinger Bands Trend Breakout Trading Strategy provides a rules-based approach to entering emerging trends. By combining adaptive bands and early breakout signals, it is designed to catch the market when momentum begins to accelerate. However, like all systematic strategies, it requires solid historical analysis and risk management to deal with institutional changes in market cycles.
Parameters
| Name | Default | What it controls |
|---|---|---|
| v_input_1 | 3 | Risk-Reward Ratio |
Source Pine Script
/*backtest
start: 2024-02-25 00:00:00
end: 2024-02-26 00:00:00
period: 4h
basePeriod: 15m
exchanges: [{"eid":"Futures_Binance","currency":"BTC_USDT"}]
*/

// This Pine Script™ code is subject to the terms of the Mozilla Public License 2.0 at https://mozilla.org/MPL/2.0/


//@version=5
strategy("Bollinger Band Strategy with Early Signal (v5)", overlay=true)

// Inputs
length = 20
mult = 1.5
src = close
riskRewardRatio = input(3.0, title="Risk-Reward Ratio")

// Calculating Bollinger Bands
basis = ta.ema(src, length)
dev = mult * ta.stdev(src, length)
upper = basis + dev
lower = basis - dev

// Plotting Bollinger Bands
plot(upper, "Upper Band", color=color.red)
plot(lower, "Lower Band", color=color.green)

// Tracking Two Candles Ago Crossing Bollinger Bands
var float twoCandlesAgoUpperCrossLow = na
var float twoCandlesAgoLowerCrossHigh = na

if (close[2] > upper[2])
    twoCandlesAgoUpperCrossLow := low[2]
if (close[2] < lower[2])
    twoCandlesAgoLowerCrossHigh := high[2]

// Entry Conditions
longCondition = (not na(twoCandlesAgoLowerCrossHigh)) and (high > twoCandlesAgoLowerCrossHigh)
shortCondition = (not na(twoCandlesAgoUpperCrossLow)) and (low < twoCandlesAgoUpperCrossLow)

// Plotting Entry Points
plotshape(longCondition, title="Buy Signal", location=location.belowbar, color=color.green, style=shape.labelup, text="BUY")
plotshape(shortCondition, title="Sell Signal", location=location.abovebar, color=color.red, style=shape.labeldown, text="SELL")

// Strategy Execution
if (longCondition)
    stopLoss = low - (high - low) * 0.05
    takeProfit = close + (close - stopLoss) * riskRewardRatio
    strategy.entry("Buy", strategy.long)
    strategy.exit("Exit Buy", "Buy", stop=stopLoss, limit=takeProfit)

if (shortCondition)
    stopLoss = high + (high - low) * 0.05
    takeProfit = close - (stopLoss - close) * riskRewardRatio
    strategy.entry("Sell", strategy.short)
    strategy.exit("Exit Sell", "Sell", stop=stopLoss, limit=takeProfit)
Published by ChaoZhang on the FMZ strategy square · last modified 2024-02-27. Collected in the Quant Trading Vault. Unvalidated research: re-test with your own data and costs before trusting it.
Build this with AgenKit
A spec is not a trading system. Paste this into your coding agent and AgenKit runs a specialist team — architecture, test-first build, risk gates, review — with paper trading on by default.
/agenkit build a production-grade trading bot with a backtest engine, risk controls and paper trading by default from strategies/Bollinger-Bands-Breakout-Trend-Trading-Strategy.md- npx agenkit install engineering-kit in your project
- Paste the command into your agent and approve each phase
- Get tests, backtest, risk controls and a paper-trading switch
Understand it first
Before you run this, read the lesson behind the idea and how to backtest it honestly. Specs like this one are the survivors of an unknown number of trials; deflate their results accordingly.
Related specs
- Momentum Breakout Moving Average StrategyPine Script · Breakout · 1d
- Momentum Breakout Trading Strategy 440964Pine Script · Breakout · 5m
- Moving Average Crossover and Upper Rail Breakthrough Impulse StrategyPine Script · Breakout · 1m
- Quadruple Crossing StrategyPine Script · Breakout · 1h
- Double Strong Indicators StrategyPine Script · Breakout · 1d
- Moving Average Breakout and Bollinger Band Breakout StrategyPine Script · Breakout · 4h