Bollinger Momentum Breakout Strategy
This strategy uses Bollinger Bands to determine market trend direction combined with RSI indicator to filter bullish signals, implementing momentum breakout operations to chase rises and kill falls. The basic idea…
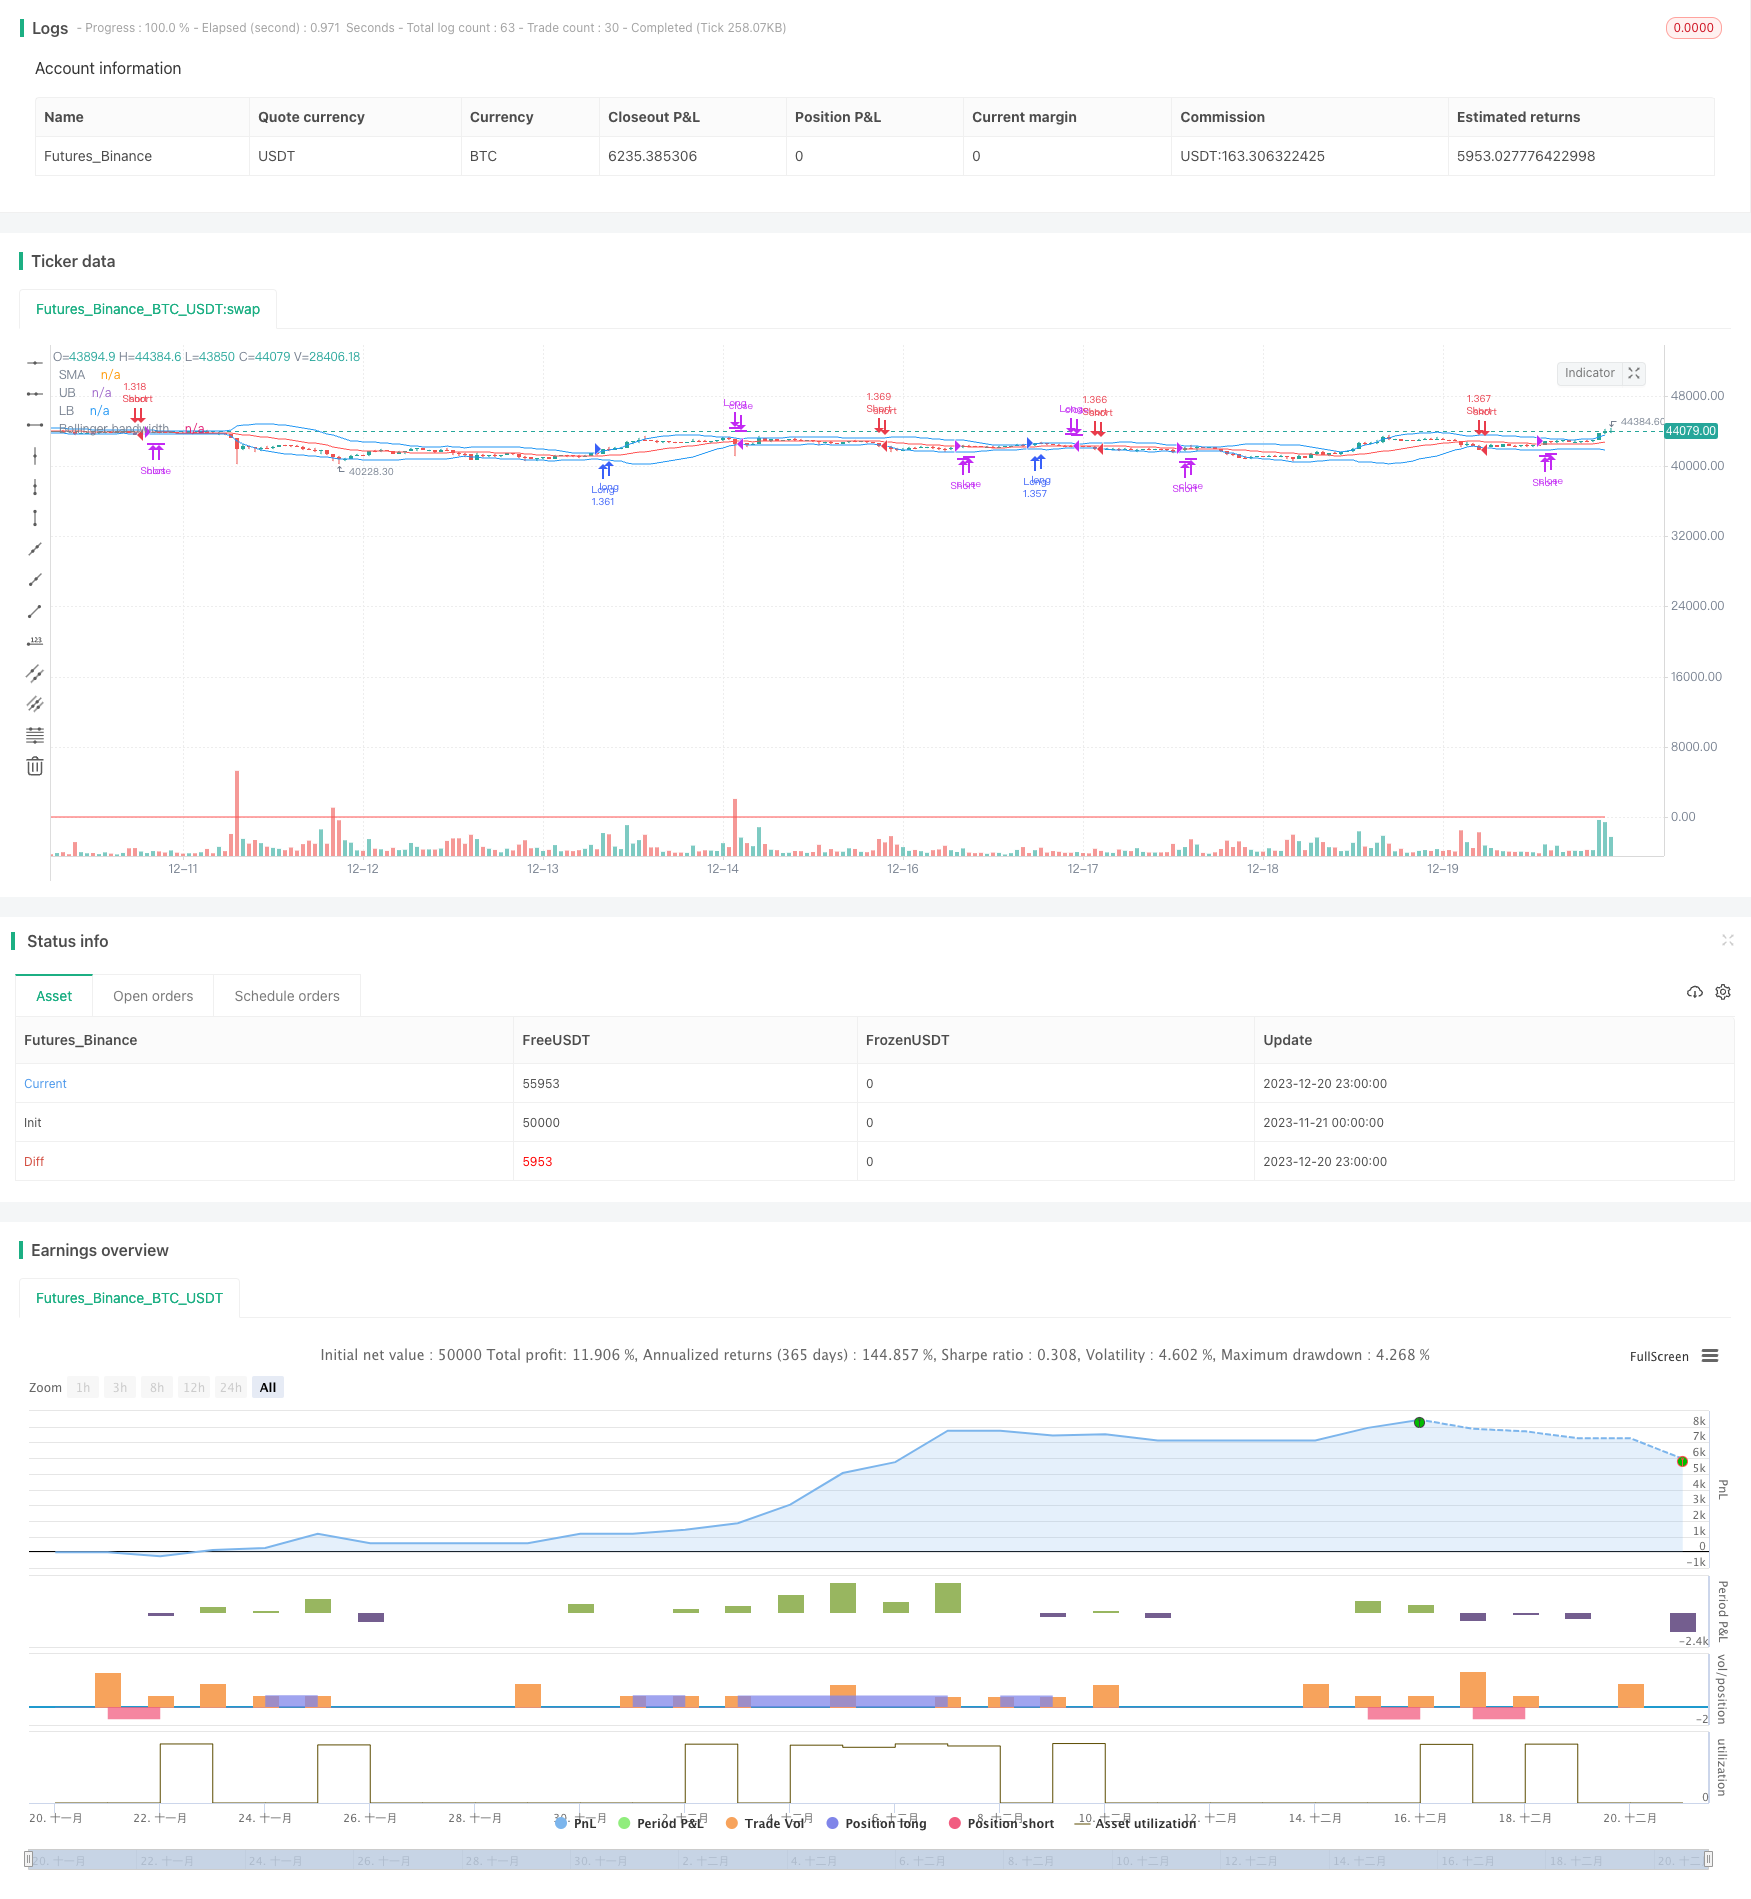
Overview
This strategy uses Bollinger Bands to determine market trend direction combined with RSI indicator to filter bullish signals, implementing momentum breakout operations to chase rises and kill falls. The basic idea is: when the price breaks through the Bollinger upper band, go long; when the price breaks through the Bollinger lower band, go short.
Strategy Principle
When Bollinger Bands indicator determines the price breaks through the upper band, it indicates the market enters a bullish trend. At this time, use RSI indicator for filtration. Generate buy signal when RSI is greater than 60. When BB indicator determines the price breaks through the lower band, it indicates the market enters a bearish trend. At this time, use RSI indicator for filtration. Generate sell signal when RSI is less than 40.
Set stop loss after entering the market to avoid further losses.
Exit criteria is closing long position when price breaks back below BB middle band, and closing short position when price breaks back above BB middle band.
Advantage Analysis
Bollinger Bands indicator can determine major market trend and capture inflection points. Combining with RSI filter can improve signal reliability.
Chase rises and kill falls operation can achieve excess returns.
Setting stop loss can control risks.
Risk Analysis
BB indicator is not effective in judging sideways markets, which can generate false signals.
Improper stop loss setting may lead to further losses.
High trading frequency is impacted by trading costs and slippage.
Breakout signals need timely update, otherwise best entry opportunities may be missed.
Optimization Directions
Combine with other indicators to judge reliability of BB breakout signals, such as volume, moving averages etc.
Dynamically adjust BB parameters to optimize indicator performance.
Optimize stop loss position, such as trailing stop loss, percentage stop loss to reduce unnecessary losses.
Summary
The strategy has a clear logic to determine market trend through BB and filter signals with RSI for momentum trend chasing. It features high operation frequency, fast profit/loss cycles, more suitable for traders pursuing excess returns. However, high trading frequency also increases transaction costs and requires strict capital management and emotional control. Further performance and stability improvement can be achieved through parameter optimization and stop loss optimization.
Parameters
| Name | Default | What it controls |
|---|---|---|
| v_input_1 | 20 | Period |
| v_input_2 | 2 | Standard Deviation |
Source Pine Script
/*backtest
start: 2023-11-21 00:00:00
end: 2023-12-21 00:00:00
period: 1h
basePeriod: 15m
exchanges: [{"eid":"Futures_Binance","currency":"BTC_USDT"}]
*/


//@version=4
strategy(title="Bollinger Band Breakout", shorttitle = "BB-Stoxguru",default_qty_type = strategy.percent_of_equity,default_qty_value = 100, overlay=true)
source = close
start = timestamp (2007, 1,1,0,0)
end = timestamp (2021,11,05,0,0)
stop_level = (high[1]-low[1])
profit_level = (high[1]-low[1])
length = input(20, minval=1, title = "Period") //Length of the Bollinger Band
mult = input(2, minval=0.001, maxval=50, title = "Standard Deviation")

basis = sma(source, length)
dev = mult * stdev(source, length)

upper = basis + dev
lower = basis - dev
band=upper-lower
stop_loss=low-atr(14)
if time >= start
// and time < end
    strategy.entry("Long", strategy.long, when = crossover(source, upper) and rsi(close,14)>=60 and rsi(close,14)<=70)
    // strategy.entry("Long", strategy.long, when = crossover(source, upper) and rsi(close,14)>60 and band<200)
    // strategy.exit("SL", "Long", stop=stop_loss)
    strategy.close(id="Long", when=crossunder(close, basis))
    strategy.entry("Short", strategy.short, when = crossunder(source, lower) and rsi(close,14)<=40 and rsi(close,14)>=35)
    strategy.close(id="Short", when=crossover(close, basis))
    // strategy.entry("Short", strategy.short, when = crossunder(source, lower) and rsi(close,14)<40 and band<200)
    // plot(upper-lower, color=color.purple,title= "DIFF",style=plot.style_linebr)
plot(basis, color=color.red,title= "SMA")
p1 = plot(upper, color=color.blue,title= "UB")
p2 = plot(lower, color=color.blue,title= "LB")
// fill(p1, p2)
BW = ((upper - lower)) / basis * 100

plot(BW, title="Bollinger bandwidth", color=color.red)
Published by ChaoZhang on the FMZ strategy square · last modified 2023-12-22. Collected in the Quant Trading Vault. Unvalidated research: re-test with your own data and costs before trusting it.
Build this with AgenKit
A spec is not a trading system. Paste this into your coding agent and AgenKit runs a specialist team — architecture, test-first build, risk gates, review — with paper trading on by default.
/agenkit build a production-grade trading bot with a backtest engine, risk controls and paper trading by default from strategies/Bollinger-Momentum-Breakout-Strategy.md- npx agenkit install engineering-kit in your project
- Paste the command into your agent and approve each phase
- Get tests, backtest, risk controls and a paper-trading switch
Understand it first
Before you run this, read the lesson behind the idea and how to backtest it honestly. Specs like this one are the survivors of an unknown number of trials; deflate their results accordingly.
Related specs
- EMA and Bollinger Bands Breakout StrategyPine Script · Breakout · 1h
- Momentum Breakout Moving Average StrategyPine Script · Breakout · 1d
- Momentum Breakout Trading Strategy 440964Pine Script · Breakout · 5m
- Moving Average Crossover and Upper Rail Breakthrough Impulse StrategyPine Script · Breakout · 1m
- Bollinger Bands Breakout Strategy 448080Pine Script · Breakout · 1h
- Enhanced Bollinger Breakout Quantitative Strategy with Momentum Filter Integration SystemPine Script · Breakout · 2d