Connecticut Turtle System
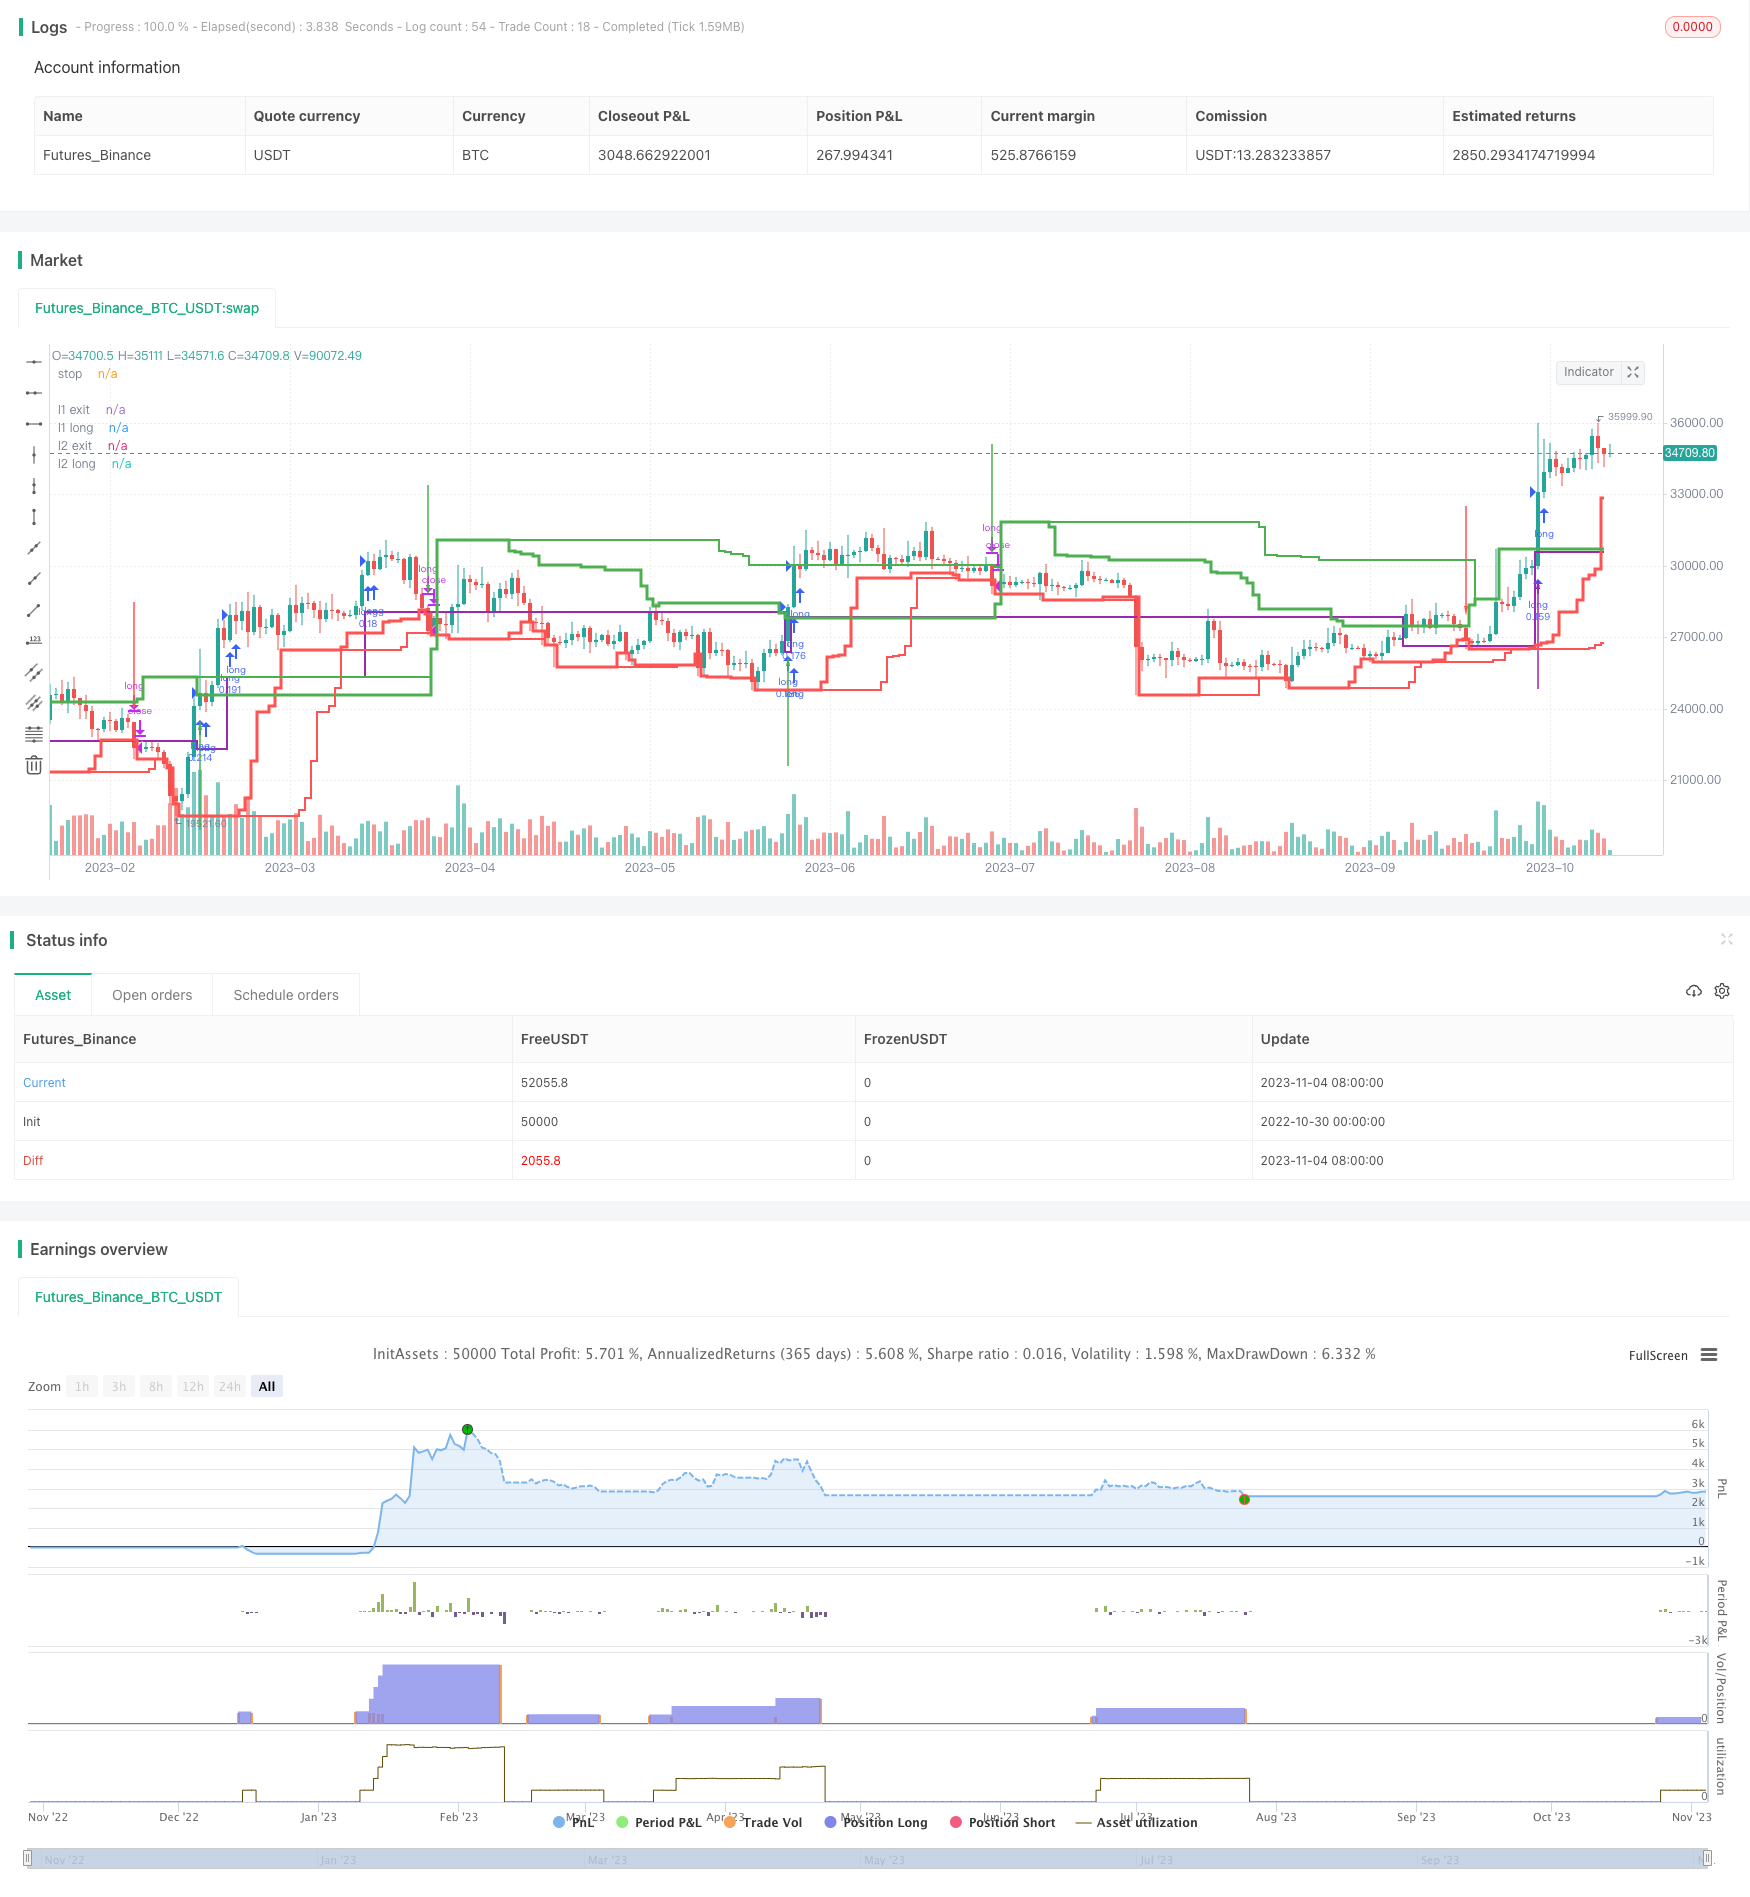
This strategy is based on the famous turtle trading system and tries to follow the original rules as much as possible. It is a trend following system that generates entry and exit signals using double moving averages.
Overview
This strategy is based on the famous turtle trading system and tries to follow the original rules as much as possible. It is a trend following system that generates entry and exit signals using double moving averages.
Trading Logic
- N1-day high (default 20 days) and N2-day high (default 55 days) are used to build double moving averages.
- N3-day low (default 10 days) and N4-day low (default 20 days) are used to build double moving averages.
- Go long when close price exceeds N2-day high. Close position when close price falls below N4-day low.
- Pyramid up to 5 additional long positions, each 1 x ATR (default 1) above previous entry price.
- Set a fixed stop loss at N x ATR (default 2) below entry price.
- Only allow new entry after previous trade is a winner.
Advantage Analysis
The advantages of this strategy:
- Follows trend trading principle and captures mid-to-long term trends.
- Double MAs form filters, avoiding excessive trading during consolidation.
- The stop loss setting is reasonable, avoiding too wide or too narrow.
- Parameters are configurable for adjusting risk-reward profile.
- Allow pyramiding for more profit during strong trends.
Risk Analysis
There are also some risks:
- Unable to exit timely when trend reverses, leading to large losses.
- Too much pyramiding increases trading frequency.
- Improper parameter tuning makes the system too aggressive or too conservative.
- Backtest bias, real performance may underperform.
Risks can be reduced by:
- Adding reversal signals like MACD divergence to cut losses.
- Robust parameter optimization.
- Adding position sizing to lower position size after big losses.
Improvement Areas
The strategy can be improved in the following ways:
- Add short trade logic to profit from falling prices.
- Add stop loss optimization to adjust stops based on price action.
- Add position sizing module to optimize pyramid size.
- Incorporate trend strength index like ADX to avoid false signals.
- Optimize parameters for smoother returns.
- Consider real trading costs like slippage and commissions.
Conclusion
The strategy profits by following the trend and has good backtest results. But real performance needs to be validated. Further optimization on parameter robustness, stop loss and position sizing is needed before applying it in live trading. Overall it has sound logic and much potential for improvement.
Parameters
| Name | Default | What it controls |
|---|---|---|
| v_input_1 | 2 | Stop N |
| v_input_2 | true | Pyramid N |
| v_input_3 | 20 | L1 Long |
| v_input_4 | 55 | L2 Long |
| v_input_5 | 10 | L1 Long Exit |
| v_input_6 | 20 | L2 Long Exit |
| v_input_7 | 2000 | From Year |
| v_input_8 | true | From Month |
| v_input_9 | true | From Day |
| v_input_10 | 9999 | To Year |
| v_input_11 | true | To Month |
| v_input_12 | true | To Day |
Source Pine Script
/*backtest
start: 2022-10-30 00:00:00
end: 2023-11-05 00:00:00
period: 1d
basePeriod: 1h
exchanges: [{"eid":"Futures_Binance","currency":"BTC_USDT"}]
*/

//@version=4
strategy(title="Turtle", overlay=true, initial_capital=100000, default_qty_type=strategy.percent_of_equity, default_qty_value=10, commission_type=strategy.commission.percent, commission_value=0.1, pyramiding=5)

stopInput = input(2.0, "Stop N", step=.5)
pyramidInput = input(1, "Pyramid N", step=.5)
l1LongInput = input(20, "L1 Long", minval=5)
l2LongInput = input(55, "L2 Long", minval=5)
l1LongExitInput = input (10, "L1 Long Exit", minval=5)
l2LongExitInput = input (20, "L2 Long Exit", minval=5)

FromYear = input(2000, "From Year", minval=1900),   FromMonth = input(1, "From Month", minval=1, maxval=12),    FromDay = input(1, "From Day", minval=1, maxval=31)
ToYear = input(9999, "To Year", minval=1900),       ToMonth = input(1, "To Month", minval=1, maxval=12),        ToDay = input(1, "To Day", minval=1, maxval=31)
FromDate = timestamp(FromYear, FromMonth, FromDay, 00, 00),     ToDate = timestamp(ToYear, ToMonth, ToDay, 23, 59)
TradeDateIsAllowed() => time >= FromDate and time <= ToDate
l1Long = highest(l1LongInput)
l1LongExit = lowest(l1LongExitInput)
l2Long = highest(l2LongInput)
l2LongExit = lowest(l2LongExitInput)

//
// ADX, +-DI
// https://www.tradingview.com/script/rlMJ05yl-ADX-and-DI-pine-script-3-0/
//
len = 14
th = 20
TrueRange = max(max(high-low, abs(high-nz(close[1]))), abs(low-nz(close[1])))
DirectionalMovementPlus = high-nz(high[1]) > nz(low[1])-low ? max(high-nz(high[1]), 0): 0
DirectionalMovementMinus = nz(low[1])-low > high-nz(high[1]) ? max(nz(low[1])-low, 0): 0
SmoothedTrueRange = 0.0
SmoothedTrueRange := nz(SmoothedTrueRange[1]) - (nz(SmoothedTrueRange[1])/len) + TrueRange
SmoothedDirectionalMovementPlus = 0.0
SmoothedDirectionalMovementPlus := nz(SmoothedDirectionalMovementPlus[1]) - (nz(SmoothedDirectionalMovementPlus[1])/len) + DirectionalMovementPlus
SmoothedDirectionalMovementMinus = 0.0
SmoothedDirectionalMovementMinus := nz(SmoothedDirectionalMovementMinus[1]) - (nz(SmoothedDirectionalMovementMinus[1])/len) + DirectionalMovementMinus

DIPlus = SmoothedDirectionalMovementPlus / SmoothedTrueRange * 100
DIMinus = SmoothedDirectionalMovementMinus / SmoothedTrueRange * 100
DX = abs(DIPlus-DIMinus) / (DIPlus+DIMinus)*100
ADX = sma(DX, len)

// Back to Turtle

filter = true // not (DIPlus < ADX and DIMinus < ADX) and DIPlus > DIMinus
var win = false
var totalPrice = 0.0
var buyPrice = 0.0
var avgPrice = 0.0
var nextBuyPrice = 0.0
var stopPrice = 0.0
var totalBuys = 0

var bool inBuy = false
var float l1LongPlot = highest(l1LongInput)
var float l2LongPlot = highest(l2LongInput)

n = atr(14)

var mode = 'L1'
string longLevel = na

if not inBuy
    l1LongPlot := highest(l1LongInput)[1]
    l2LongPlot := highest(l2LongInput)[1]

    if (close > l2Long[1] and filter)
        mode := 'L2'
        if TradeDateIsAllowed()
            strategy.close_all()
            strategy.entry("long", strategy.long, comment="L2")
            longLevel := 'L2'

        win := false
        buyPrice := close
        totalBuys := 1
        totalPrice := buyPrice
        avgPrice := buyPrice
        stopPrice := close-(stopInput*n)
        nextBuyPrice := high+(pyramidInput*n)
        inBuy := true
    else
        if (close > l1Long[1] and filter)
            mode := 'L1'
            if not win
                if TradeDateIsAllowed()
                    strategy.close_all()
                    strategy.entry("long", strategy.long, comment="L1")
                    longLevel := 'L1'
            win := false
            buyPrice := close
            totalBuys := 1
            totalPrice := buyPrice
            avgPrice := buyPrice
            stopPrice := close-(stopInput*n)
            nextBuyPrice := high+(pyramidInput*n)
            inBuy := true
        else
            inBuy := false

else
    l1LongPlot := l1LongPlot[1]
    l2LongPlot := l2LongPlot[1]

    if close > nextBuyPrice and TradeDateIsAllowed() and totalBuys < 6
        strategy.entry("long", strategy.long, comment="LP")
        longLevel := 'P'
        stopPrice := close-(stopInput*n)
        nextBuyPrice := high+(pyramidInput*n)
        totalBuys := totalBuys + 1
        totalPrice := totalPrice + buyPrice
        avgPrice := totalPrice / totalBuys

    if (close < stopPrice)
        inBuy := false
        if TradeDateIsAllowed()
            if (close >= avgPrice)
                longLevel := 'SG'
            else
                longLevel := 'SR'
            strategy.close("long", strategy.long)
        win := false
        buyPrice := 0
        avgPrice := 0
    else
        if (mode == 'L1' and close > l2Long[1] and filter)
            if win
                inBuy := true
                win := false
                mode := 'L2'
                if TradeDateIsAllowed()
                    strategy.close_all()
                    longLevel := 'L2'
                    strategy.entry("long", strategy.long, comment="L2")
                buyPrice := close
                totalBuys := 1
                totalPrice := buyPrice
                avgPrice := buyPrice
                stopPrice := close-(stopInput*n)
                nextBuyPrice := close+(pyramidInput*n)
        else
            if (close < l1LongExit[1] or close < l2LongExit[1])
                inBuy := false
                if TradeDateIsAllowed()
                    strategy.close("long", strategy.long)
                if close < avgPrice
                    longLevel := 'SR'
                    win := false
                else
                    longLevel := 'SG'
                    win := true
                buyPrice := 0

plot(l1LongPlot, title="l1 long", linewidth=3, style=plot.style_stepline, color=color.green)
plot(l1LongExit[1], title="l1 exit", linewidth=3, style=plot.style_stepline, color=color.red)

plot(l2LongPlot, title="l2 long", linewidth=2, style=plot.style_stepline, color=color.green)
plot(l2LongExit[1], title="l2 exit", linewidth=2, style=plot.style_stepline, color=color.red)

plot(stopPrice, title="stop", linewidth=2, style=plot.style_stepline, color=color.purple)

plotarrow(longLevel == 'L1' ? 1 : 0, colordown=color.black, colorup=color.green, transp=40)
plotarrow(longLevel == 'L2' ? 1 : 0, colordown=color.black, colorup=color.purple, transp=40)
plotarrow(longLevel == 'SR' ? -1 : 0, colordown=color.red, colorup=color.purple, transp=40)
plotarrow(longLevel == 'SG' ? -1 : 0, colordown=color.green, colorup=color.purple, transp=40)
Published by ChaoZhang on the FMZ strategy square · last modified 2023-11-06. Collected in the Quant Trading Vault. Unvalidated research: re-test with your own data and costs before trusting it.
Build this with AgenKit
A spec is not a trading system. Paste this into your coding agent and AgenKit runs a specialist team — architecture, test-first build, risk gates, review — with paper trading on by default.
/agenkit build a production-grade trading bot with a backtest engine, risk controls and paper trading by default from strategies/Connecticut-Turtle-System.md- npx agenkit install engineering-kit in your project
- Paste the command into your agent and approve each phase
- Get tests, backtest, risk controls and a paper-trading switch
Understand it first
Before you run this, read the lesson behind the idea and how to backtest it honestly. Specs like this one are the survivors of an unknown number of trials; deflate their results accordingly.
Related specs
- Dual Breakout Volatility Channel StrategyPine Script · Breakout · 1h
- Momentum Breakout Trading Strategy 440964Pine Script · Breakout · 5m
- Moving Average Crossover and Upper Rail Breakthrough Impulse StrategyPine Script · Breakout · 1m
- Quantitative Trading Strategy Based on Ichimoku with Multiple SignalsPine Script · Breakout · 1h
- Volatility Breakthrough StrategyPine Script · Breakout · 10m
- Momentum Breakout Intraday Trading StrategyPine Script · Breakout · 5m