Strategy vault / Trend following
Crossing Moving Average Trend Tracking Strategy
This strategy judges the price trend by calculating the cross of double moving averages, and issues buy and sell signals with certain parameter restrictions. It mainly consists of three parts: first, judge the price…
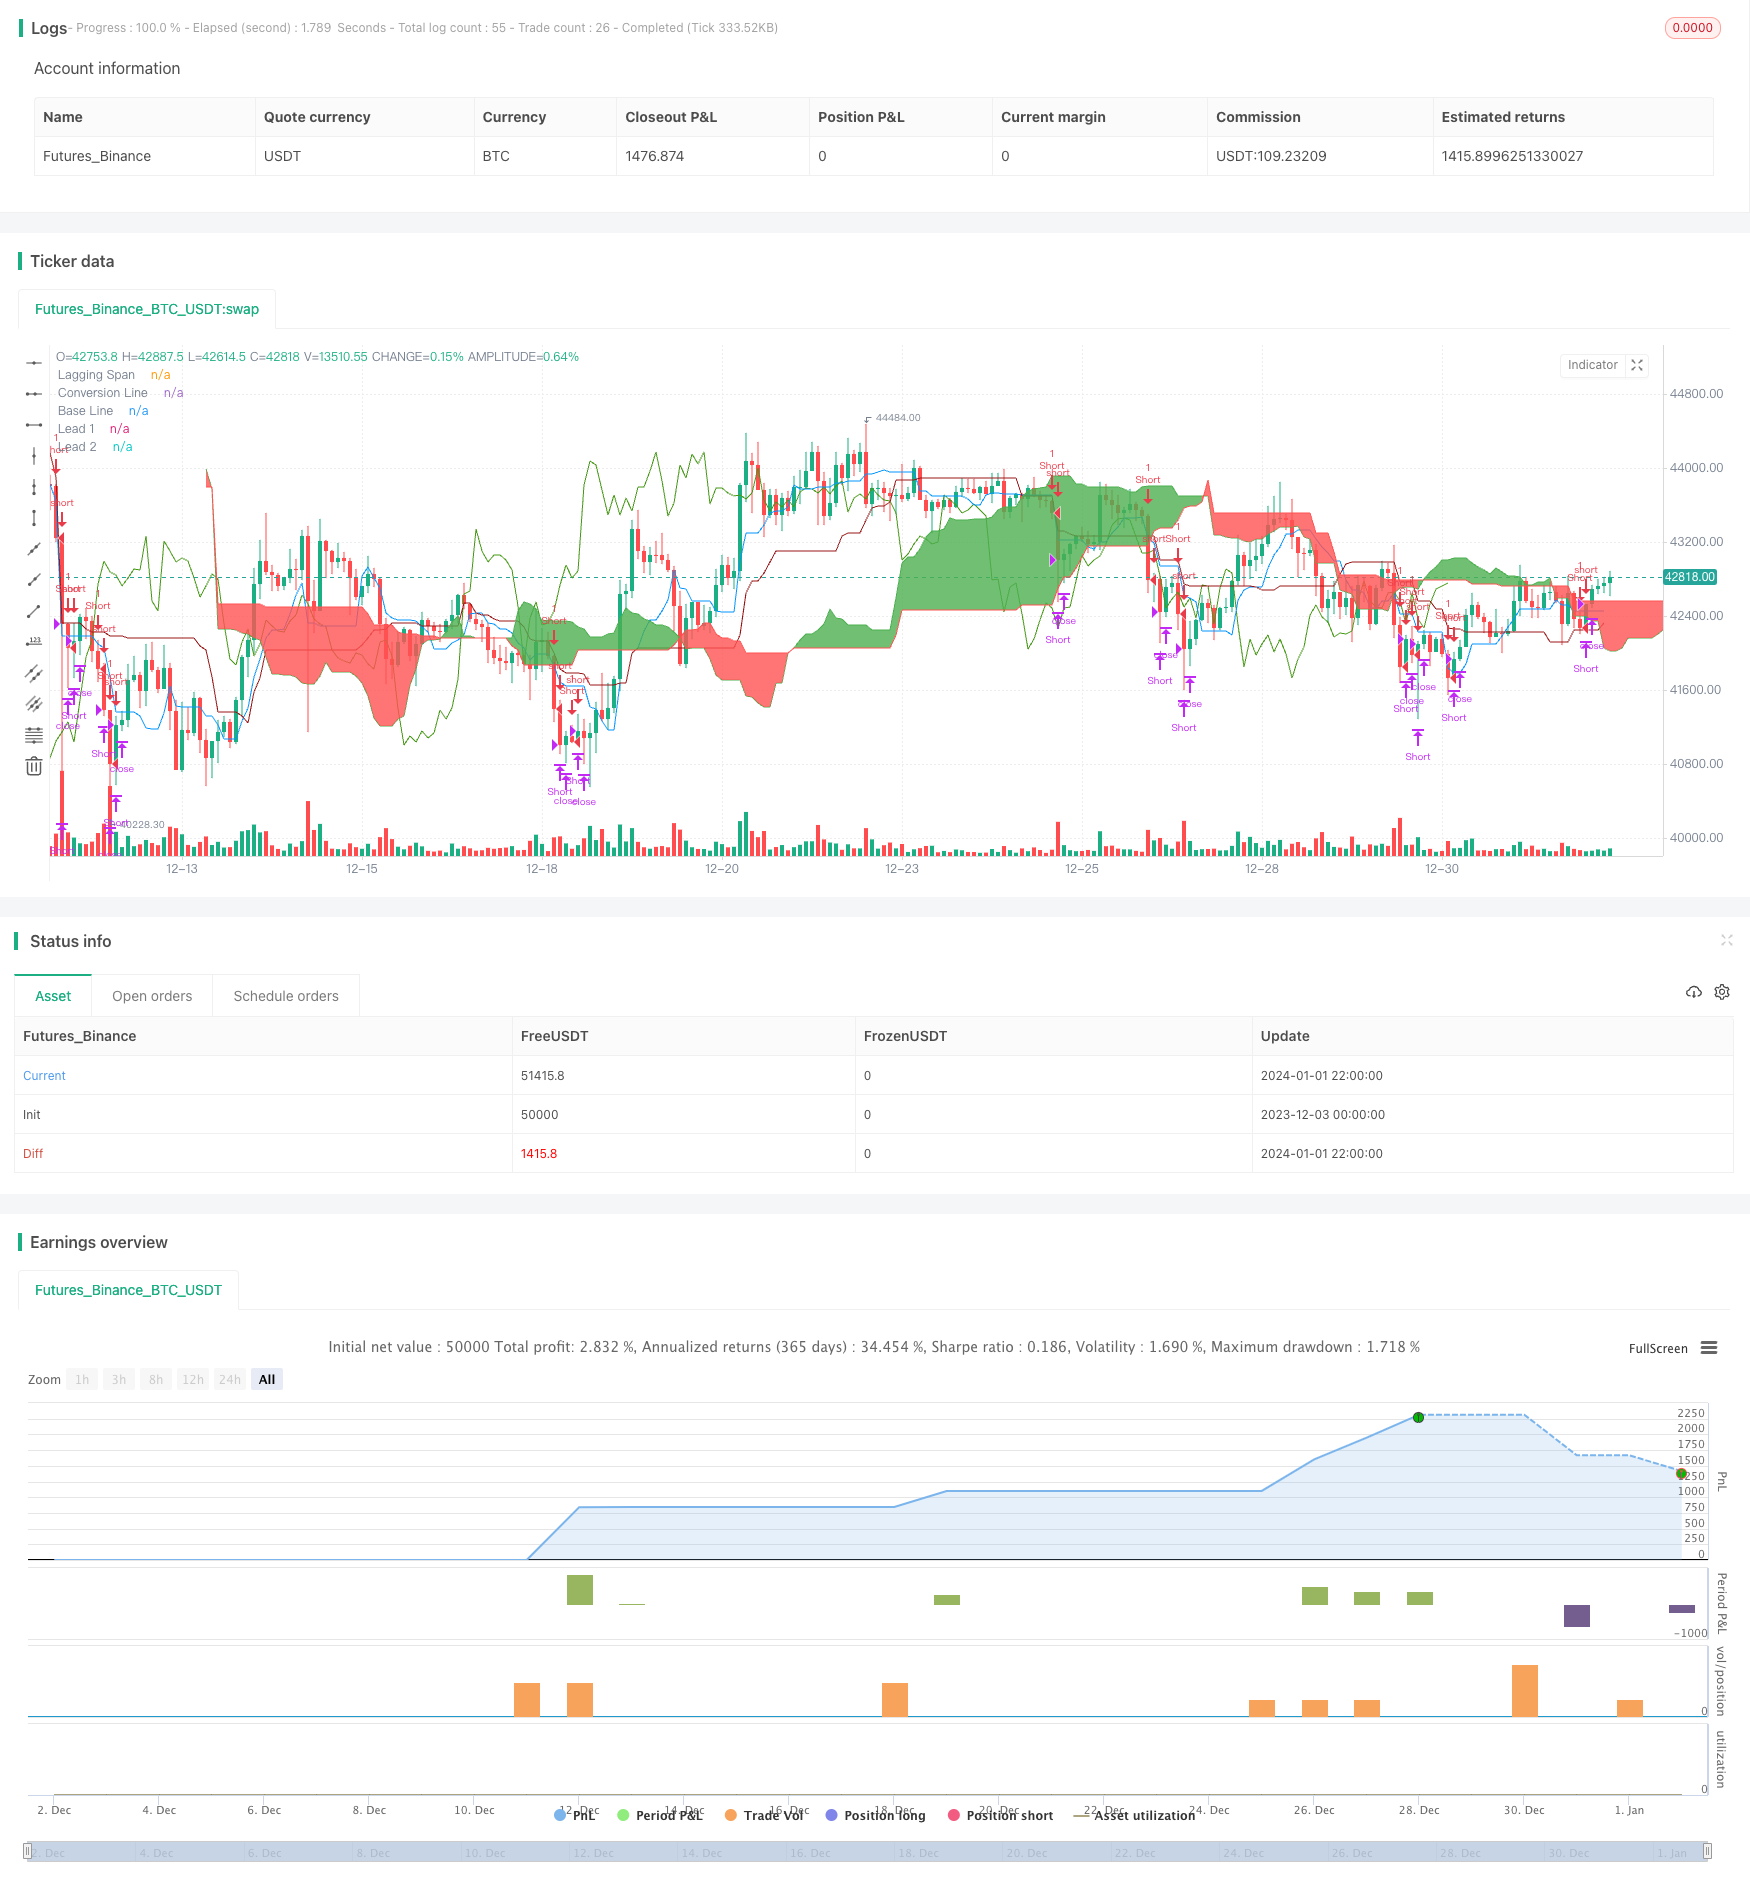
Overview
This strategy judges the price trend by calculating the cross of double moving averages, and issues buy and sell signals with certain parameter restrictions. It mainly consists of three parts: first, judge the price trend by calculating the cross of fast and slow moving averages; second, set certain parameter restrictions to avoid wrong trades; third, use stop profit and stop loss to control risks.
Strategy Principle
The core of this strategy lies in the calculation of fast and slow moving averages. The fast moving average has a period of half of the total moving average period, which is more sensitive to price changes; the slow moving average has a period of total moving average period, which reflects price changes more smoothly. When the fast moving average goes above the slow one, it is believed that the price rises up; when below, it falls down.
In addition, the strategy sets certain parameters to avoid wrong trades. For example, the decision threshold is to ensure that signals are issued only when the difference between the two moving averages exceeds a certain level; the confidence parameter is used to filter out small price fluctuations.
Finally, stop profit and stop loss are employed to control risks. If openprofit is less than stop loss point or larger than stop profit point, positions will be closed. This effectively limits the loss of a single trade.
Advantage Analysis
The biggest advantage of this strategy is to combine the judgment of price trend and volatility characteristics through moving average indicators. Cross of double moving averages is a classic effective technical approach to determine price trends. With parameter optimization, it can accurately capture trends. The confidence parameter can effectively filter out choppy markets and avoid frequent wrong trades.
In addition, parameters like decision threshold, stop profit and stop loss can also greatly reduce trading risks by avoiding chasing highs and selling lows.
Risk Analysis
The main risk of this strategy is the possibility of wrong signals from the double moving averages. Both fast and slow MAs are weighted moving averages which react slowly to sudden events, thus missing short-term price reversals. At this time, the confidence parameter can provide double confirmation.
In addition, improper settings of stop profit and stop loss points will also increase risks. Overly high profit target and low stop loss point may lead to losses beyond expectations. Reasonable parameters need to be set according to the characteristics of different trading products and volatility.
Optimization Directions
The strategy can be optimized in the following aspects:
Optimize the moving average periods, set adaptive moving averages to better model price fluctuations of different cycles;
Set dynamic tracking mechanisms for stop profit and stop loss, calculate volatility in real time based on market conditions, so that the stop points can change dynamically;
Increase machine learning models to judge price trend directions, utilize more historical data to determine current price movements, and reduce wrong signals.
Conclusion
In general, this is a classic simple and effective trend trading strategy. It uses double moving average cross to determine trends, sets parameters to control risks, and has high configurability for multi-product trading. If more intelligent judgment means like machine learning can be introduced, the overall effect could be even better for further research.
Parameters
| Name | Default | What it controls |
|---|---|---|
| v_input_1 | 14 | Double HullMA |
| v_input_2 | 0.001 | Decision Threshold (0.001) |
| v_input_3 | -10 | Stop Loss in $ |
| v_input_4 | 100 | Target Point in $ |
| v_input_5 | 9 | Conversion Line Periods |
| v_input_6 | 26 | Base Line Periods |
| v_input_7 | 52 | Lagging Span 2 Periods |
| v_input_8 | 26 | Displacement |
| v_input_9 | 9 | MACD_Length |
| v_input_10 | 12 | MACD_fastLength |
| v_input_11 | 26 | MACD_slowLength |
Source Pine Script
/*backtest
start: 2023-12-03 00:00:00
end: 2024-01-02 00:00:00
period: 2h
basePeriod: 15m
exchanges: [{"eid":"Futures_Binance","currency":"BTC_USDT"}]
*/

//@version=2
// Any timeFrame ok but good on 15 minute & 60 minute , Ichimoku + Daily-Candle_cross(DT) + HULL-MA_cross + MacD combination 420 special blend
strategy("Trade Signal", shorttitle="Trade Alert", overlay=true )
keh=input(title="Double HullMA",defval=14, minval=1)
dt = input(defval=0.0010, title="Decision Threshold (0.001)", type=float, step=0.0001)
SL = input(defval=-10.00, title="Stop Loss in $", type=float, step=1)
TP = input(defval=100.00, title="Target Point in $", type=float, step=1)
ot=1
n2ma=2*wma(close,round(keh/2))
nma=wma(close,keh)
diff=n2ma-nma
sqn=round(sqrt(keh))
n2ma1=2*wma(close[1],round(keh/2))
nma1=wma(close[1],keh)
diff1=n2ma1-nma1
sqn1=round(sqrt(keh))
n1=wma(diff,sqn)
n2=wma(diff1,sqn)
b=n1>n2?lime:red
c=n1>n2?green:red
d=n1>n2?red:green
confidence=(request.security(syminfo.tickerid, '5', close[1])-request.security(syminfo.tickerid, '60', close[1]))/request.security(syminfo.tickerid, '60', close[1])
conversionPeriods = input(9, minval=1, title="Conversion Line Periods")
basePeriods = input(26, minval=1, title="Base Line Periods")
laggingSpan2Periods = input(52, minval=1, title="Lagging Span 2 Periods")
displacement = input(26, minval=1, title="Displacement")
donchian(len) => avg(lowest(len), highest(len))
conversionLine = donchian(conversionPeriods)
baseLine = donchian(basePeriods)
leadLine1 = avg(conversionLine, baseLine)
leadLine2 = donchian(laggingSpan2Periods)
LS=close, offset = -displacement
MACD_Length = input(9)
MACD_fastLength = input(12)
MACD_slowLength = input(26)
MACD = ema(close, MACD_fastLength) - ema(close, MACD_slowLength)
aMACD = ema(MACD, MACD_Length)
closelong = n1<n2 and close<n2 and confidence<dt or strategy.openprofit<SL or strategy.openprofit>TP
if (closelong)
    strategy.close("Long")
closeshort = n1>n2 and close>n2 and confidence>dt or strategy.openprofit<SL or strategy.openprofit>TP
if (closeshort)
    strategy.close("Short")
longCondition = n1>n2 and strategy.opentrades<ot and confidence>dt and close>n2 and leadLine1>leadLine2 and open<LS and MACD>aMACD
if (longCondition)
    strategy.entry("Long",strategy.long)
shortCondition = n1<n2 and strategy.opentrades<ot and confidence<dt and close<n2 and leadLine1<leadLine2 and open>LS and MACD<aMACD
if (shortCondition)
    strategy.entry("Short",strategy.short)

//alerts
alertcondition(closelong, title='Close Buy Position', message='Close Buy Position')
alertcondition(closeshort, title='Close Short Position', message='Close Short Position')
alertcondition(longCondition, title='Buy Signal', message='Buy Signal Alert')
alertcondition(shortCondition, title='Sell Signal', message='Sell Signal Alert')

//a1=plot(n1,color=c)
//a2=plot(n2,color=c)plot(cross(n1, n2) ? n1 : na, style = circles, color=b, linewidth = 4)
//plot(cross(n1, n2) ? n1 : na, style = line, color=d, linewidth = 4)
plot(conversionLine, color=#0496ff, title="Conversion Line")
plot(baseLine, color=#991515, title="Base Line")
plot(close, offset = -displacement, color=#459915, title="Lagging Span")
p1=plot (leadLine1, offset = displacement, color=green,  title="Lead 1")
p2=plot (leadLine2, offset = displacement, color=red,  title="Lead 2")
fill(p1, p2, color = leadLine1 > leadLine2 ? green : red)
// remove the "//" from before the plot script if want to see the indicators on chartPublished by ChaoZhang on the FMZ strategy square · last modified 2024-01-03. Collected in the Quant Trading Vault. Unvalidated research: re-test with your own data and costs before trusting it.
Build this with AgenKit
A spec is not a trading system. Paste this into your coding agent and AgenKit runs a specialist team — architecture, test-first build, risk gates, review — with paper trading on by default.
/agenkit build a production-grade trading bot with a backtest engine, risk controls and paper trading by default from strategies/Crossing-Moving-Average-Trend-Tracking-Strategy.md- npx agenkit install engineering-kit in your project
- Paste the command into your agent and approve each phase
- Get tests, backtest, risk controls and a paper-trading switch
Understand it first
Before you run this, read the lesson behind the idea and how to backtest it honestly. Specs like this one are the survivors of an unknown number of trials; deflate their results accordingly.
Related specs
- Ichimoku Cloud MACD and Stochastic Based Multi Timeframe Trend Tracking StrategyPine Script · Trend following · 4h
- Multiple Timeframe Filtered Trend Following StrategyPine Script · Trend following · 1h
- Advanced Multi Indicator Multi Dimensional Trend Cross Quantitative StrategyPine Script · Trend following · 3h
- Dual ATR Channel Trend Following StrategyPine Script · Trend following · 15m
- Triple Supertrend Ichimoku Cloud Quantitative Trading StrategyPine Script · Trend following · 1d
- ADX Based One Hour TENKAN KIJUN Cross Trend Tracking StrategyPine Script · Trend following · 1h