Strategy vault / Trend following
Advanced Multi Indicator Multi Dimensional Trend Cross Quantitative Strategy
This strategy is a comprehensive trading system that combines multiple technical indicators, including Ichimoku Cloud, Relative Strength Index (RSI), Moving Average Convergence Divergence (MACD), Higher Time Frame…
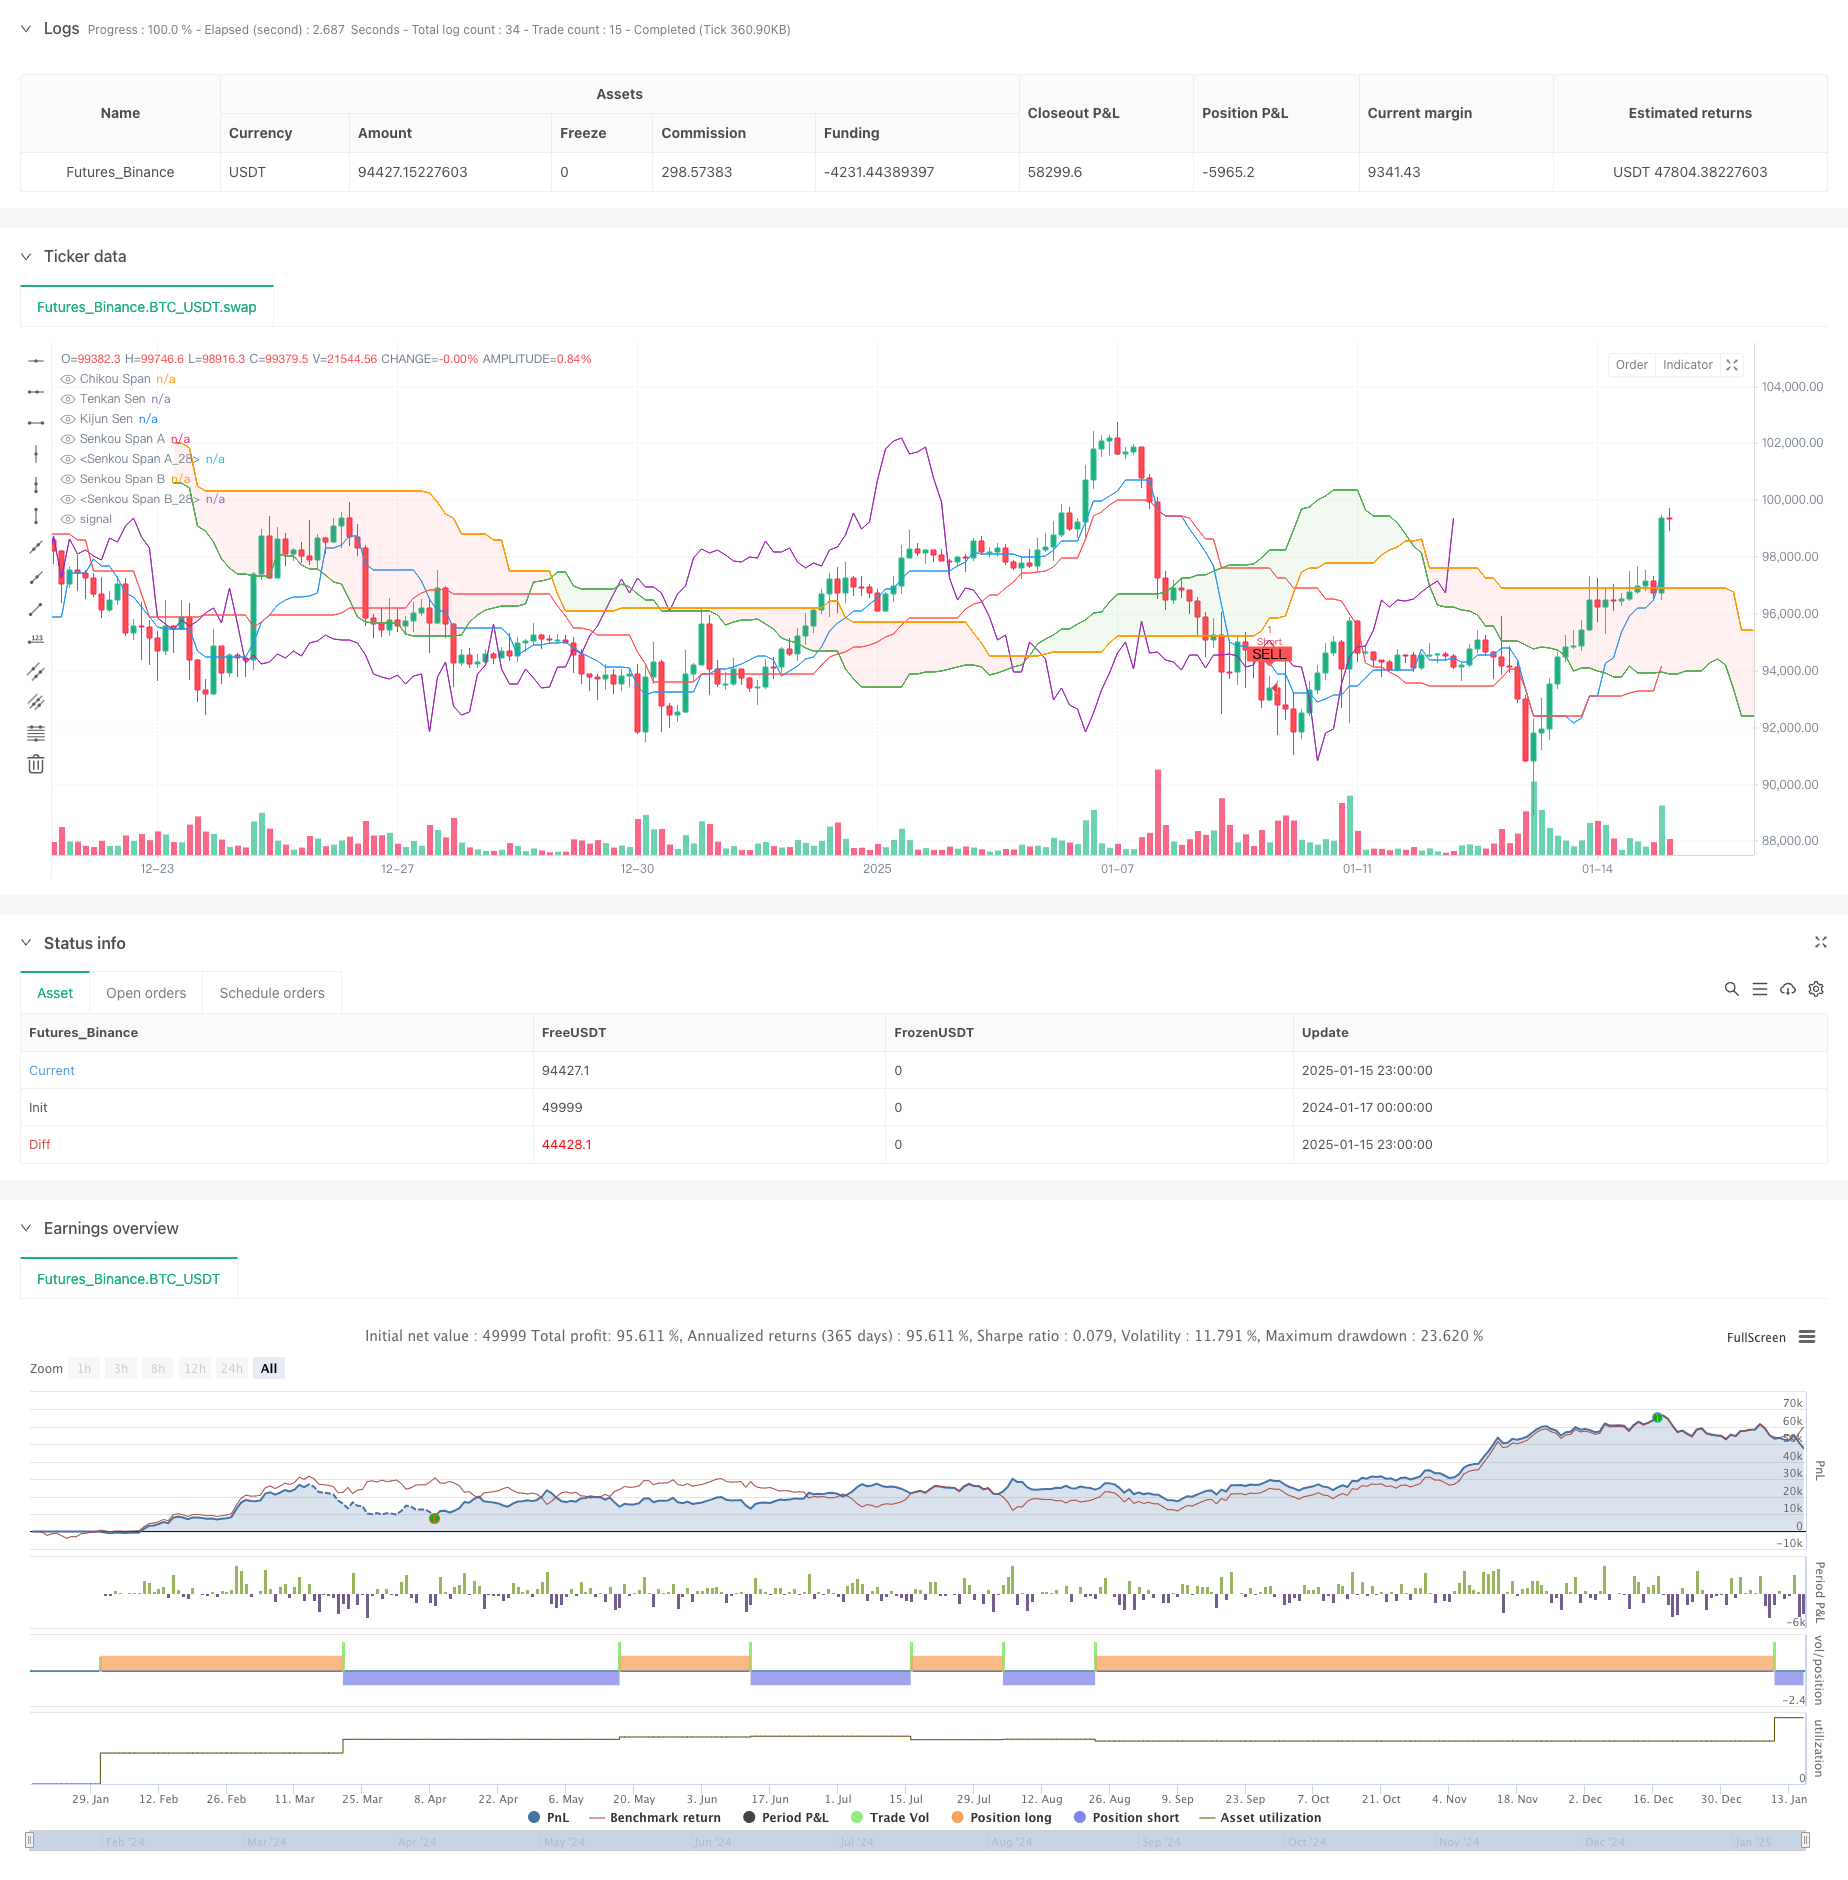
Overview
This strategy is a comprehensive trading system that combines multiple technical indicators, including Ichimoku Cloud, Relative Strength Index (RSI), Moving Average Convergence Divergence (MACD), Higher Time Frame (HTF) divergence, and Exponential Moving Average (EMA) crossovers. The strategy utilizes multiple signal confirmations to improve trading accuracy while leveraging market information from different time frames to capture more reliable trading opportunities.
Strategy Principles
The core principle of the strategy is to confirm trading signals through multi-layer technical analysis. It uses the Ichimoku Cloud components to determine overall market trends, combines RSI to judge market overbought/oversold conditions, utilizes MACD to identify trend momentum changes, and captures potential trend reversal signals through HTF RSI and MACD divergences. Additionally, the strategy incorporates EMA50 and EMA100 crossovers for confirmation, along with EMA200 as a primary trend filter, creating a multi-layered trading confirmation system.
Strategy Advantages
- Multi-dimensional signal confirmation significantly reduces false breakout risks and improves trading accuracy
- HTF divergence analysis enhances the ability to predict market turning points
- Integration of trend-following and reversal trading characteristics provides strong adaptability
- EMA crossovers provide additional trend confirmation, improving entry timing accuracy
- Comprehensive technical indicator system enables all-round market state analysis
Strategy Risks
- Multiple indicator confirmations may cause missed opportunities in rapid market movements
- May generate numerous false signals in ranging markets
- High complexity in parameter optimization increases the risk of overfitting
- Multiple indicators may introduce certain latency in signal generation
- Multiple confirmation mechanisms may fail under extreme market conditions
Strategy Optimization Directions
- Introduce adaptive parameter mechanisms to dynamically adjust indicator parameters based on market conditions
- Add volatility filters to adjust strategy parameters in high-volatility environments
- Develop more intelligent stop-loss and take-profit mechanisms to improve money management efficiency
- Add market state classification modules to apply different trading logic for different market conditions
- Optimize HTF divergence identification algorithms to improve signal timeliness
Summary
This strategy constructs a relatively complete trading system through the coordination of multiple technical indicators. Its strength lies in its multi-dimensional signal confirmation mechanism, while also facing challenges in parameter optimization and market adaptability. Through the proposed optimization directions, the strategy has the potential to further enhance its performance across different market environments while maintaining its robustness.
Source Pine Script
/*backtest
start: 2024-01-17 00:00:00
end: 2025-01-16 00:00:00
period: 3h
basePeriod: 3h
exchanges: [{"eid":"Futures_Binance","currency":"BTC_USDT","balance":49999}]
*/
//@version=6
strategy("Ichimoku + RSI + MACD + HTF Divergence + EMA Cross Strategy", overlay=true)
// تنظیمات تایمفریم بالاتر
htf_timeframe = input.timeframe("D", title="تایمفریم بالاتر")
// تنظیمات پارامترهای ایچیموکو
tenkan_period = input(9, title="Tenkan Sen Period")
kijun_period = input(26, title="Kijun Sen Period")
senkou_span_b_period = input(52, title="Senkou Span B Period")
displacement = input(26, title="Displacement")
// محاسبه خطوط ایچیموکو
tenkan_sen = (ta.highest(high, tenkan_period) + ta.lowest(low, tenkan_period)) / 2
kijun_sen = (ta.highest(high, kijun_period) + ta.lowest(low, kijun_period)) / 2
senkou_span_a = (tenkan_sen + kijun_sen) / 2
senkou_span_b = (ta.highest(high, senkou_span_b_period) + ta.lowest(low, senkou_span_b_period)) / 2
chikou_span = close // قیمت بسته شدن فعلی
// رسم خطوط ایچیموکو
plot(tenkan_sen, color=color.blue, title="Tenkan Sen")
plot(kijun_sen, color=color.red, title="Kijun Sen")
plot(senkou_span_a, offset=displacement, color=color.green, title="Senkou Span A")
plot(senkou_span_b, offset=displacement, color=color.orange, title="Senkou Span B")
plot(chikou_span, offset=-displacement, color=color.purple, title="Chikou Span")
// رنگآمیزی ابر ایچیموکو
fill(plot(senkou_span_a, offset=displacement, color=color.green, title="Senkou Span A"), plot(senkou_span_b, offset=displacement, color=color.orange, title="Senkou Span B"), color=senkou_span_a > senkou_span_b ? color.new(color.green, 90) : color.new(color.red, 90), title="Cloud")
// تنظیمات RSI
rsi_length = input(14, title="RSI Length")
rsi_overbought = input(70, title="RSI Overbought Level")
rsi_oversold = input(30, title="RSI Oversold Level")
// محاسبه RSI
rsi_value = ta.rsi(close, rsi_length)
// تنظیمات MACD
fast_length = input(12, title="MACD Fast Length")
slow_length = input(26, title="MACD Slow Length")
signal_smoothing = input(9, title="MACD Signal Smoothing")
// محاسبه MACD
[macd_line, signal_line, hist_line] = ta.macd(close, fast_length, slow_length, signal_smoothing)
// شناسایی واگراییها در تایمفریم بالاتر
f_find_divergence(src, lower, upper) =>
var int divergence = na // تعریف نوع متغیر بهصورت صریح
if (src >= upper and src[1] < upper)
divergence := 1 // واگرایی نزولی
else if (src <= lower and src[1] > lower)
divergence := -1 // واگرایی صعودی
divergence
// محاسبه RSI و MACD در تایمفریم بالاتر
htf_rsi_value = request.security(syminfo.tickerid, htf_timeframe, rsi_value)
htf_macd_line = request.security(syminfo.tickerid, htf_timeframe, macd_line)
// شناسایی واگراییها در تایمفریم بالاتر
htf_rsi_divergence = f_find_divergence(htf_rsi_value, rsi_oversold, rsi_overbought)
htf_macd_divergence = f_find_divergence(htf_macd_line, 0, 0)
// فیلتر روند با EMA 200
ema_200 = ta.ema(close, 200)
// اضافه کردن EMA 50 و 100
ema_50 = ta.ema(close, 50)
ema_100 = ta.ema(close, 100)
// کراسهای EMA
ema_cross_up = ta.crossover(ema_50, ema_100) // کراس صعودی EMA 50 و 100
ema_cross_down = ta.crossunder(ema_50, ema_100) // کراس نزولی EMA 50 و 100
// شرایط ورود و خروج
long_condition = (close > senkou_span_a and close > senkou_span_b) and // قیمت بالای ابر
(rsi_value > 50) and // RSI بالای 50
(macd_line > signal_line) and // MACD خط سیگنال را قطع کرده
(htf_rsi_divergence == -1 or htf_macd_divergence == -1) and // واگرایی صعودی در تایمفریم بالاتر
(close > ema_200) and // قیمت بالای EMA 200
(ema_cross_up) // کراس صعودی EMA 50 و 100
short_condition = (close < senkou_span_a and close < senkou_span_b) and // قیمت زیر ابر
(rsi_value < 50) and // RSI زیر 50
(macd_line < signal_line) and // MACD خط سیگنال را قطع کرده
(htf_rsi_divergence == 1 or htf_macd_divergence == 1) and // واگرایی نزولی در تایمفریم بالاتر
(close < ema_200) and // قیمت زیر EMA 200
(ema_cross_down) // کراس نزولی EMA 50 و 100
// نمایش نقاط ورود در چارت
plotshape(series=long_condition, title="Buy Signal", location=location.belowbar, color=color.green, style=shape.labelup, text="BUY", size=size.small)
plotshape(series=short_condition, title="Sell Signal", location=location.abovebar, color=color.red, style=shape.labeldown, text="SELL", size=size.small)
// اجرای استراتژی
if (long_condition)
strategy.entry("Long", strategy.long)
if (short_condition)
strategy.entry("Short", strategy.short)Published by ChaoZhang on the FMZ strategy square · last modified 2025-01-17. Collected in the Quant Trading Vault. Unvalidated research: re-test with your own data and costs before trusting it.
Build this with AgenKit
A spec is not a trading system. Paste this into your coding agent and AgenKit runs a specialist team — architecture, test-first build, risk gates, review — with paper trading on by default.
/agenkit build a production-grade trading bot with a backtest engine, risk controls and paper trading by default from strategies/Advanced-Multi-Indicator-Multi-Dimensional-Trend-Cross-Quantitative-Strategy.md- npx agenkit install engineering-kit in your project
- Paste the command into your agent and approve each phase
- Get tests, backtest, risk controls and a paper-trading switch
Understand it first
Before you run this, read the lesson behind the idea and how to backtest it honestly. Specs like this one are the survivors of an unknown number of trials; deflate their results accordingly.
Related specs
- Dual ATR Channel Trend Following StrategyPine Script · Trend following · 15m
- Multiple Timeframe Filtered Trend Following StrategyPine Script · Trend following · 1h
- Trend Following Strategy Based on Moving Average Crossover 430022Pine Script · Trend following · 1d
- Adaptive ATR and RSI Trend Following Strategy with Trailing Stop LossPine Script · Trend following · 1h
- Bollinger Bands and RSI Trend Following StrategyPine Script · Trend following · 1h
- Dynamic Dual EMA Crossover Strategy with Adaptive Profit Loss ControlPine Script · Trend following · 1d