Directional Movement Index Dual direction Trading Strategy
This strategy calculates the Directional Movement Index (DI) of commodities and combines it with limit parameters to implement dual-direction trading. It goes long when DI+ is greater than DI- by a limit parameter…
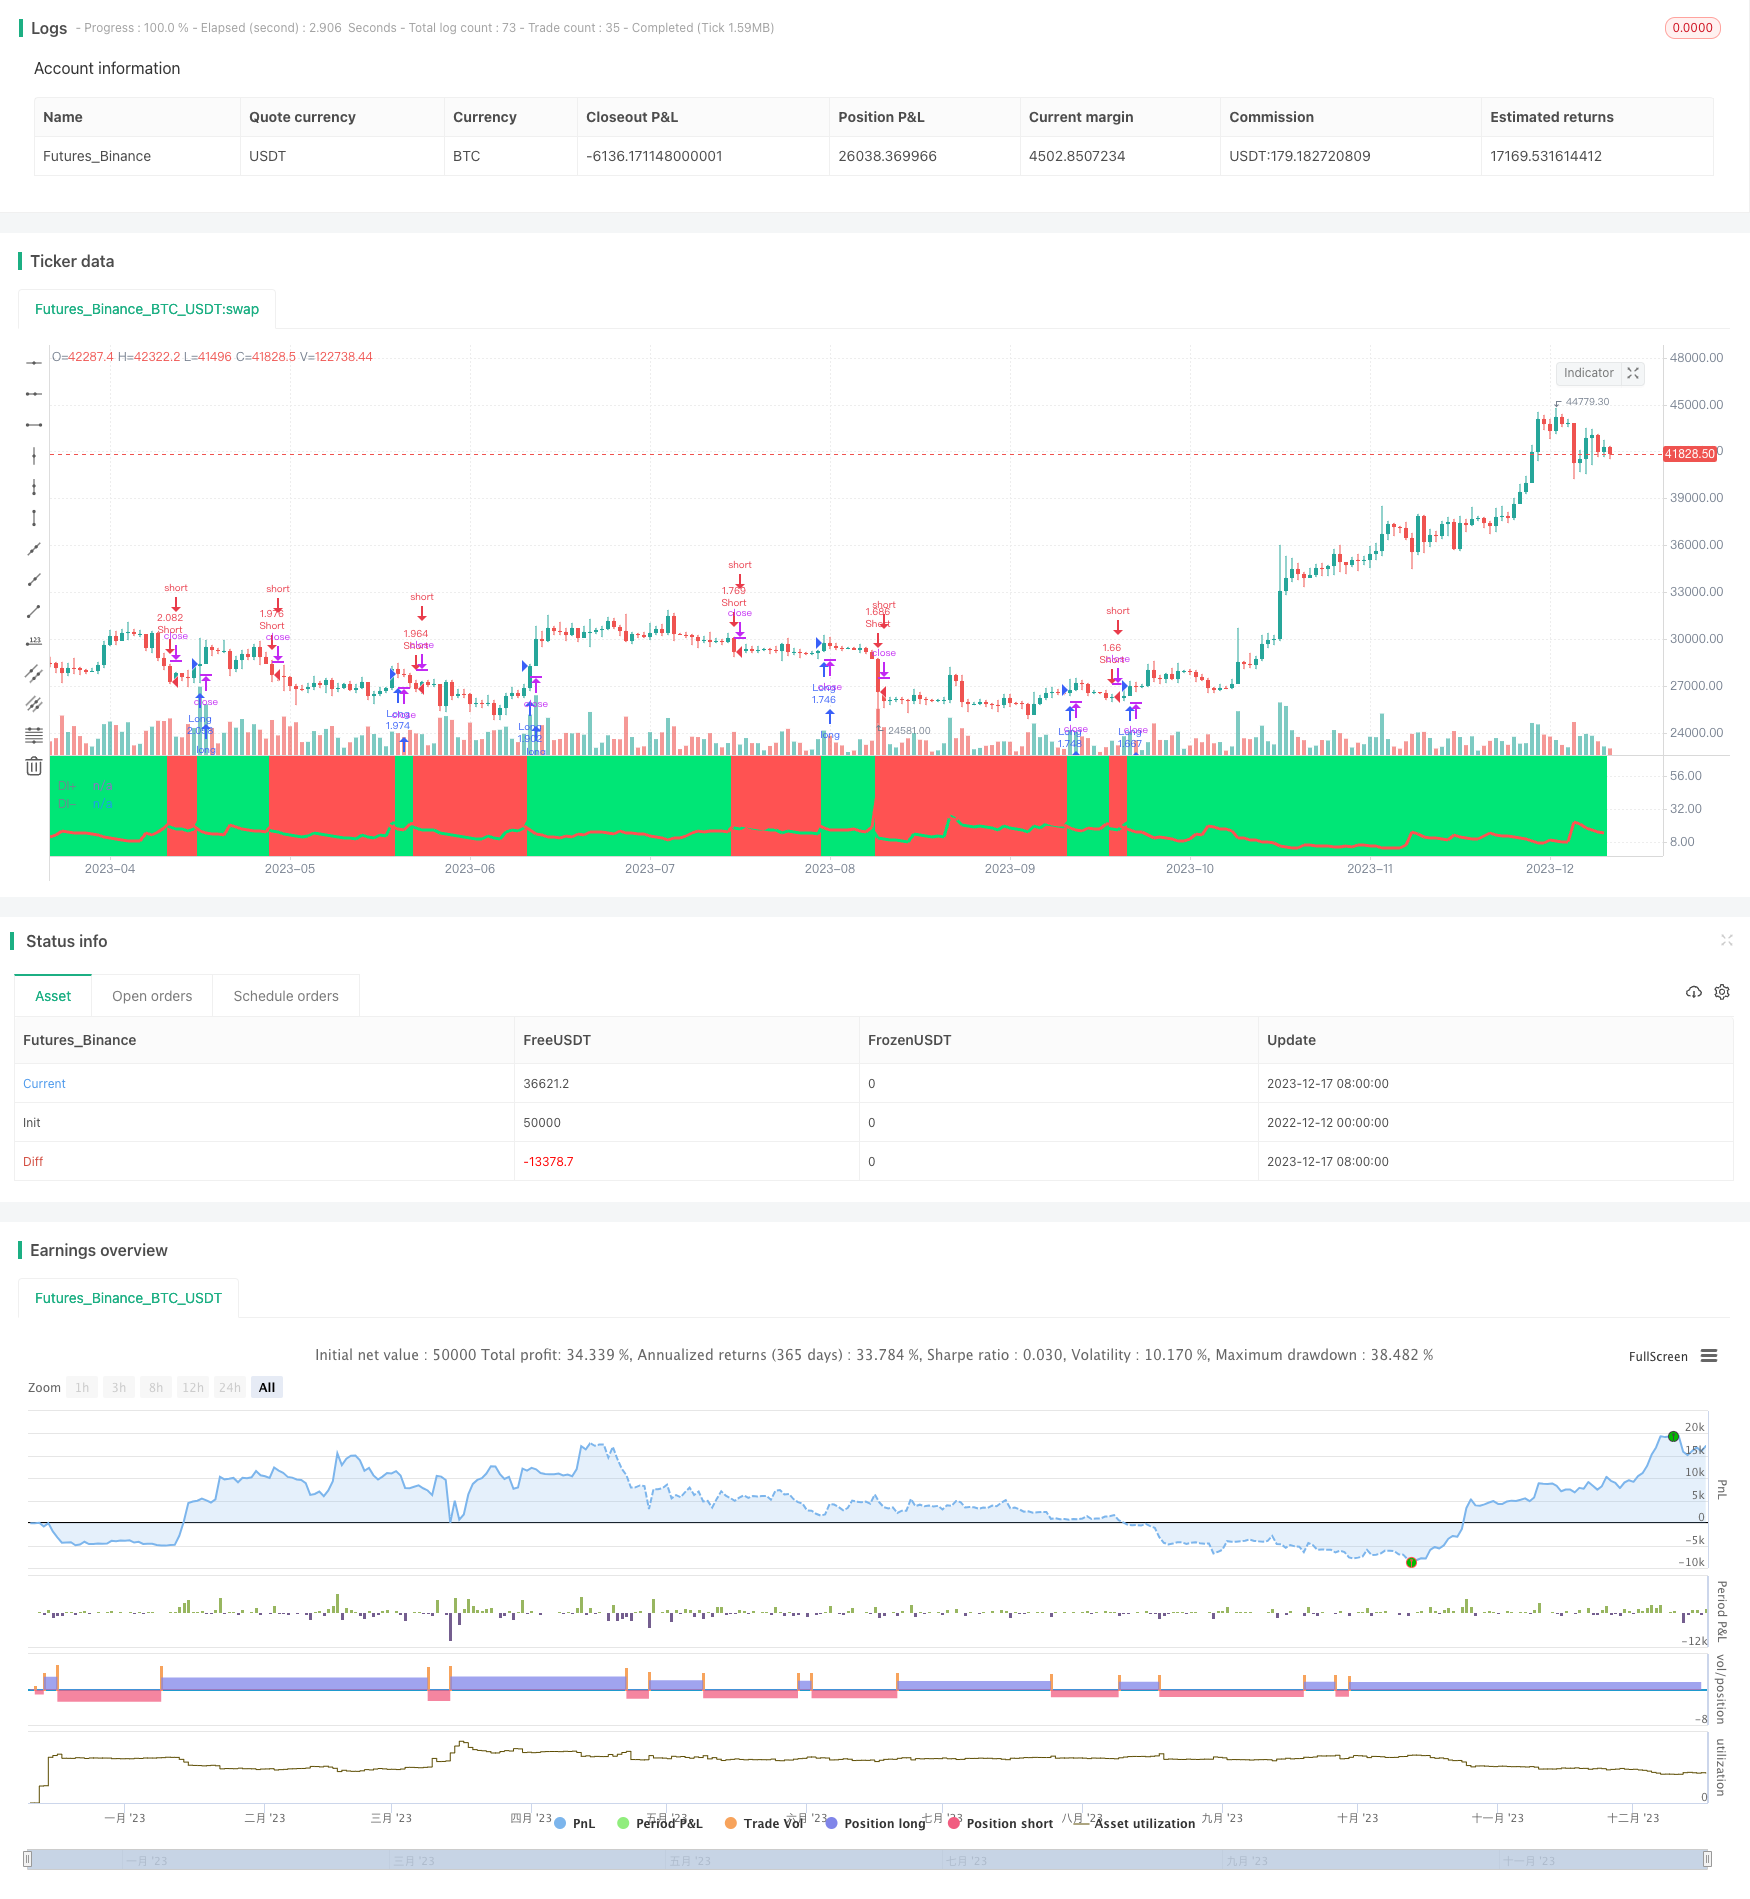
Overview
This strategy calculates the Directional Movement Index (DI) of commodities and combines it with limit parameters to implement dual-direction trading. It goes long when DI+ is greater than DI- by a limit parameter and goes short when DI- is greater than DI+ by a limit parameter.
Strategy Principle
The core indicator of this strategy is the Directional Movement Index (DI). DI is calculated by the following formulas:
DI+ = (DM+ / True Range) × 100 DI- = (DM- / True Range) × 100
Where DM+ represents the Directional Movement Positive, DM- represents the Directional Movement Negative. The True Range represents the recent volatility by calculating the maximum value of the highest price, the lowest price and the closing price of the previous day over three days.
According to the definition of DI, when DI+ > DI-, it means the current market momentum is stronger, belonging to a bull market; when DI- > DI+, it means the bear momentum is stronger than the bull momentum, belonging to a bear market.
This strategy utilizes this feature and sets a limit parameter. When DI+ is greater than DI- by a limit parameter, it determines that the current market is a bull market and goes long. When DI- is greater than DI+ by a limit parameter, it determines that the current market is a bear market and goes short.
For example, if the limit parameter is set to 3, the specific trading rules are:
- When DI+ - DI- > 3, go long
- When DI- - DI+ > 3, go short
Since there are often small fluctuating differences between DI+ and DI-, setting a limit parameter can filter out some trades without significant directionality and reduce unnecessary trades. This is an advantage of this strategy.
Advantage Analysis
The main advantages of this strategy are:
DI is reliable in judging market directionality
DI directly judges market trends by calculating the power of bulls and bears. The theory is simple and reliable without complex algorithms like curve fitting.
The limit parameter can effectively filter signals
The limit parameter filters small fluctuations without significant directionality, only selecting sections with significant directionality to trade, avoiding being trapped.
Achieve automated dual-direction trading
Long and short positions can be automatically switched based on the DI indicator without manual judgment, reducing trading difficulty.
Customizable trading time frame
Supports setting to only trade within a customizable date range and close all positions automatically afterwards, flexible and convenient.
Selectable long or short only
Through the long and short switches, only single-direction signals can be selected to implement long or short only strategies suitable for different market environments.
Risk Analysis
There are also some risks with this strategy:
Possibility of DI giving wrong signals
DI may give short-term wrong signals when drastic market fluctuations occur, leading to failed trades. Other indicators need to be combined for verification.
Improper limit parameter settings
Improper high or low limit parameter settings can lead to too few or too many trading signals. The parameters need to be adjusted according to the market.
Unable to determine trend endpoint
DI can only determine the current trend direction and cannot judge whether the trend has ended or reversed. Other indicators need to be combined.
The solutions for the risks include:
Combine moving average and other indicators to filter DI signals
Adjust limit parameters based on backtest results
Combine Volume, MACD etc. to determine if trend reversal
Optimization Directions
The strategy can be further optimized in the following ways:
Combine other trend judgment indicators like Market Profile
Combining indicators like Market Profile which also intuitively judge long-short power with DI can improve judgment accuracy.
Add stop-profit and stop-loss strategies
Setting trailing stop-profit, time or percentage stop-losses can lock in profits and reduce losses.
Adjust parameters for specific products
Adjusting limit parameters and trading times according to different product characteristics can improve strategy performance.
Dynamic optimization using machine learning
Applying reinforcement learning algorithms to dynamically optimize parameter settings based on live signals.
Summary
In summary, this strategy is relatively simple and practical. It utilizes DI's calculation to determine market direction; filters signals via limit parameters; supports dual-direction trading or long/short only; allows setting trading time frame. The main advantages are high reliability and effective signal filtering. It also has issues like wrong signals and parameter settings. We can improve it by combining other indicators, setting stop-loss/profit, adjusting parameters etc, or dynamically optimizing it with machine learning. Overall it is suitable as a directional indicator to combine with other strategies for decent results.
Parameters
| Name | Default | What it controls |
|---|---|---|
| v_input_1 | true | Long |
| v_input_2 | true | Short |
| v_input_3 | 100 | Capital, % |
| v_input_4 | 14 | Length |
| v_input_5 | 3 | limit, % |
| v_input_6 | 1900 | From Year |
| v_input_7 | 2100 | To Year |
| v_input_8 | true | From Month |
| v_input_9 | 12 | To Month |
| v_input_10 | true | From day |
| v_input_11 | 31 | To day |
Source Pine Script
/*backtest
start: 2022-12-12 00:00:00
end: 2023-12-18 00:00:00
period: 1d
basePeriod: 1h
exchanges: [{"eid":"Futures_Binance","currency":"BTC_USDT"}]
*/

//@version=3
strategy("Noro's DI Strategy", overlay = false, default_qty_type = strategy.percent_of_equity, default_qty_value = 100, pyramiding = 0)

//Settings
needlong = input(true, defval = true, title = "Long")
needshort = input(true, defval = true, title = "Short")
capital = input(100, defval = 100, minval = 1, maxval = 10000, title = "Capital, %")
len = input(title="Length", defval=14)
limit = input(3, title = "limit, %")
fromyear = input(1900, defval = 1900, minval = 1900, maxval = 2100, title = "From Year")
toyear = input(2100, defval = 2100, minval = 1900, maxval = 2100, title = "To Year")
frommonth = input(01, defval = 01, minval = 01, maxval = 12, title = "From Month")
tomonth = input(12, defval = 12, minval = 01, maxval = 12, title = "To Month")
fromday = input(01, defval = 01, minval = 01, maxval = 31, title = "From day")
today = input(31, defval = 31, minval = 01, maxval = 31, title = "To day")

//DI
TrueRange = max(max(high-low, abs(high-nz(close[1]))), abs(low-nz(close[1])))
DirectionalMovementPlus = high-nz(high[1]) > nz(low[1])-low ? max(high-nz(high[1]), 0): 0
DirectionalMovementMinus = nz(low[1])-low > high-nz(high[1]) ? max(nz(low[1])-low, 0): 0
SmoothedTrueRange = 0.0
SmoothedDirectionalMovementPlus = 0.0
SmoothedDirectionalMovementMinus = 0.0
SmoothedTrueRange := nz(SmoothedTrueRange[1]) - (nz(SmoothedTrueRange[1])/len) + TrueRange
SmoothedDirectionalMovementPlus := nz(SmoothedDirectionalMovementPlus[1]) - (nz(SmoothedDirectionalMovementPlus[1])/len) + DirectionalMovementPlus
SmoothedDirectionalMovementMinus := nz(SmoothedDirectionalMovementMinus[1]) - (nz(SmoothedDirectionalMovementMinus[1])/len) + DirectionalMovementMinus
DIPlus = SmoothedDirectionalMovementPlus / SmoothedTrueRange * 100
DIMinus = SmoothedDirectionalMovementMinus / SmoothedTrueRange * 100

//Trend
trend = 0
trend := DIPlus > DIMinus + limit ? 1 : DIPlus < DIMinus - limit ? -1 : trend[1]

//Background
col = trend == 1 ? lime : red
bgcolor(col, transp = 80)

//Lines
plot(DIPlus, color=lime, title="DI+", linewidth = 3)
plot(DIMinus, color=red, title="DI-", linewidth = 3)

//Trading
size = strategy.position_size
lot = 0.0
lot := size != size[1] ? strategy.equity / close * capital / 100 : lot[1]
if trend == 1
    strategy.entry("Long", strategy.long, needlong == false ? 0 : lot, when=(time > timestamp(fromyear, frommonth, fromday, 00, 00) and time < timestamp(toyear, tomonth, today, 23, 59)))
if trend == -1
    strategy.entry("Short", strategy.short, needshort == false ? 0 : lot, when=(time > timestamp(fromyear, frommonth, fromday, 00, 00) and time < timestamp(toyear, tomonth, today, 23, 59)))
if time > timestamp(toyear, tomonth, today, 23, 59)
    strategy.close_all()
Published by ChaoZhang on the FMZ strategy square · last modified 2023-12-19. Collected in the Quant Trading Vault. Unvalidated research: re-test with your own data and costs before trusting it.
Build this with AgenKit
A spec is not a trading system. Paste this into your coding agent and AgenKit runs a specialist team — architecture, test-first build, risk gates, review — with paper trading on by default.
/agenkit build a production-grade trading bot with a backtest engine, risk controls and paper trading by default from strategies/Directional-Movement-Index-Dual-direction-Trading-Strategy.md- npx agenkit install engineering-kit in your project
- Paste the command into your agent and approve each phase
- Get tests, backtest, risk controls and a paper-trading switch
Understand it first
Before you run this, read the lesson behind the idea and how to backtest it honestly. Specs like this one are the survivors of an unknown number of trials; deflate their results accordingly.
Related specs
- ADX Momentum Trend StrategyPine Script · Momentum · 10m
- Advanced Multi Indicator Trend Following and Momentum Quantitative Trading StrategyPine Script · Momentum · 1h
- Dual EMA Crossover with RSI Momentum Enhanced Trading StrategyPine Script · Momentum · 1d
- Dual EMA Momentum Trend Trading Strategy with Full Body Candle Signal SystemPine Script · Momentum · 2h
- Ergotic Momentum Direction Convergence Trading StrategyPine Script · Momentum · 1d
- Laguerre RSI with ADX Filtered Trading Signals StrategyPine Script · Momentum · 1d