Double Exponential Moving Average Quant Trading Strategy
This strategy generates trading signals by calculating the crossovers between 5-day exponential moving average (EMA) and 20-day simple moving average (SMA). It goes long when 5-day EMA crosses above 20-day SMA and…
Overview
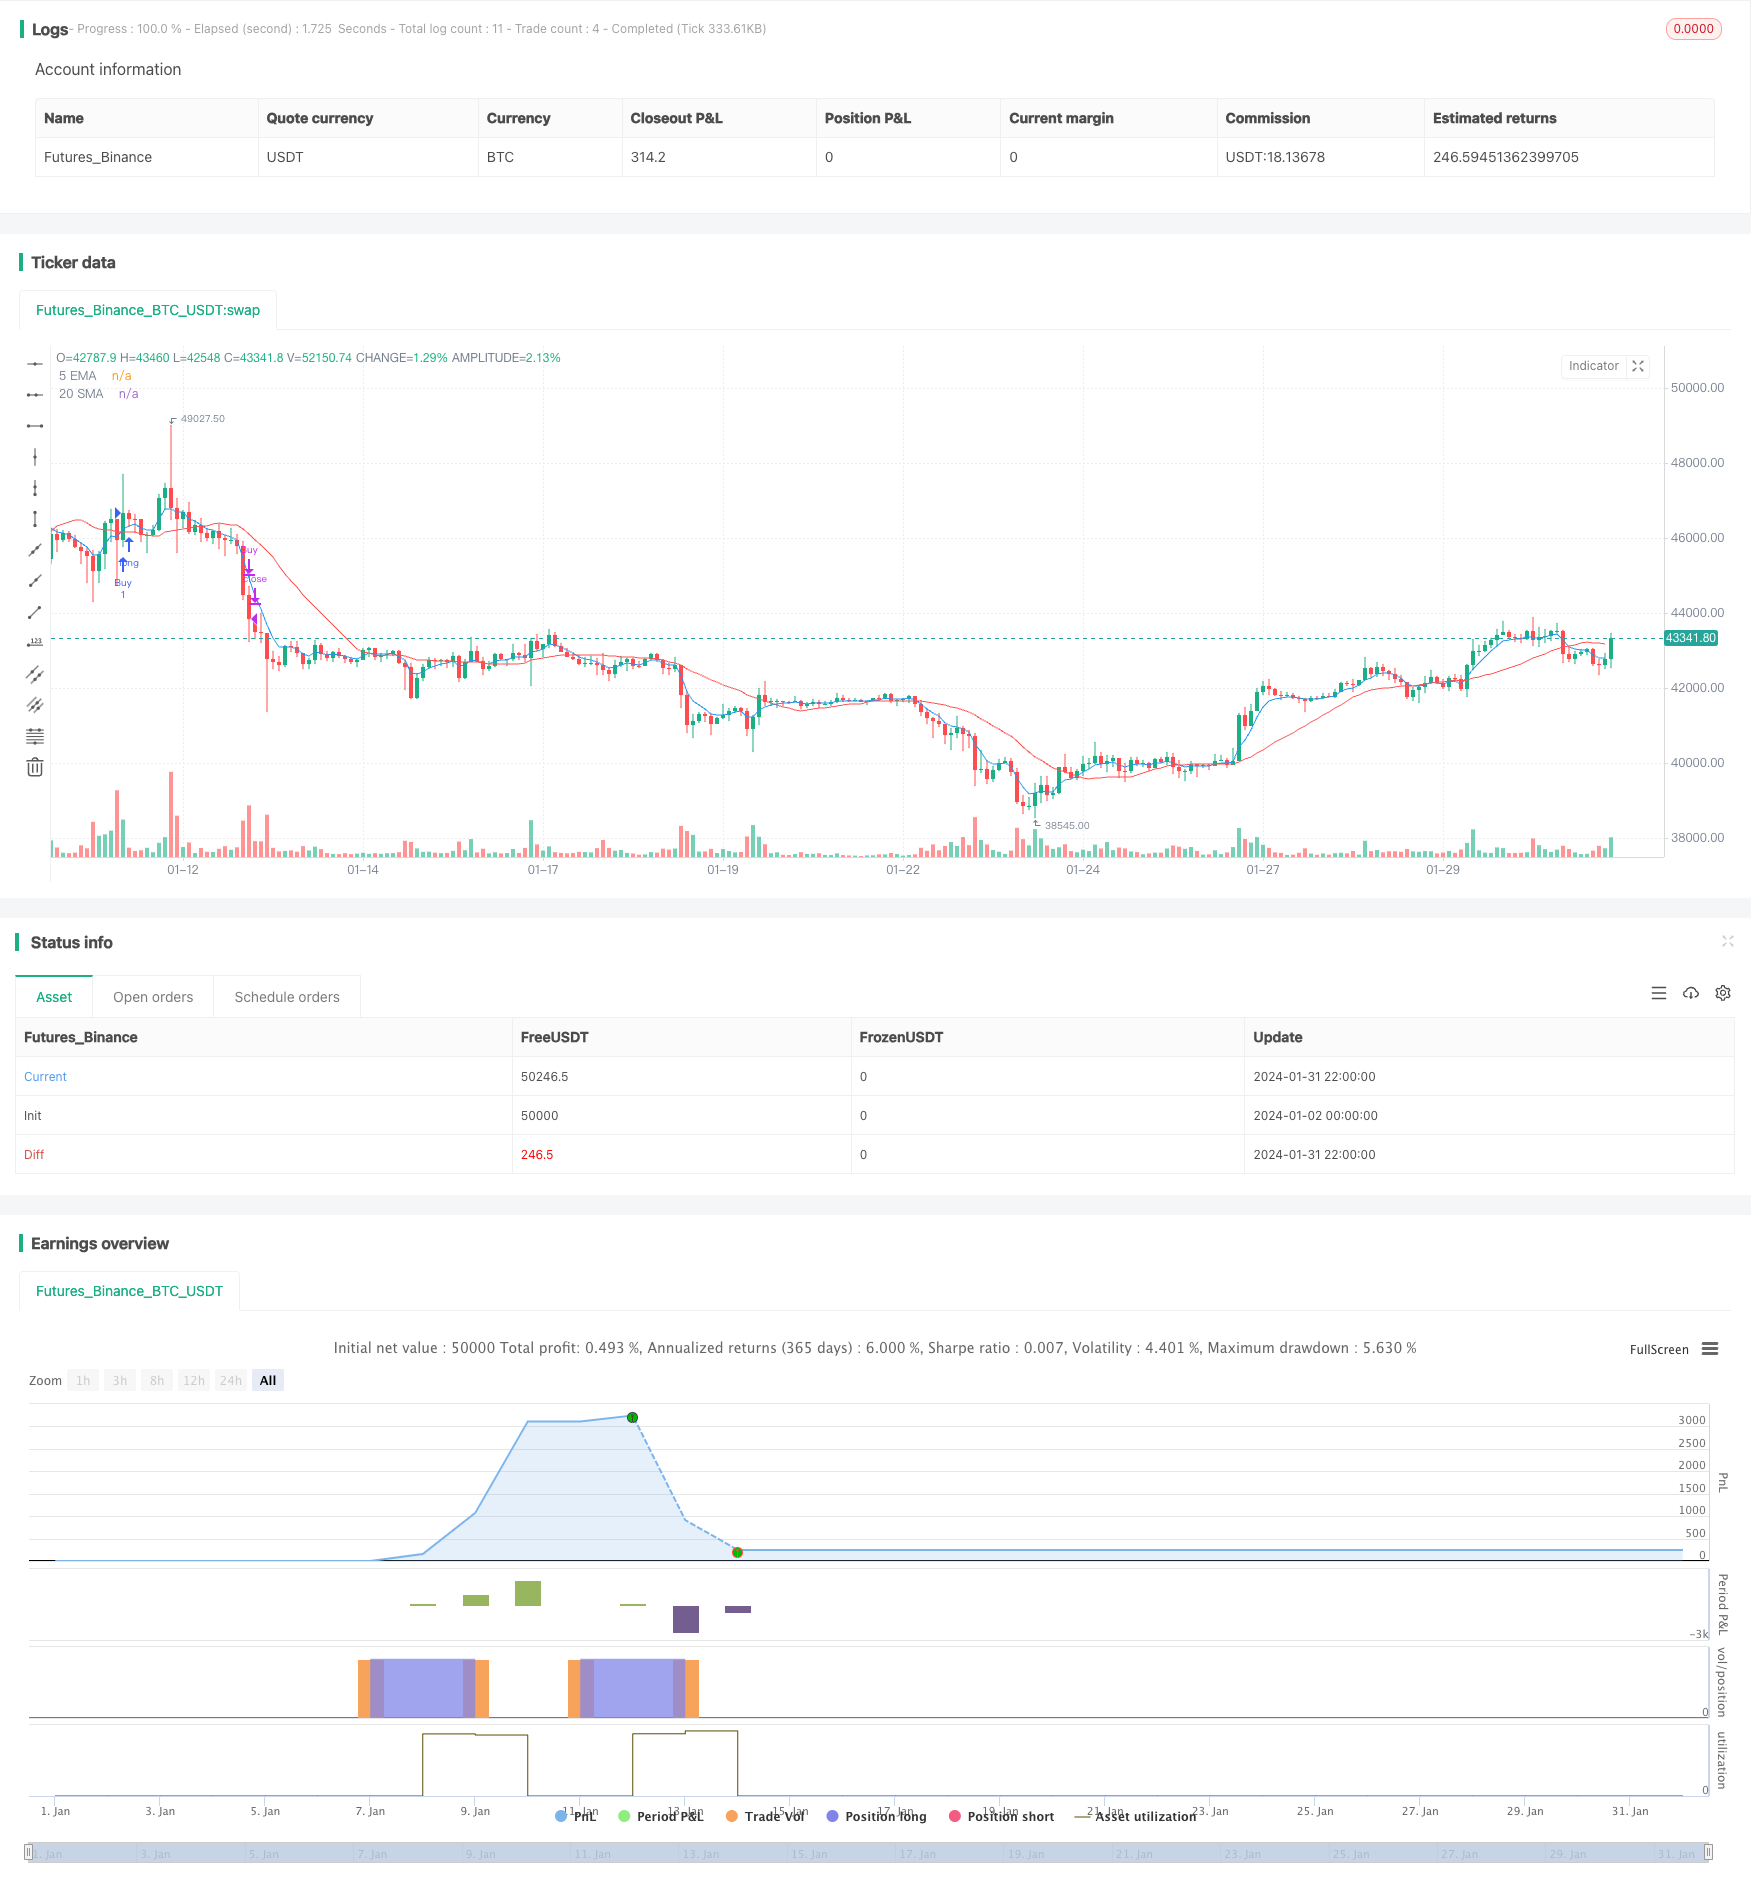
This strategy generates trading signals by calculating the crossovers between 5-day exponential moving average (EMA) and 20-day simple moving average (SMA). It goes long when 5-day EMA crosses above 20-day SMA and closes position when price change reaches 5% or -5%. It also incorporates Trading Index Index (TII) as an auxiliary indicator.
Strategy Principle
Double exponential moving averages are widely used technical indicators. 5-day EMA represents recent price trends while 20-day SMA shows medium-term price moves. When shorter-term MA crosses above longer-term MA, it signals an upside breakout and upward price trend, indicating good timing to go long. On the contrary, downward crossover implies potential price reversal and should consider exiting positions.
This strategy sets 5-day EMA and 20-day SMA as trading signals. It goes long when 5-day EMA crosses over 20-day SMA and closes position when price change hits 5% or -5%. It also checks if TII is positive and rising to confirm the signal reliability.
The detailed steps are:
- Calculate 5-day EMA, 20-day SMA and TII
- Generate buy signal when 5-day EMA crosses over 20-day SMA while TII is positive and rising
- Enter long position
- Close position when price change reaches 5% or -5%
Advantages
This strategy utilizes the golden crossover between two MAs and has following pros:
- Clear and simple trading signals, easy to implement.
- MAs are mainstream and common technical indicators, golden cross signal is classical and reliable.
- Incorporating TII can filter some uncertain signals and improve win rate.
- Predefined stop loss/take profit standards effectively control per trade risk.
In general, this strategy has straightforward rules, utilizes mature technical indicators like MA crossovers, and has relatively comprehensive risk control measurements. It is suitable for beginners to learn and use in quantitative trading field.
Risks
There are still some risks within this strategy:
- MA crossover signals may lag.
- TII indicator does not perform well in range-bound markets.
- Fixed stop loss/take profit standards could be arbitrary.
Suggested improvements are:
- Optimize MA parameters to reduce the lag.
- Add other auxiliary indicators to enhance signal reliability.
- Set dynamic stop loss/take profit standards.
So there is room for further optimization.
Optimization Directions
This strategy can be improved from the following aspects:
Optimize MA parameters by testing shorter/longer EMA and SMA combinations to find the optimal pair.
Add other indicators like MACD, KDJ to filter false signals.
Employ machine learning algorithms to find better parameters through historical data modeling and statistics.
Set dynamic stop loss/take profit based on market volatility and instrument characteristics to better control risks.
Expand this strategy to other products like forex, cryptocurrencies.
Through above enhancements, the stability and profitability of this strategy can be substantially improved.
Conclusion
In conclusion, this is an easy-to-understand and implement dual MA crossover strategy. It takes advantage of MA signals and uses TII to filter errors. It controls risks by stop loss/take profit. The strategy suits beginners to learn and also has large room for optimizations. Further improvements on parameter tuning, signal filtering and dynamic stop loss can transform it into a practical and powerful trading strategy.
Parameters
| Name | Default | What it controls |
|---|---|---|
| v_input_1 | 60 | Major Length |
| v_input_2 | 30 | Minor Length |
| v_input_3_close | 0 | Source: close | high | low | open | hl2 | hlc3 | hlcc4 | ohlc4 |
Source Pine Script
/*backtest
start: 2024-01-02 00:00:00
end: 2024-02-01 00:00:00
period: 2h
basePeriod: 15m
exchanges: [{"eid":"Futures_Binance","currency":"BTC_USDT"}]
*/

//@version=5
strategy("EMA-SMA Crossover Strategy", shorttitle="EMA-SMA Cross", overlay=true)

// Define the moving averages
ema5 = ta.ema(close, 5)
sma20 = ta.sma(close, 20)
smaVolume10 = ta.sma(volume, 50)

majorLength = input(60, title="Major Length")
minorLength = input(30, title="Minor Length")
src = input(close, title="Source")

smaValue = ta.sma(src, majorLength)

positiveSum = 0.0
negativeSum = 0.0

for i = 0 to minorLength - 1
    price = na(src[i]) ? 0 : src[i]
    avg = na(smaValue[i]) ? 0 : smaValue[i]
    positiveSum := positiveSum + (price > avg ? price - avg : 0)
    negativeSum := negativeSum + (price > avg ? 0 : avg - price)

tii = 100 * positiveSum / (positiveSum + negativeSum)

// Buy condition: 5 EMA crosses above 20 SMA
buyCondition = ta.crossover(ema5, sma20) and tii > 0 and tii >= tii[1]

//and volume > smaVolume10 //

// Track entry price
var entryPrice = 0.0
if (buyCondition)
    entryPrice := close

// Calculate percentage change from entry price
priceChange = close / entryPrice - 1

// Plotting the moving averages on the chart
plot(ema5, color=color.blue, title="5 EMA")
plot(sma20, color=color.red, title="20 SMA")

// Highlighting buy signals and exit signals on the chart
// plotshape(series=buyCondition, title="Buy Signal", location=location.belowbar, color=color.green, size=size.small, style=shape.labelup, text="Buy")

// Strategy entry and exit
if (buyCondition)
    strategy.entry("Buy", strategy.long)

// Exit conditions
if (strategy.opentrades > 0)
    if (priceChange >= 0.05 or priceChange <= -0.05)
        strategy.close("Buy")
Published by ChaoZhang on the FMZ strategy square · last modified 2024-02-02. Collected in the Quant Trading Vault. Unvalidated research: re-test with your own data and costs before trusting it.
Build this with AgenKit
A spec is not a trading system. Paste this into your coding agent and AgenKit runs a specialist team — architecture, test-first build, risk gates, review — with paper trading on by default.
/agenkit build a production-grade trading bot with a backtest engine, risk controls and paper trading by default from strategies/Double-Exponential-Moving-Average-Quant-Trading-Strategy.md- npx agenkit install engineering-kit in your project
- Paste the command into your agent and approve each phase
- Get tests, backtest, risk controls and a paper-trading switch
Understand it first
Before you run this, read the lesson behind the idea and how to backtest it honestly. Specs like this one are the survivors of an unknown number of trials; deflate their results accordingly.
Related specs
- Adaptive Multi Period Trading Strategy Based on Wave Trend Momentum BreakoutPine Script · Breakout · 2h
- BB Breakout StrategyPine Script · Breakout · 1d
- BMSB Breakout Strategy BMSBPine Script · Breakout · 1h
- Bollinger Band T3 Moving Average StrategyPine Script · Breakout · 10m
- Bollinger Bands Dual track Breakthrough StrategyPine Script · Breakout · 30m
- Bollinger Breakout StrategyPine Script · Breakout · 30m