Dual Breakout Volatility Channel Strategy
The dual breakout volatility channel strategy calculates the middle, upper and lower bands of the channel and uses trend and volume indicators to determine market direction and momentum. It sets breakout signals on…
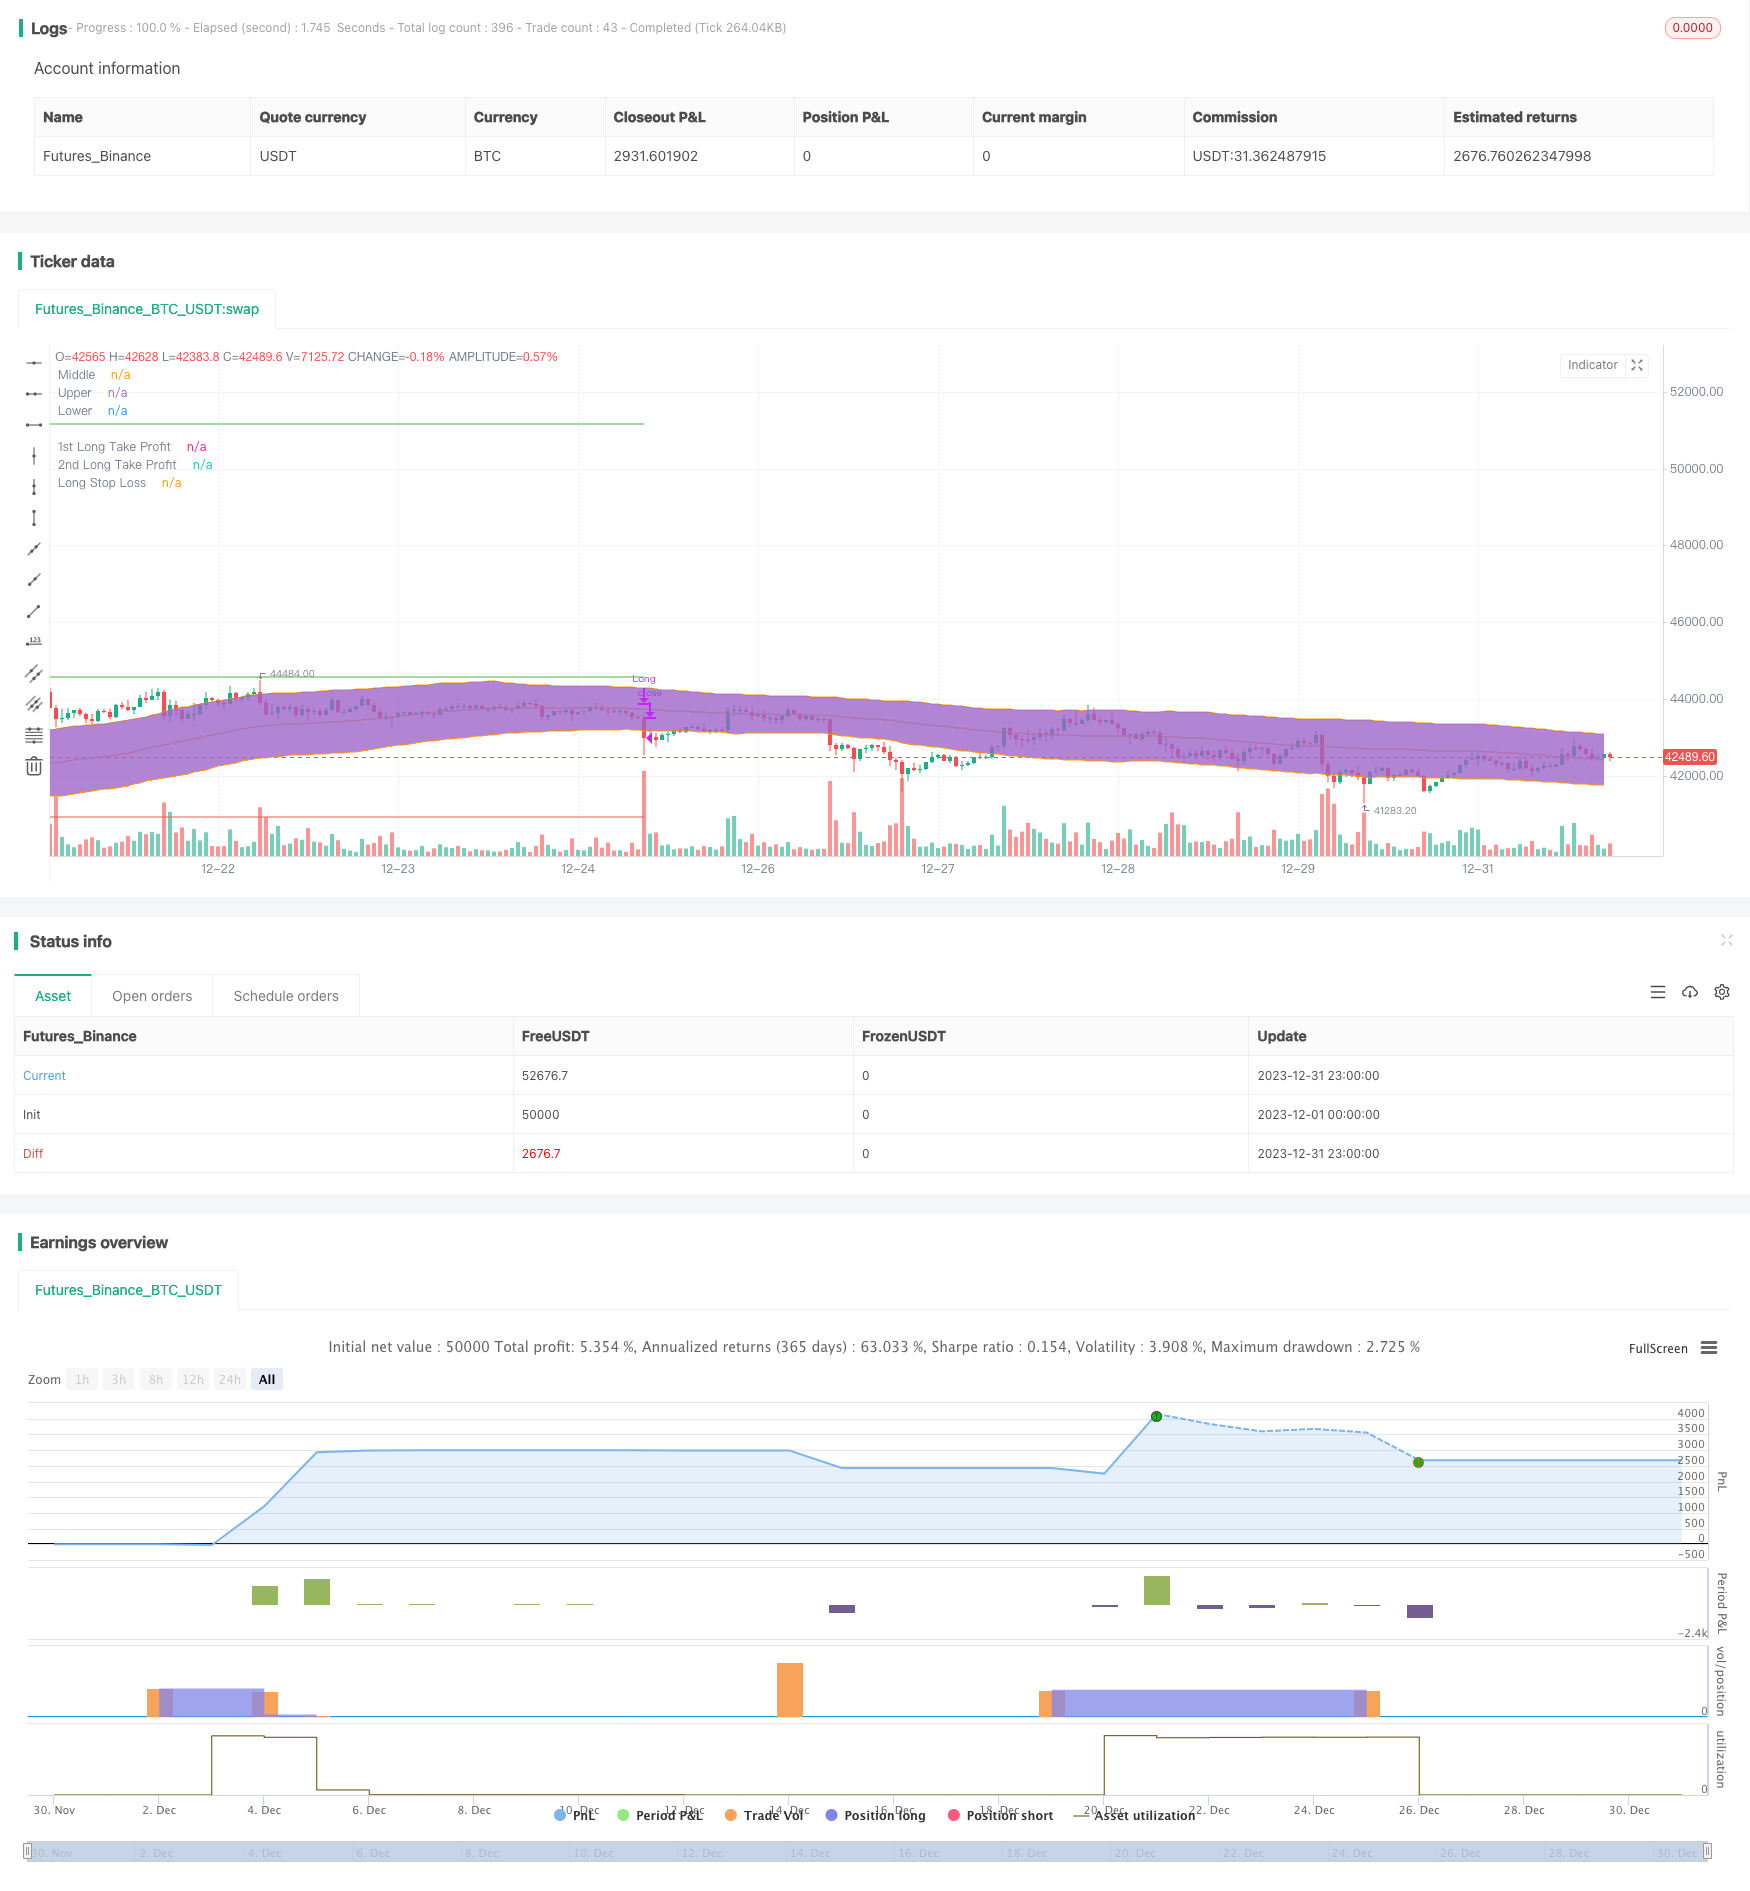
Overview
The dual breakout volatility channel strategy calculates the middle, upper and lower bands of the channel and uses trend and volume indicators to determine market direction and momentum. It sets breakout signals on both sides of the channel to achieve the goal of buying low and selling high.
Strategy Logic
The core indicator of this strategy is the statistically-based volatility channel of candlestick lines. The middle band adopts the moving average algorithm and the upper and lower bands adopt the average true range method to dynamically capture the boundaries of price fluctuations. At the same time, the strategy incorporates DMI and volume criteria to avoid false breakouts.
Specifically, when the price breaks out of the lower rail into the channel, the +DI line of the DMI exceeds the -DI line and the set ADX benchmark, and the trading volume increases, a buy signal is generated. Conversely, when the price breaks through the channel downward from the upper rail, the judgment rules are opposite to the above, generating a sell signal.
Advantage Analysis
The biggest advantage of this strategy is capturing the major breakthrough direction of prices. The dual breakout judgment can effectively avoid sideways and shock markets and reduce the number of stop losses. Compared with simple moving average strategies, the volatility channel breakout judgment is more adaptive to price fluctuations.
In addition, the introduction of auxiliary indicators DMI and volume also plays a good filtering role, avoiding false signals. So from the win rate and profit-loss ratio point of view, the strategy has some advantages.
Risk Analysis
The biggest risk of the dual breakout strategy is that it cannot judge market reversals. If a V-shaped reversal occurs in the market, the stop loss point may be easily triggered. In addition, improper parameter settings can also negatively impact the trading system.
To address the risks, we can further optimize parameter settings and narrow down stop losses to reduce risks. Of course, trading systems can never completely avoid losses, the key is to control risks.
Optimization Directions
The strategy also has great potential for optimization, which can be improved in the following aspects:
Parameter optimization, such as fine tuning of DMI's DI and ADX lengths, period and multiplier settings of volatility channels, etc.
Increase filtering conditions, such as combining MACD and other indicators to avoid false breakouts
Implement automatic tracking of take profit and stop loss to further control risks
Optimize parameter settings and filtering rules for different products
Summary
In general, the dual breakout volatility channel strategy is an effective breakout system. It can effectively determine the main trend direction and momentum, and has great potential in optimization and risk control. If improved and optimized systematically, the strategy can profit steadily in the long run.
Parameters
| Name | Default | What it controls |
|---|---|---|
| v_input_int_1 | 46 | Period |
| v_input_1 | true | useTrueRange |
| v_input_int_2 | 81 | length |
| v_input_float_1 | 2.5 | mult |
| v_input_2 | 19 | DI Length |
| v_input_int_3 | 27 | DMI Benchmark |
| v_input_3 | 2019 | Backtest Start Year |
| v_input_4 | true | Backtest Start Month |
| v_input_5 | true | Backtest Start Day |
| v_input_6 | 9999 | Backtest Stop Year |
| v_input_7 | 12 | Backtest Stop Month |
| v_input_8 | 31 | Backtest Stop Day |
| v_input_float_2 | 4.5 | Long Take Profit 1 % |
| v_input_int_4 | 15 | Long Take Profit 1 Qty |
| v_input_float_3 | 20 | Long Take Profit 2% |
| v_input_int_5 | 100 | Long Take Profit 2 Qty |
| v_input_float_4 | 4 | Long Stop Loss % |
Source Pine Script
/*backtest
start: 2023-12-01 00:00:00
end: 2023-12-31 23:59:59
period: 1h
basePeriod: 15m
exchanges: [{"eid":"Futures_Binance","currency":"BTC_USDT"}]
*/

//Original Idea by: Wunderbit Trading

//@version=5
strategy('Keltner Channel ETH/USDT 1H', overlay=true, initial_capital=1000, pyramiding=0, currency='USD', default_qty_type=strategy.percent_of_equity, default_qty_value=100, commission_type=strategy.commission.percent, commission_value=0.07)


/// TREND
ribbon_period = input.int(46, 'Period', step=1)

leadLine1 = ta.ema(close, ribbon_period)
leadLine2 = ta.sma(close, ribbon_period)

// p3 = plot(leadLine1, color= #53b987, title="EMA", transp = 50, linewidth = 1)
// p4 = plot(leadLine2, color= #eb4d5c, title="SMA", transp = 50, linewidth = 1)
// fill(p3, p4, transp = 60, color = leadLine1 > leadLine2 ? #53b987 : #eb4d5c)

//Upward Trend
UT = leadLine2 < leadLine1
DT = leadLine2 > leadLine1

///////////////////////////////////////INDICATORS

// KELTNER //
source = close
useTrueRange = input(true)
length = input.int(81, step=1, minval=1)
mult = input.float(2.5, step=0.1)

// Calculate Keltner Channel
ma = ta.sma(source, length)
range_1 = useTrueRange ? ta.tr : high - low
rangema = ta.sma(range_1, length)
upper = ma + rangema * mult
lower = ma - rangema * mult

plot(ma, title='Middle', color=color.new(color.orange, 0))
p1 = plot(upper, title='Upper', color=color.new(color.orange, 0))
p2 = plot(lower, title='Lower', color=color.new(color.orange, 0))
fill(p1, p2, transp=90)


// DMI INDICATOR //
adxlen = 10  // input(10, title="ADX Smoothing")
dilen = input(19, title='DI Length')
keyLevel = 23  // input(23, title="key level for ADX")
dirmov(len) =>
    up = ta.change(high)
    down = -ta.change(low)
    truerange = ta.rma(ta.tr, len)
    plus = fixnan(100 * ta.rma(up > down and up > 0 ? up : 0, len) / truerange)
    minus = fixnan(100 * ta.rma(down > up and down > 0 ? down : 0, len) / truerange)
    [plus, minus]

adx(dilen, adxlen) =>
    [plus, minus] = dirmov(dilen)
    sum = plus + minus
    adx = 100 * ta.rma(math.abs(plus - minus) / (sum == 0 ? 1 : sum), adxlen)
    [adx, plus, minus]

[sig, up, down] = adx(dilen, adxlen)

benchmark = input.int(title='DMI Benchmark', defval=27, minval=1, step=1)

// plot(sig, color=color.red, title="ADX")
// plot(up, style=plot.style_histogram, color=color.green, title="+DI")
// plot(down, style=plot.style_histogram, color=color.red, title="-DI")
// plot(keyLevel, color=color.white, title="Key Level")

///////////////////////////////////////////////////////////


////////////////////////////////////////////////////Component Code Start

testStartYear = input(2019, 'Backtest Start Year')
testStartMonth = input(1, 'Backtest Start Month')
testStartDay = input(1, 'Backtest Start Day')
testPeriodStart = timestamp(testStartYear, testStartMonth, testStartDay, 0, 0)

testStopYear = input(9999, 'Backtest Stop Year')
testStopMonth = input(12, 'Backtest Stop Month')
testStopDay = input(31, 'Backtest Stop Day')
testPeriodStop = timestamp(testStopYear, testStopMonth, testStopDay, 0, 0)

testPeriod() => true
///// Component Code Stop //////////////////////////////////////////

//////////////// STRATEGY EXECUTION //////////////////////////

//LONG SET UP
// Take Profit / Stop Loss
long_tp1_inp = input.float(4.5, title='Long Take Profit 1 %', step=0.1) / 100
long_tp1_qty = input.int(15, title='Long Take Profit 1 Qty', step=1)

long_tp2_inp = input.float(20, title='Long Take Profit 2%', step=0.1) / 100
long_tp2_qty = input.int(100, title='Long Take Profit 2 Qty', step=1)

long_take_level_1 = strategy.position_avg_price * (1 + long_tp1_inp)
long_take_level_2 = strategy.position_avg_price * (1 + long_tp2_inp)

long_sl_inp = input.float(4, title='Long Stop Loss %', step=0.1) / 100
long_stop_level = strategy.position_avg_price * (1 - long_sl_inp)


// STRATEGY CONDITION
// LONG
entry_long = open > lower and open < upper and close > upper and up > down and up > benchmark  //  and volume[0] > volume[1]
entry_price_long = ta.valuewhen(entry_long, close, 0)
SL_long = entry_price_long * (1 - long_sl_inp)
exit_long = close < lower or low < SL_long


// STRATEGY EXECUTION
if testPeriod()

    // LONG
    if UT
        strategy.entry(id='Long', direction=strategy.long, when=entry_long, comment='INSERT ENTER LONG COMMAND')
    strategy.exit('TP1', 'Long', qty_percent=long_tp1_qty, limit=long_take_level_1)  // PLACE TAKE PROFIT IN WBT BOT SETTINGS
    strategy.exit('TP2', 'Long', qty_percent=long_tp2_qty, limit=long_take_level_2)  // PLACE TAKE PROFIT IN WBT BOT SETTINGS
    strategy.close(id='Long', when=exit_long, comment='INSERT EXIT LONG COMMAND')


//PLOT FIXED SLTP LINE
// LONG POSITION
plot(strategy.position_size > 0 ? long_take_level_1 : na, style=plot.style_linebr, color=color.new(color.green, 0), linewidth=1, title='1st Long Take Profit')
plot(strategy.position_size > 0 ? long_take_level_2 : na, style=plot.style_linebr, color=color.new(color.green, 0), linewidth=1, title='2nd Long Take Profit')
plot(strategy.position_size > 0 ? long_stop_level : na, style=plot.style_linebr, color=color.new(color.red, 0), linewidth=1, title='Long Stop Loss')
Published by ChaoZhang on the FMZ strategy square · last modified 2024-01-31. Collected in the Quant Trading Vault. Unvalidated research: re-test with your own data and costs before trusting it.
Build this with AgenKit
A spec is not a trading system. Paste this into your coding agent and AgenKit runs a specialist team — architecture, test-first build, risk gates, review — with paper trading on by default.
/agenkit build a production-grade trading bot with a backtest engine, risk controls and paper trading by default from strategies/Dual-Breakout-Volatility-Channel-Strategy.md- npx agenkit install engineering-kit in your project
- Paste the command into your agent and approve each phase
- Get tests, backtest, risk controls and a paper-trading switch
Understand it first
Before you run this, read the lesson behind the idea and how to backtest it honestly. Specs like this one are the survivors of an unknown number of trials; deflate their results accordingly.
Related specs
- Momentum Breakout Trading Strategy 440964Pine Script · Breakout · 5m
- Moving Average Crossover and Upper Rail Breakthrough Impulse StrategyPine Script · Breakout · 1m
- Quantitative Trading Price Breakthrough StrategyPine Script · Breakout · 1d
- Quantitative Trading Strategy Based on Ichimoku with Multiple SignalsPine Script · Breakout · 1h
- Multi Technical Indicator Trend Following Channel Breakout Trading Strategy with Candlestick Pattern Filtering SystemPine Script · Breakout · 1h
- Volatility Breakthrough StrategyPine Script · Breakout · 10m