Strategy vault / Trend following
Dual MACD Trend Confirmation Trading System
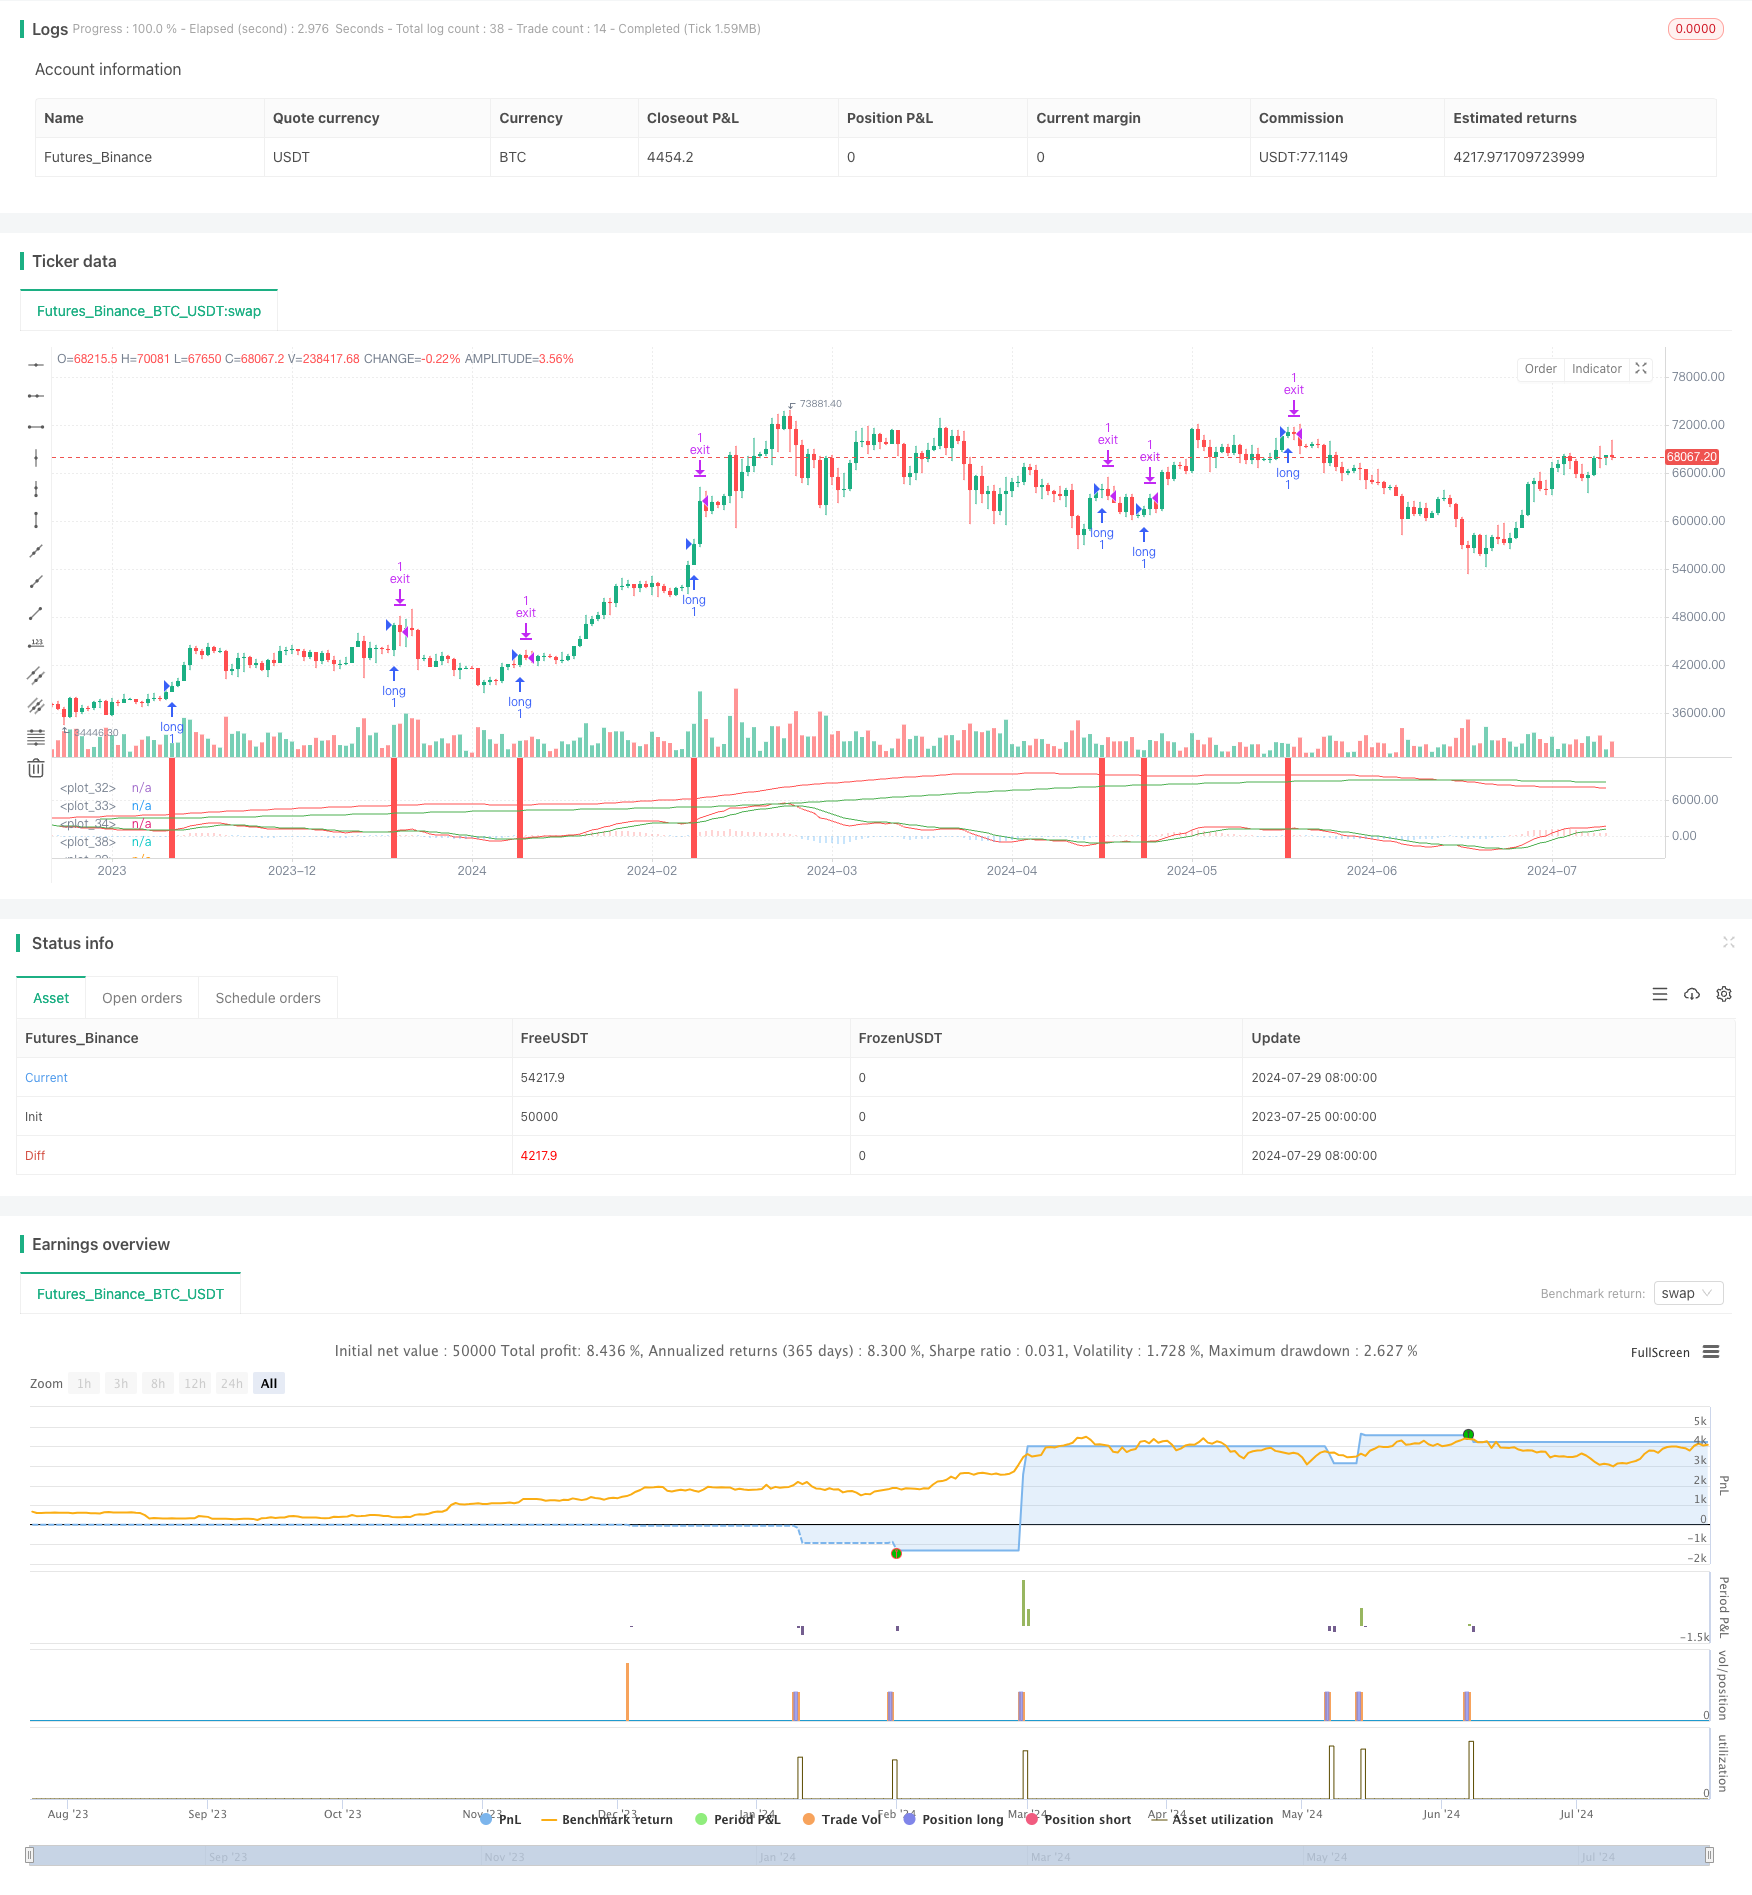
This strategy is a trading system based on the MACD indicator, combining MACD indicators from two time periods to make trading decisions. The strategy primarily uses the 5-minute MACD indicator to find entry…
Overview
This strategy is a trading system based on the MACD indicator, combining MACD indicators from two time periods to make trading decisions. The strategy primarily uses the 5-minute MACD indicator to find entry opportunities, while using the 1-hour MACD indicator to confirm the overall market trend. This dual confirmation mechanism aims to improve the accuracy and reliability of trades. The strategy also includes fixed profit targets and stop-loss settings to manage risk and lock in profits.
Strategy Principles
The core principle of this strategy is to utilize MACD indicators from different time periods to capture market trends and trading opportunities. Specifically:
5-minute MACD: Used to find specific entry signals. A buy signal is generated when the MACD line crosses above the signal line.
1-hour MACD: Used to confirm the overall market trend. The market is considered to be in an uptrend only when the 1-hour MACD histogram is positive.
Entry Conditions: The strategy executes a buy operation only when the 5-minute MACD generates a buy signal and the 1-hour MACD confirms an uptrend.
Risk Management: The strategy sets fixed profit targets (100 points) and stop-loss (20 points) to manage the risk of each trade.
Position Management: A fixed trading volume of 100 units is used for each trade.
Strategy Advantages
Multi-period Confirmation: By combining short-term (5-minute) and long-term (1-hour) MACD indicators, the strategy can more comprehensively assess market trends, reducing false signals.
Trend Following: The strategy design adheres to the principle of "following the trend," only buying when the overall trend is confirmed to be upward, increasing the success rate of trades.
Clear Risk Management: Fixed take-profit and stop-loss settings help control the risk of each trade, preventing single trades from causing excessive losses.
Automated Execution: The strategy can be automatically executed on trading platforms, reducing emotional interference and improving trading discipline.
Adjustable Parameters: The strategy allows users to adjust MACD parameters according to personal preferences and market characteristics, increasing flexibility.
Strategy Risks
Lagging Nature: MACD is a lagging indicator, which may result in delayed signals in rapidly changing markets, leading to untimely entries or exits.
Unsuitable for Ranging Markets: In sideways, choppy markets, the strategy may frequently generate false signals, resulting in consecutive losses.
Fixed Stop-Loss May Be Insufficient: In highly volatile markets, a 20-point fixed stop-loss may not be sufficient to handle sudden large fluctuations.
Only Considers Long Positions: The strategy is designed only for long trades, ignoring short opportunities, potentially missing out on some profit opportunities.
Parameter Sensitivity: The choice of MACD parameters significantly impacts strategy performance, and different markets or periods may require different parameter settings.
Strategy Optimization Directions
Dynamic Stop-Loss: Consider introducing a dynamic stop-loss mechanism based on ATR or volatility to adapt to different market environments.
Add Short-Selling Logic: Expand the strategy to include short trades, fully utilizing two-way market opportunities.
Incorporate Volume Analysis: Combine volume indicators such as OBV or CMF to enhance signal reliability.
Optimize Position Management: Consider dynamic position management based on account equity or risk assessment, rather than fixed trading volume.
Add Filtering Conditions: Introduce additional technical or market sentiment indicators, such as RSI or VIX, to reduce false signals.
Backtesting and Optimization: Conduct extensive backtesting on different markets and time periods to optimize MACD parameters and other strategy parameters.
Consider Fundamental Factors: Set trading restrictions or adjust strategy parameters during important economic data releases or events.
Conclusion
The Dual MACD Trend Confirmation Trading System is a quantitative trading strategy that combines short-term and long-term market trend analysis. By utilizing MACD indicators from different time periods, the strategy aims to capture market trends and trade when trends are established. Fixed risk management rules and automated execution features make it a relatively robust trading system. However, like all trading strategies, it also faces some inherent risks and limitations.
To further improve the strategy's effectiveness and adaptability, traders are advised to consider introducing dynamic stop-loss mechanisms, expanding short-selling logic, optimizing position management, and incorporating other technical and fundamental analysis tools. Continuous backtesting and parameter optimization are crucial for maintaining the strategy's effectiveness. Finally, traders should always remember that there is no perfect trading strategy, and risk management and continuous learning are key to long-term success.
Source Pine Script
/*backtest
start: 2023-07-25 00:00:00
end: 2024-07-30 00:00:00
period: 1d
basePeriod: 1h
exchanges: [{"eid":"Futures_Binance","currency":"BTC_USDT"}]
*/

//5Minute ChartでUse scenarios

//@version=5
strategy(title='MACD5Divide IN, one-hour strength determination', shorttitle='MACDストラテジー', overlay=false)
//overlay true:チャートupperにDisplay felse:don'tウィンドにDisplay

//================
//Orderポイント
//================

//Input SectionをCreate
//inputFunctionでSetting screenにEntry projectsをAddできる
//typeInput formのSettings,defvalInitial setting value,minvalMinimum setting value
FastLength = input.int(title='Number of short-term lines', defval=12, minval=1)
SlowLength = input.int(title='Number of long-term lines', defval=26, minval=1)
SignalLength = input.int(title='シグナルNumber of items', defval=9, minval=1)

FastLength1 = input.int(title='Number of short-term lines', defval=144, minval=1)
SlowLength1 = input.int(title='Number of long-term lines', defval=312, minval=1)
SignalLength1 = input.int(title='シグナルNumber of items', defval=108, minval=1)
//One time is enoughでDetermination of strength and weaknessのため5Minute ChartのNumberを12times

//MACDのCalculate エントリー
[MACD, MACDSignal, MACDosc] = ta.macd(close, FastLength, SlowLength, SignalLength)
//MACDのCalculation Strength Determination
[MACD1, MACDSignal1, MACDosc1] = ta.macd(close, FastLength1, SlowLength1, SignalLength1)

//プロット エントリー
//plotScreen display,MACDCalculateからMACDラインとシグナルラインをDisplay
//linewidthでラインのtooさChange
//style_histogramでヒストグラムDisplay, color = MACDosc < 0のJudgment TypeでColor Change
plot(MACD, color=color.new(color.red, 0), linewidth=1)
plot(MACDSignal, color=color.new(color.green, 0))
plot(MACDosc, style=plot.style_histogram, linewidth=3, color=MACDosc < 0 ? color.new(color.blue, 50) : color.new(color.red, 50))

//プロット Determination of phase field strength
//One time is enoughのindicates creation
plot(MACD1, color=color.new(color.red, 0), linewidth=1)
plot(MACDSignal1, color=color.new(color.green, 0))

//buyいポイント
//crossover(x,y)yをxがUpper breakけ
BuyPoint_MACDGC = ta.crossover(MACD, MACDSignal)
//ヒストグラムのValueがプラスのCaseGCmiddleとJudgment
BuyPoint_crossnow = MACDosc1 > 0
//5Minute ChartMACDGCかつ1Time FootがGCmiddle,conditionはEndにandAddでCondition addition is possible
BuyPoint = BuyPoint_MACDGC and BuyPoint_crossnow

//buyいポイントにBackground ColorをSettings
bgcolor(BuyPoint ? color.red : color.new(color.green, 100), transp=90)

//================
//Settlementポイント
//================
//100Yen breakいたらOUT,20Below yenがったらCutting losses
ProfitDelta = 100
LossDelta = 20

//================
//Number of sheets
//================
Size = 1

//================
//Order・Settlement
//================
//strategy.entryでエントリー,qtyでサイズSpecify,
//エントリータイミングThis timeは46LineBuyPoint = BuyPoint_MACDGC and BuyPoint_crossnow
if BuyPoint
    strategy.entry(id='long', direction=strategy.long, qty=Size)
//profitProfit takingまでのWidth,lossCutting lossesまでのWidth(stopというのでMoving average lineにReachしたらなどのDamage and cutting settingsなどもPossible)
strategy.exit(id='exit', from_entry='long', profit=ProfitDelta, loss=LossDelta)
Published by ChaoZhang on the FMZ strategy square · last modified 2024-07-31. Collected in the Quant Trading Vault. Unvalidated research: re-test with your own data and costs before trusting it.
Build this with AgenKit
A spec is not a trading system. Paste this into your coding agent and AgenKit runs a specialist team — architecture, test-first build, risk gates, review — with paper trading on by default.
/agenkit build a production-grade trading bot with a backtest engine, risk controls and paper trading by default from strategies/Dual-MACD-Trend-Confirmation-Trading-System.md- npx agenkit install engineering-kit in your project
- Paste the command into your agent and approve each phase
- Get tests, backtest, risk controls and a paper-trading switch
Understand it first
Before you run this, read the lesson behind the idea and how to backtest it honestly. Specs like this one are the survivors of an unknown number of trials; deflate their results accordingly.
Related specs
- Adaptive ATR and RSI Trend Following Strategy with Trailing Stop LossPine Script · Trend following · 1h
- Adaptive Bollinger Bands Trend Tracking StrategyPine Script · Trend following · 1h
- Adaptive Price Crossing Moving Average Trading StrategyPine Script · Trend following · 1d
- Advanced Multi Indicator Multi Dimensional Trend Cross Quantitative StrategyPine Script · Trend following · 3h
- Advanced Supertrend Indicator Trading Mechanism Optimization StrategyPine Script · Trend following · 1d
- Bollinger Bands and RSI Trend Following StrategyPine Script · Trend following · 1h