Strategy vault / Trend following
Dual Moving Average Channel Trading Strategy
The dual moving average channel trading strategy is a trend trading strategy that tracks crossovers between double moving averages. The strategy uses Exponential Moving Average (EMA) and Weighted Moving Average (WMA)…
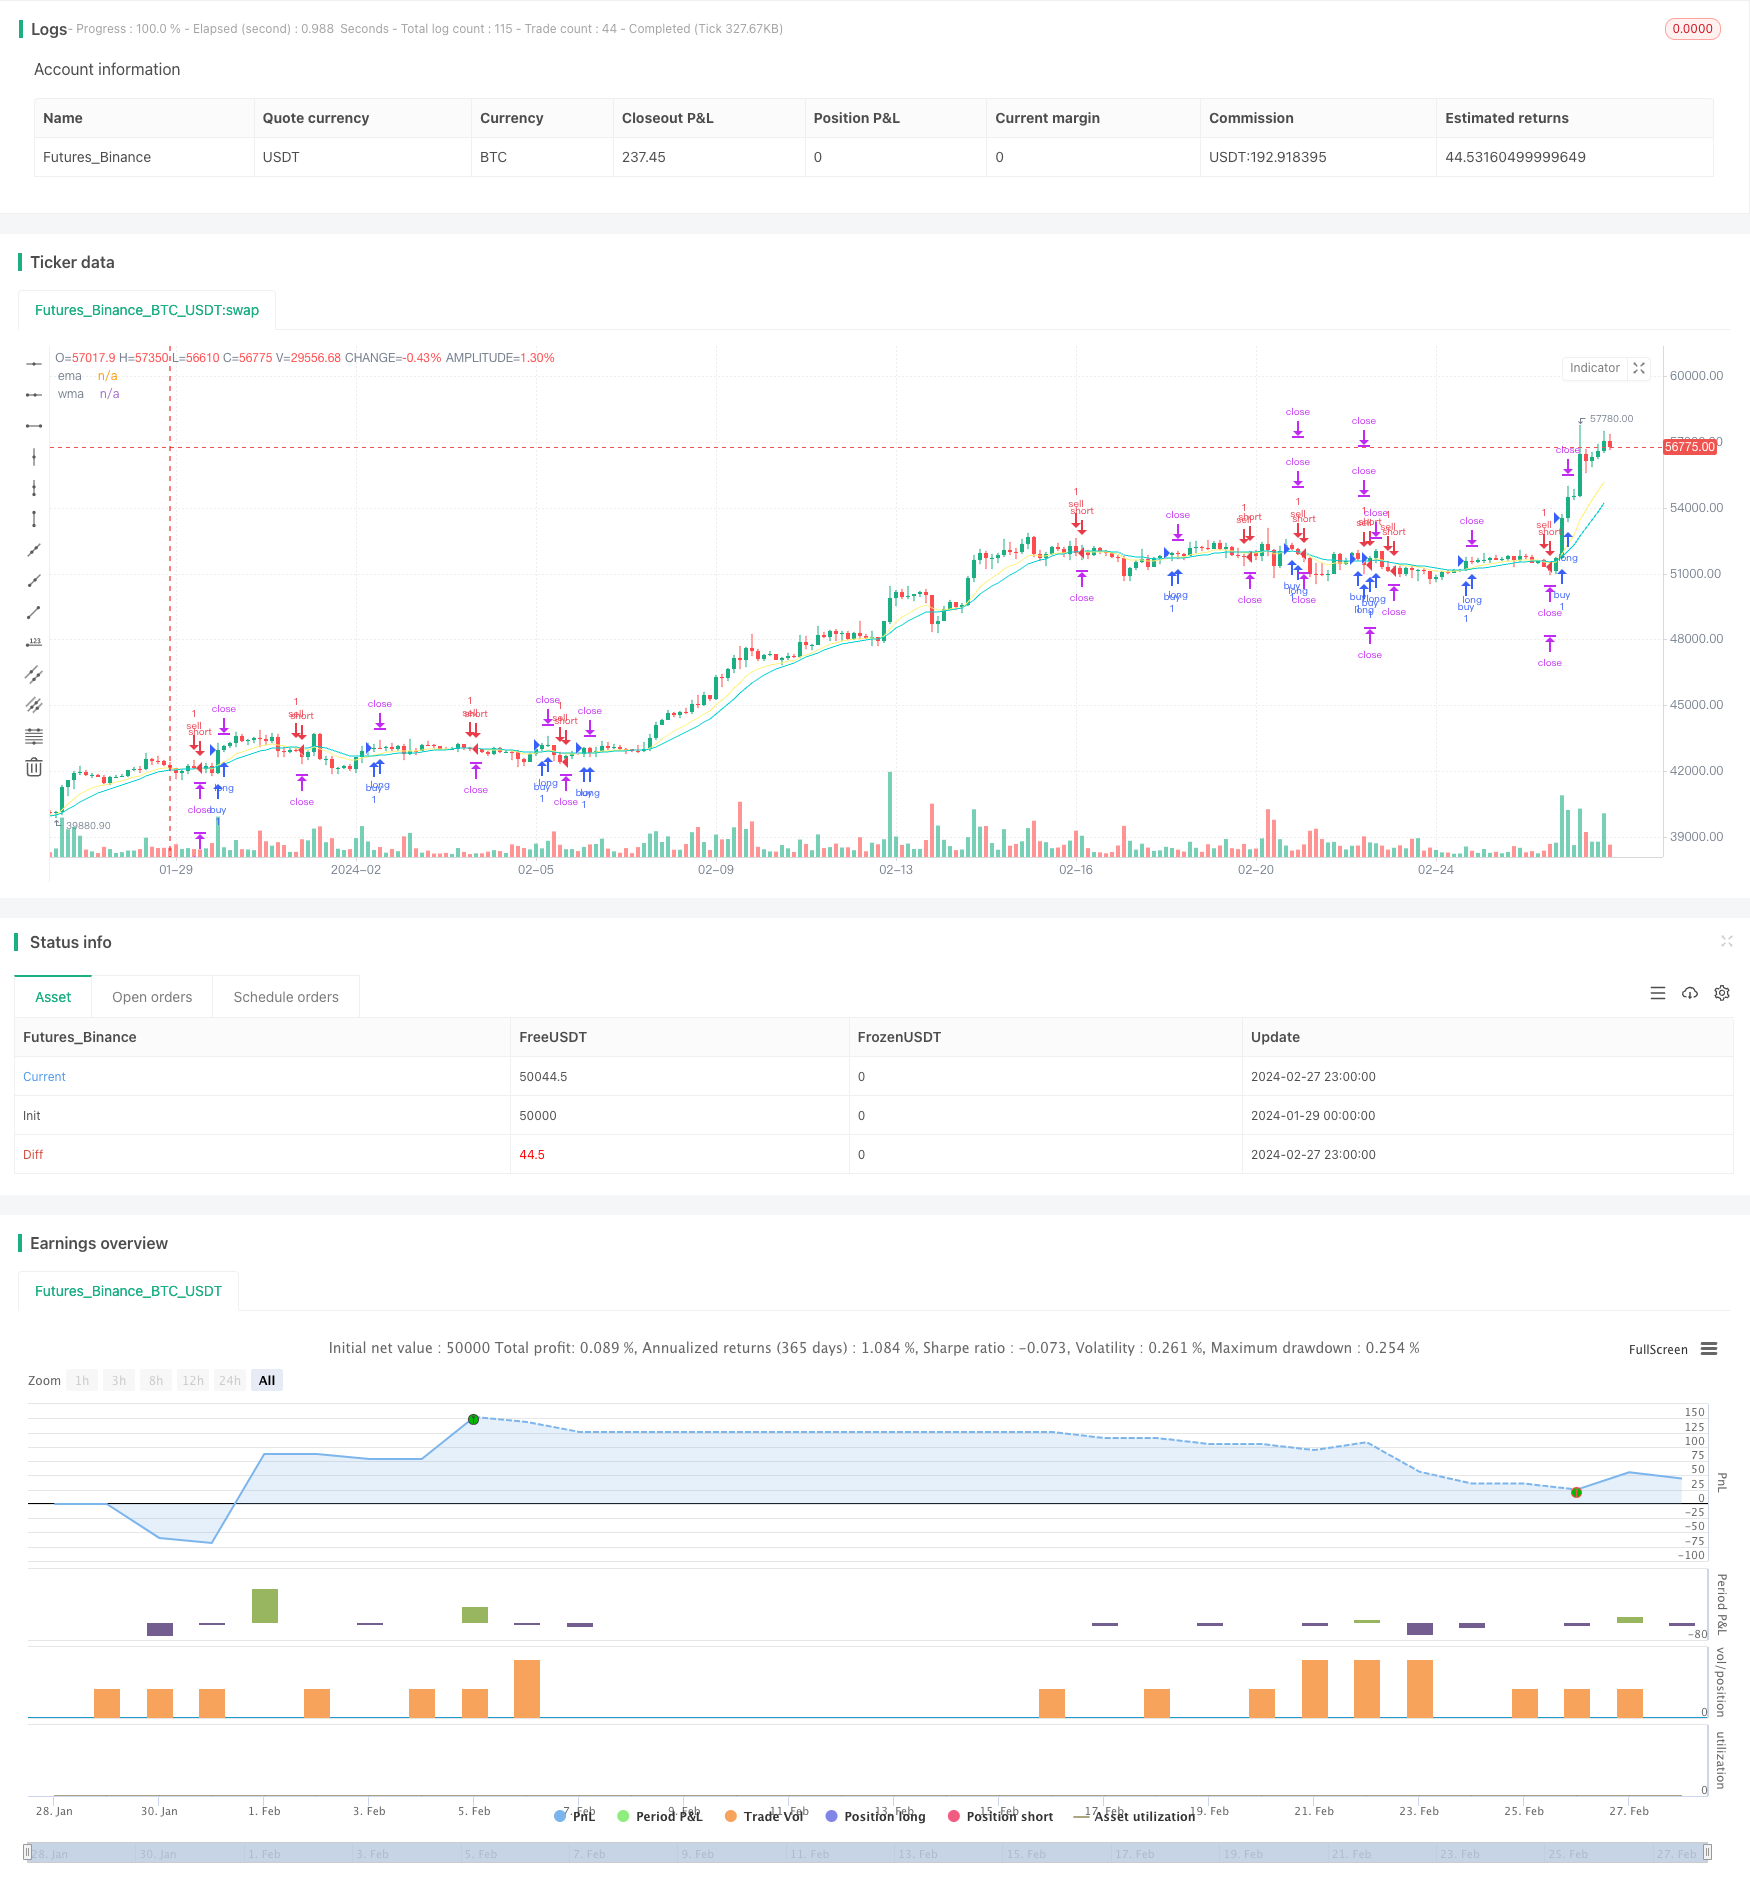
Overview
The dual moving average channel trading strategy is a trend trading strategy that tracks crossovers between double moving averages. The strategy uses Exponential Moving Average (EMA) and Weighted Moving Average (WMA) as trading signal indicators. When the short-term EMA crosses above the long-term WMA, the strategy goes long. When the short-term EMA crosses below the long-term WMA, the strategy goes short.
Strategy Logic
The trading signals of this strategy come from the golden cross and death cross between the 10-period short-term EMA and the 20-period long-term WMA. When the short-term EMA crosses above the long-term WMA, it indicates the market is reversing up, thus going long. When the short-term EMA crosses below the long-term WMA, it indicates the market is reversing down, thus going short.
After determining the trading direction, the strategy sets the stop loss below or above the entry price by 1 ATR period, with two take profits - the first take profit is set at 1 ATR above or below the entry price, and the second take profit is set at 2 ATRs above or below the entry price. When the first take profit is triggered, 50% of the position will be closed. The remaining position will keep running towards the second take profit or with a trailing stop loss.
The trailing stop loss logic - it will be activated once the highest price or the lowest price has reached the first take profit level. According to realtime bar update, the stop loss will be trailed between the maximum profit point and entry price as the protection to avoid loss and lock in profit along the way.
Advantage
The strategy utilizes the dual smoothing noise reduction feature of moving averages to effectively filter out random fluctuations in the market and identify medium-to-long-term trend signals, thus avoiding being caught in whipsaws. In addition, the two staged take profits increase the profit zone of the strategy and maximize profits. The trailing stop mechanism also allows the strategy to lock in profits and reduce losses.
Risks
Moving averages themselves have greater lagging, which poses the risk of missing signals. The crossover between double moving averages may also generate excessive false signals in certain markets, causing losses.
The stop loss setting is an important component of the strategy. If the stop loss is too small, it is prone to be hit by market noise. If the stop loss is too large, it may fail to effectively control risks.
In addition, when the market fluctuates violently, the trailing stop may not work very well in protection.
Optimization Directions
Test EMAs and WMAs with different parameters to find the optimal parameter combination. Overly short EMAs or overly long WMAs could both impact strategy performance.
Choose fixed points or ATR multiple stop loss based on different product characteristics and trading styles.
Test the effects of partial position trailing stop and full position trailing stop.
Introduce other indicators for signal filtering to assist EMA and WMA, so as to improve signal quality.
Summary
In general, the dual moving average channel trading strategy is relatively robust and performs well in trending markets. By optimizing parameters, stop loss mechanisms, and improving signal quality, the real trading performance of this strategy can be further enhanced. This is a promising strategy idea that is worth in-depth research and application in actual trading.
Parameters
| Name | Default | What it controls |
|---|---|---|
| v_input_1 | true | Buy |
| v_input_2 | true | Sell |
| v_input_3 | 2020 | Start year |
| v_input_4 | true | Start month |
| v_input_5 | true | Start day |
| v_input_6 | false | Start hour |
| v_input_7 | false | Start minute |
| v_input_8 | false | set end time? |
| v_input_9 | 3019 | end year |
| v_input_10 | 12 | end month |
| v_input_11 | 31 | end day |
| v_input_12 | 23 | end hour |
| v_input_13 | 59 | end minute |
| v_input_14 | 10 | EMA period |
| v_input_15 | 20 | WMA period |
| v_input_16 | 20 | pip |
Source Pine Script
/*backtest
start: 2024-01-29 00:00:00
end: 2024-02-28 00:00:00
period: 3h
basePeriod: 15m
exchanges: [{"eid":"Futures_Binance","currency":"BTC_USDT"}]
*/

// This source code is subject to the terms of the Mozilla Public License 2.0 at https://mozilla.org/MPL/2.0/
// © gpadihar

//@version=4
strategy("SL1 Pips after TP1 (MA)", commission_type=strategy.commission.cash_per_order, overlay=true)

// Strategy
Buy  = input(true)
Sell = input(true)

// Date Range
start_year    = input(title='Start year'   ,defval=2020)
start_month   = input(title='Start month'  ,defval=1)
start_day     = input(title='Start day'    ,defval=1)
start_hour    = input(title='Start hour'   ,defval=0)
start_minute  = input(title='Start minute' ,defval=0)
end_time      = input(title='set end time?',defval=false)
end_year      = input(title='end year'     ,defval=3019)
end_month     = input(title='end month'    ,defval=12)
end_day       = input(title='end day'      ,defval=31)
end_hour      = input(title='end hour'     ,defval=23)
end_minute    = input(title='end minute'   ,defval=59)

// MA
ema_period = input(title='EMA period',defval=10)
wma_period = input(title='WMA period',defval=20)
ema        = ema(close,ema_period)
wma        = wma(close,wma_period)

// Entry Condition
buy =
 crossover(ema,wma) and
 nz(strategy.position_size) == 0 and Buy and
 time > timestamp(start_year, start_month, start_day, start_hour, start_minute) and
 (end_time?(time < timestamp(end_year, end_month, end_day, end_hour, end_minute)):true)

sell =
 crossunder(ema,wma) and
 nz(strategy.position_size) == 0 and Sell and
 time > timestamp(start_year, start_month, start_day, start_hour, start_minute) and
 (end_time?(time < timestamp(end_year, end_month, end_day, end_hour, end_minute)):true)

// Pips
pip = input(20)*10*syminfo.mintick

// Trading parameters //
var bool  LS  = na
var bool  SS  = na
var float EP  = na
var float TVL = na
var float TVS = na
var float TSL = na
var float TSS = na
var float TP1 = na
var float TP2 = na
var float SL1 = na
var float SL2 = na

if buy or sell and strategy.position_size == 0
    EP  := close
    SL1 := EP - pip     * (sell?-1:1)
    SL2 := EP - pip     * (sell?-1:1)
    TP1 := EP + pip     * (sell?-1:1)
    TP2 := EP + pip * 2 * (sell?-1:1)

// current trade direction
LS := buy  or strategy.position_size > 0
SS := sell or strategy.position_size < 0

// adjust trade parameters and trailing stop calculations
TVL := max(TP1,open) - pip[1]
TVS := min(TP1,open) + pip[1]
TSL := open[1] > TSL[1] ? max(TVL,TSL[1]):TVL
TSS := open[1] < TSS[1] ? min(TVS,TSS[1]):TVS

if LS and high > TP1
    if open <= TP1
        SL2:=min(EP,TSL)

if SS and low < TP1
    if open >= TP1
        SL2:=max(EP,TSS)

// Closing conditions
close_long  = LS and open < SL2
close_short = SS and open > SL2

// Buy
strategy.entry("buy"  , strategy.long, when=buy and not SS)
strategy.exit ("exit1", from_entry="buy", stop=SL1, limit=TP1, qty_percent=50)
strategy.exit ("exit2", from_entry="buy", stop=SL2, limit=TP2)

// Sell
strategy.entry("sell" , strategy.short, when=sell and not LS)
strategy.exit ("exit3", from_entry="sell", stop=SL1, limit=TP1, qty_percent=50)
strategy.exit ("exit4", from_entry="sell", stop=SL2, limit=TP2)

// Plots
a=plot(strategy.position_size >  0 ? SL1 : na, color=#dc143c, style=plot.style_linebr)
b=plot(strategy.position_size <  0 ? SL1 : na, color=#dc143c, style=plot.style_linebr)
c=plot(strategy.position_size >  0 ? TP1 : na, color=#00ced1, style=plot.style_linebr)
d=plot(strategy.position_size <  0 ? TP1 : na, color=#00ced1, style=plot.style_linebr)
e=plot(strategy.position_size >  0 ? TP2 : na, color=#00ced1, style=plot.style_linebr)
f=plot(strategy.position_size <  0 ? TP2 : na, color=#00ced1, style=plot.style_linebr)
g=plot(strategy.position_size >= 0 ? na  : EP, color=#ffffff, style=plot.style_linebr)
h=plot(strategy.position_size <= 0 ? na  : EP, color=#ffffff, style=plot.style_linebr)

plot(ema,title="ema",color=#fff176)
plot(wma,title="wma",color=#00ced1)
Published by ChaoZhang on the FMZ strategy square · last modified 2024-02-29. Collected in the Quant Trading Vault. Unvalidated research: re-test with your own data and costs before trusting it.
Build this with AgenKit
A spec is not a trading system. Paste this into your coding agent and AgenKit runs a specialist team — architecture, test-first build, risk gates, review — with paper trading on by default.
/agenkit build a production-grade trading bot with a backtest engine, risk controls and paper trading by default from strategies/Dual-Moving-Average-Channel-Trading-Strategy.md- npx agenkit install engineering-kit in your project
- Paste the command into your agent and approve each phase
- Get tests, backtest, risk controls and a paper-trading switch
Understand it first
Before you run this, read the lesson behind the idea and how to backtest it honestly. Specs like this one are the survivors of an unknown number of trials; deflate their results accordingly.
Related specs
- ATR Dynamic Trend Following and EMA Crossover Trading StrategyPine Script · Trend following · 1d
- ATR and Moving Average Crossover Hybrid StrategyPine Script · Trend following · 1h
- ATR and T3 Moving Average StrategyPine Script · Trend following · 5m
- Adaptive ATR and RSI Trend Following Strategy with Trailing Stop LossPine Script · Trend following · 1h
- Bollinger Bands and RSI Trend Following StrategyPine Script · Trend following · 1h
- Dual ATR Channel Trend Following StrategyPine Script · Trend following · 15m