Strategy vault / Trend following
Dual Moving Average Crossover MACD Trend Following Strategy
This strategy is an automated trading strategy based on the dual moving average crossover of the MACD technical indicator. It utilizes the signal line crossover of MACD to determine the trend direction for trend…
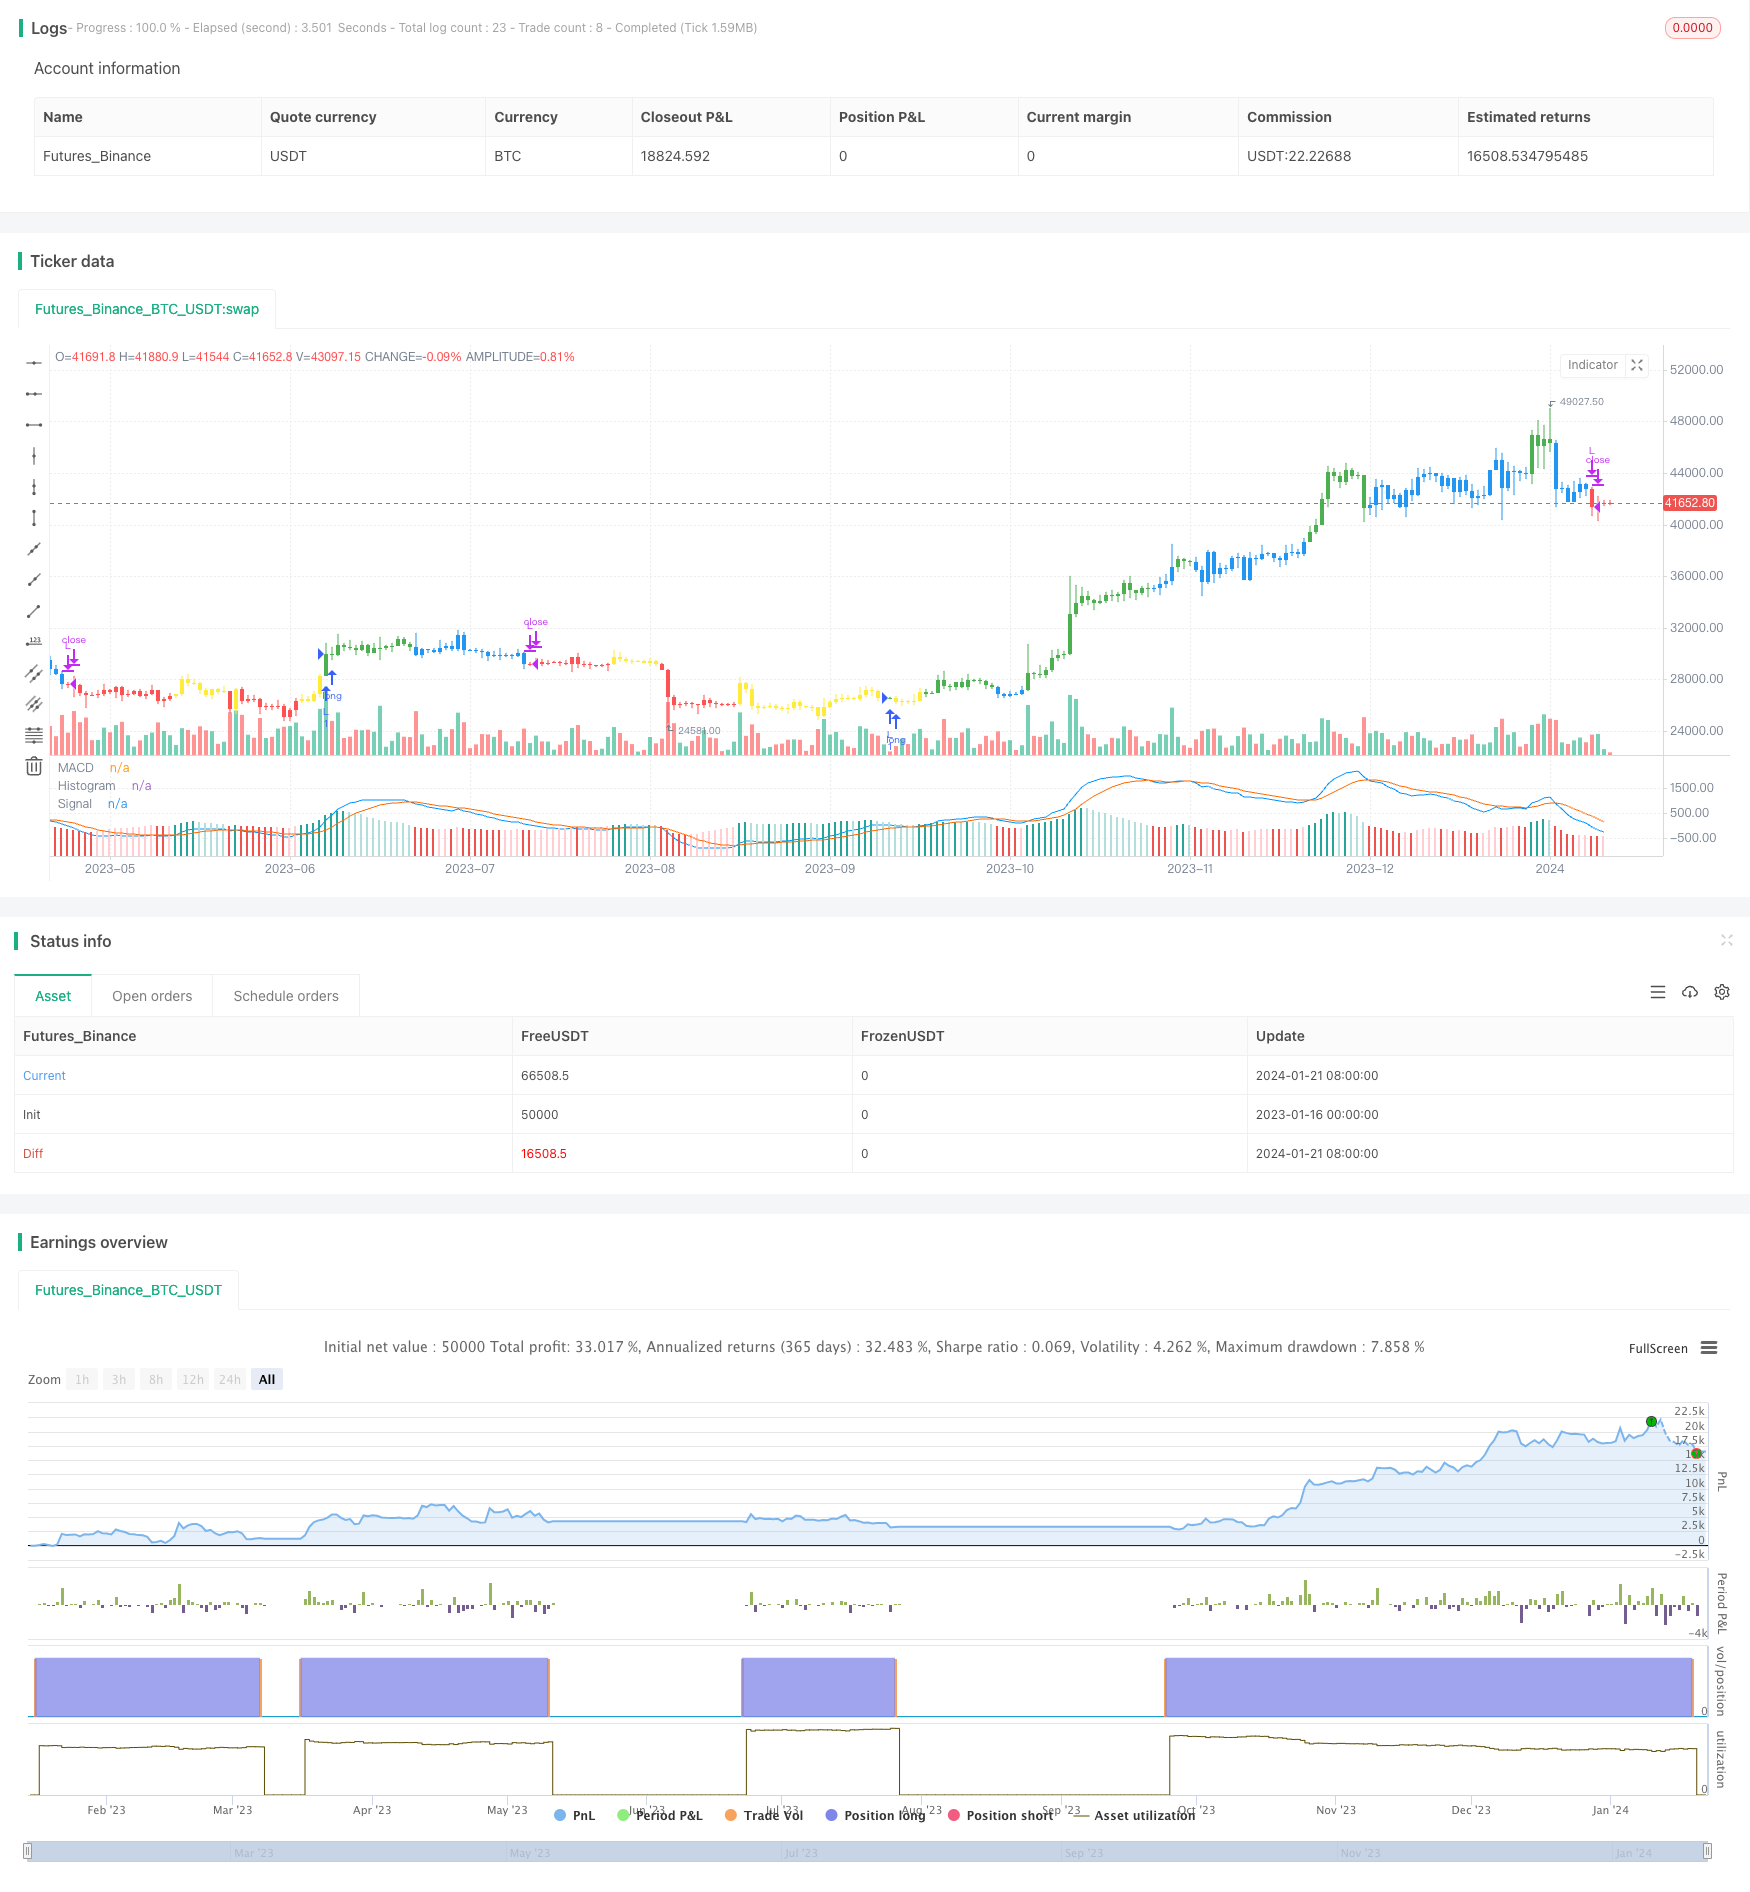
Overview
This strategy is an automated trading strategy based on the dual moving average crossover of the MACD technical indicator. It utilizes the signal line crossover of MACD to determine the trend direction for trend following.
Strategy Logic
The strategy first calculates the three lines of the MACD indicator: fast line, slow line and histogram. The fast line is a faster moving average over a shorter period while the slow line is a slower moving average over a longer period. The histogram is the difference between the fast and slow lines. When the fast line crosses above the slow line, it is a golden cross signal indicating a buy signal. When the fast line crosses below the slow line, it is a death cross signal indicating a sell signal.
The strategy utilizes this logic to go long on golden crosses and close position on death crosses; or go short on death crosses and close position on golden crosses to automatically follow the trend. Meanwhile, the strategy also judges if the absolute MACD line is positive or negative to avoid false signals and ensure truly capturing trend reversal points.
Advantages of the Strategy
- Utilizes dual moving average crossover to determine trend direction accurately and capture trend reversal
- MACD technical indicator reduces false signals and improves signal quality
- Flexibility to go long or short or only long/short
- Adjustable parameters cater to different market environments
Risks of the Strategy
- Dual moving average crossover has lagging effect, may miss partial profits at the beginning of reversals
- MACD indicator prone to false signals during market consolidation
- Parameters need proper adjustment to avoid overly sensitive or inert
Risk Mitigations:
- Combine with other indicators to filter signals
- Tune parameters to lower trading frequency
- Only adopt the strategy when trend is obvious
Enhancement Areas
The strategy can be enhanced from the following aspects:
Incorporate other indicators like KDJ, Bollinger Bands etc to confirm signals and filter false signals
Improve entry mechanism, e.g. add breakout filter to avoid premature or late entries
Optimize parameter settings, adjust fast and slow line periods based on different timeframes and market regimes
Add stop loss to control single trade loss
Expand to other products like forex, crypto currencies etc
Summary
The dual moving average crossover MACD trend following strategy utilizes MACD indicator to determine trend direction combined with signal line crossovers to effectively filter signals and capture trend reversals for automated trend following. The advantages lie in accurate trend judgment, flexible parameter tuning catering to market environments. Risk management is important to avoid false signals. Further optimizations with additional technical indicators and parameter tuning can improve strategy performance.
Parameters
| Name | Default | What it controls |
|---|---|---|
| v_input_1 | 0 | Long/Short: Long only | Short only | Both |
| v_input_2 | 12 | Fast Length |
| v_input_3 | 26 | Slow Length |
| v_input_4_close | 0 | Source: close | high | low | open | hl2 | hlc3 | hlcc4 | ohlc4 |
| v_input_5 | 9 | Signal Smoothing |
| v_input_6 | false | Simple MA(Oscillator) |
| v_input_7 | false | Simple MA(Signal Line) |
| v_input_8 | 2019 | From Year |
| v_input_9 | true | From Month |
| v_input_10 | true | From Day |
| v_input_11 | 9999 | To Year |
| v_input_12 | 12 | To Month |
| v_input_13 | 31 | To Day |
Source Pine Script
/*backtest
start: 2023-01-16 00:00:00
end: 2024-01-22 00:00:00
period: 1d
basePeriod: 1h
exchanges: [{"eid":"Futures_Binance","currency":"BTC_USDT"}]
*/

// This source code is subject to the terms of the Mozilla Public License 2.0 at https://mozilla.org/MPL/2.0/
// © DeMindSET

//@version=4
strategy("MACD Trend Follow Strategy", overlay=false)
// Getting inputs
LSB = input(title="Long/Short", defval="Long only", options=["Long only", "Short only" , "Both"])
fast_length = input(title="Fast Length", type=input.integer, defval=12)
slow_length = input(title="Slow Length", type=input.integer, defval=26)
src = input(title="Source", type=input.source, defval=close)
signal_length = input(title="Signal Smoothing", type=input.integer, minval = 1, maxval = 50, defval = 9)
sma_source = input(title="Simple MA(Oscillator)", type=input.bool, defval=false)
sma_signal = input(title="Simple MA(Signal Line)", type=input.bool, defval=false)

// Plot colors
col_grow_above = #26A69A
col_grow_below = #FFCDD2
col_fall_above = #B2DFDB
col_fall_below = #EF5350
col_macd = #0094ff
col_signal = #ff6a00

// Calculating
fast_ma = sma_source ? sma(src, fast_length) : ema(src, fast_length)
slow_ma = sma_source ? sma(src, slow_length) : ema(src, slow_length)
macd = fast_ma - slow_ma
signal = sma_signal ? sma(macd, signal_length) : ema(macd, signal_length)
hist = macd - signal

plot(hist, title="Histogram", style=plot.style_columns, color=(hist>=0 ? (hist[1] < hist ? col_grow_above : col_fall_above) : (hist[1] < hist ? col_grow_below : col_fall_below) ), transp=0 )
plot(macd, title="MACD", color=col_macd, transp=0)
plot(signal, title="Signal", color=col_signal, transp=0)
//
Bull= macd > signal
Bear= macd < signal
ConBull=macd>0
ConBear=macd<0
//
Green= Bull and ConBull
Red= Bear and ConBear
Yellow= Bull and ConBear
Blue= Bear and ConBull
//
bcolor = Green ? color.green : Red ? color.red : Yellow ? color.yellow : Blue ? color.blue : na
barcolor(color=bcolor)
// === INPUT BACKTEST RANGE ===
FromYear  = input(defval = 2019, title = "From Year", minval = 1920)
FromMonth = input(defval = 1, title = "From Month", minval = 1, maxval = 12)
FromDay   = input(defval = 1, title = "From Day", minval = 1, maxval = 31)
ToYear    = input(defval = 9999, title = "To Year", minval = 2009)
ToMonth   = input(defval = 12, title = "To Month", minval = 1, maxval = 12)
ToDay     = input(defval = 31, title = "To Day", minval = 1, maxval = 31)

// === FUNCTION EXAMPLE ===
start     = timestamp(FromYear, FromMonth, FromDay, 00, 00)  // backtest start window
finish    = timestamp(ToYear, ToMonth, ToDay, 23, 59)        // backtest finish window
window()  => true // create function "within window of time"

if LSB == "Long only" and Green
    strategy.entry("L",true)
if LSB == "Long only" and Red
    strategy.close("L",qty_percent=100,comment="TP Long")
if LSB == "Both" and Green
    strategy.entry("L",true)
if LSB == "Both" and Red
    strategy.entry("S",false)
if LSB == "Short only" and Red
    strategy.entry("S",false)
if LSB == "Short only" and Green
    strategy.close("S",qty_percent=100,comment="TP Short")
Published by ChaoZhang on the FMZ strategy square · last modified 2024-01-23. Collected in the Quant Trading Vault. Unvalidated research: re-test with your own data and costs before trusting it.
Build this with AgenKit
A spec is not a trading system. Paste this into your coding agent and AgenKit runs a specialist team — architecture, test-first build, risk gates, review — with paper trading on by default.
/agenkit build a production-grade trading bot with a backtest engine, risk controls and paper trading by default from strategies/Dual-Moving-Average-Crossover-MACD-Trend-Following-Strategy.md- npx agenkit install engineering-kit in your project
- Paste the command into your agent and approve each phase
- Get tests, backtest, risk controls and a paper-trading switch
Understand it first
Before you run this, read the lesson behind the idea and how to backtest it honestly. Specs like this one are the survivors of an unknown number of trials; deflate their results accordingly.
Related specs
- Bollinger Bands and RSI Trend Following StrategyPine Script · Trend following · 1h
- EMA and RSI Trend Trading StrategyPine Script · Trend following · 1d
- Multi Indicator Trend Following Strategy with Dynamic Risk ManagementPine Script · Trend following · 2h
- Trend Following Strategy Based on EMA and SMA CrossoverPine Script · Trend following · 1h
- Dynamic Moving Average Crossover Combo StrategyPine Script · Trend following · 10m
- Dynamic Moving Average Trend Crossover StrategyPine Script · Trend following · 1d