Strategy vault / Trend following
Dual Moving Average Deviation Combined with ATR Indicator Trend Following Strategy
This strategy uses the golden cross and dead cross signals formed by dual EMA moving averages, combined with the ATR indicator to judge market volatility, to implement a low-buying-high-selling trend following…
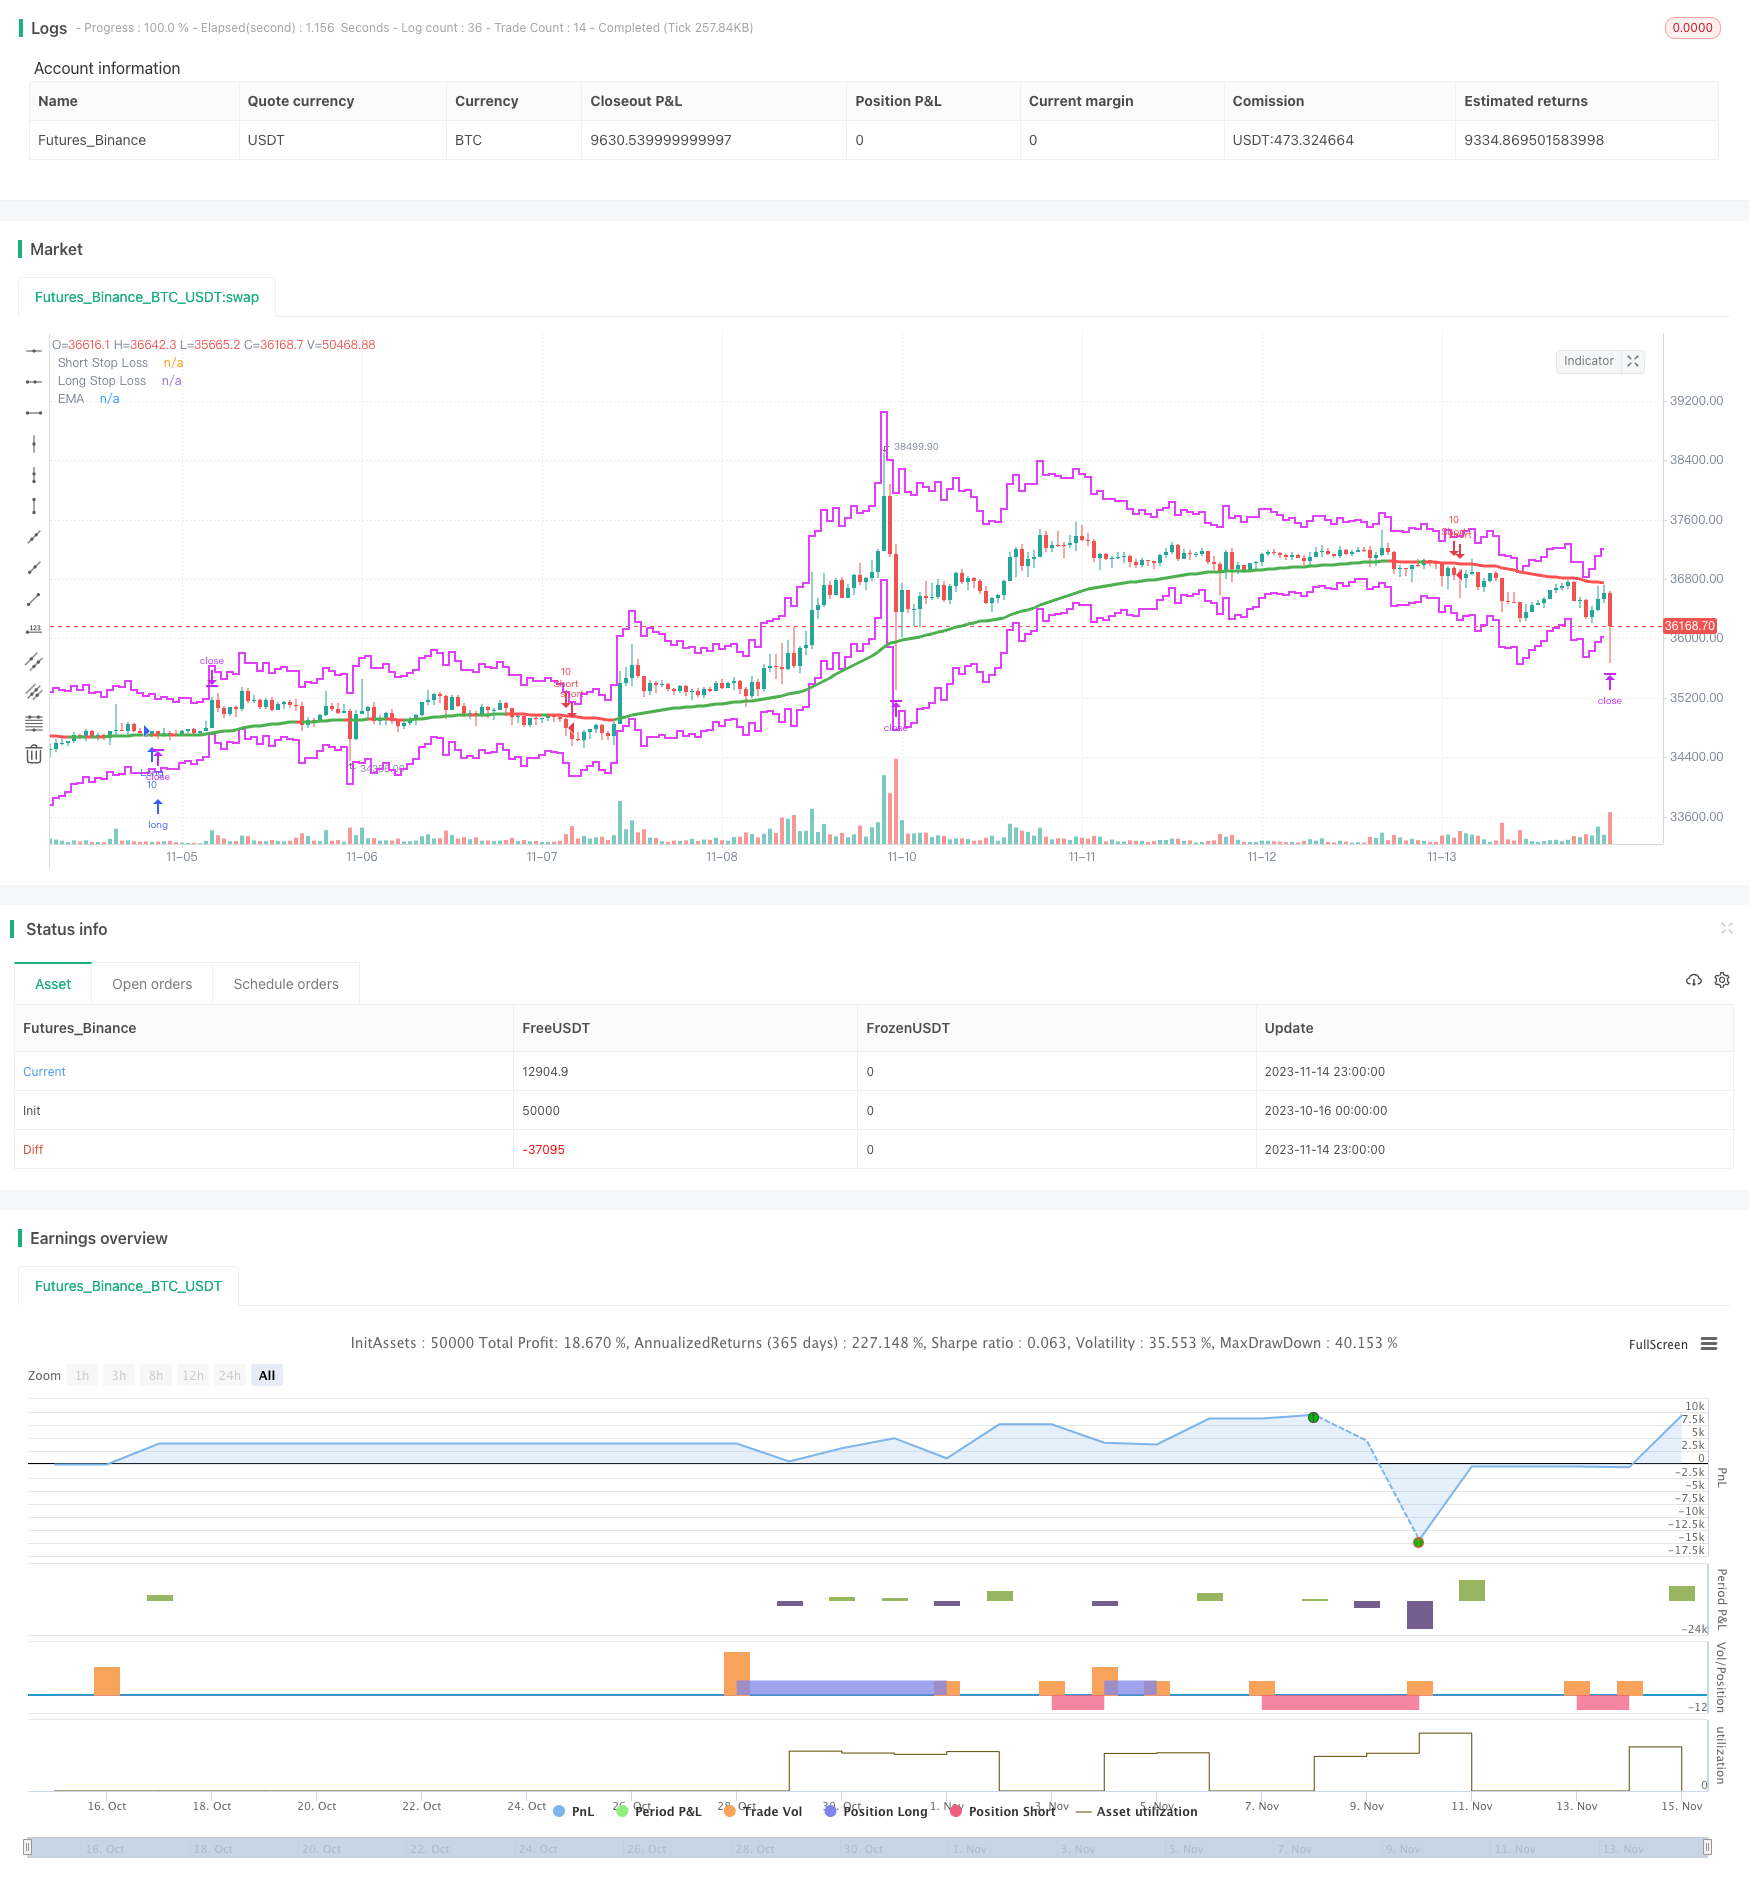
Overview
This strategy uses the golden cross and dead cross signals formed by dual EMA moving averages, combined with the ATR indicator to judge market volatility, to implement a low-buying-high-selling trend following strategy. When the fast line crosses above the slow line, and the ATR indicator is lower than the previous day, it is considered a bullish signal to go long. When the fast line crosses below the slow line, and the ATR indicator is higher than the previous day, it is considered a bearish signal to go short.
Strategy Logic
Use dual EMA moving averages of length 20 and 55. When the fast line crosses above the slow line and generates a golden cross, it is considered a bullish signal. When the fast line crosses below the slow line and generates a dead cross, it is considered a bearish signal.
Use ATR indicator of length 14. The ATR indicator reflects the volatility and risk level of the market. When the ATR is lower than the previous day, it indicates that market volatility is weakening and it is suitable to go long. When the ATR is higher than the previous day, it indicates that market volatility is increasing and it is suitable to go short.
Only go long when the fast line golden crosses the slow line and the ATR is lower than the previous day. Only go short when the fast line dead crosses the slow line and the ATR is higher than the previous day. This avoids intervene when market volatility is high.
The ATR indicator is also used to set stop loss and take profit levels. The stop loss is set at current price minus ATR multiplied by the stop loss multiplier. The take profit is set at current price plus ATR multiplied by the take profit multiplier.
The default stop loss multiplier is 3xATR and the default take profit multiplier is 3xATR. This allows the stop loss and take profit to dynamically follow market volatility.
Advantages of the Strategy
Using a dual moving average system provides stronger confirmation of long/short status. It avoids being misled by false breakouts that frequently occur in the market.
Introducing the ATR indicator allows the strategy to only engage when volatility is low. This filters out many false signals and reduces system risk.
The dynamic ATR stop loss/take profit allows the stops and targets to be set according to market volatility level. This prevents stops being too close or targets being too shallow.
It is possible to set moving average crossover as an additional exit mechanism. This can further optimize the system's profitability.
Dynamic stop loss and take profit levels based on ATR fit better with the trend trading logic. The stop loss is not too sensitive and the take profit is not too loose.
Risks of the Strategy
Dual moving averages have some lag in signals. This may miss stronger short-term trends.
When volatility is high, ATR rises and may miss entry opportunities. ATR parameters need to be adjusted accordingly.
For long holding periods, the stop loss may get too close. It needs to be relaxed according to the trend strength.
Moving averages perform poorly in choppy ranging markets. Other indicators are needed for confirmation.
ATR parameters need to be adjusted for different products and timeframes. Incorrect parameters will negatively impact performance.
Improvement Areas
Test different length moving average combinations to find parameters that match the trend characteristics of the product.
Incorporate other indicators like MACD, KD to confirm moving average crossover signals and improve Entscheidungssicherheit.
Optimize ATR parameters through backtesting to better match the volatility characteristics of the product.
Make the ATR multiplier factor adjustable to dynamically adjust stop loss/take profit according to trend strength.
Incorporate a trend strength indicator to reduce stop loss requirements in weak trends, and increase take profit in strong trends.
Summary
This strategy integrates the trendJudgment of dual EMAs and the risk control of the ATR volatility indicator to form a relatively complete trend following system. The focus for optimization is adjusting the moving average and ATR parameters to match the product characteristics, and designing dynamic stop loss/take profit mechanisms to follow changes in trend strength. With parameter and logic optimization, this strategy can become an excellent trend following strategy.
Parameters
| Name | Default | What it controls |
|---|---|---|
| v_input_1 | 20 | Fast Moving Average |
| v_input_2 | 55 | Slow Moving Average |
| v_input_3_close | 0 | Source: close | high | low | open | hl2 | hlc3 | hlcc4 | ohlc4 |
| v_input_4 | 14 | ATR Length |
| v_input_5 | 3 | Stop Loss Multiple |
| v_input_6 | 3 | Take Profit Multiple |
| v_input_7 | true | Plot EMA? |
| v_input_8 | false | Exit with Slow MA Crossover? |
| v_input_9 | true | Exit with ATR? |
Source Pine Script
/*backtest
start: 2023-10-16 00:00:00
end: 2023-11-15 00:00:00
period: 1h
basePeriod: 15m
exchanges: [{"eid":"Futures_Binance","currency":"BTC_USDT"}]
*/

//@version=4
// **********************************************
// PtahX EMA/ATR Strategy Public Release
// EMA Strategy with ATR & "Fear Factor" built in
// written by PtahX October 2019
// * modifications welcome
// * please let me know if you improve it so I can continue to learn :)
// * use at your own risk - I'm a new programmer and still learning
// * Best of luck on your trades!!

// Take Profit (TP) option based on ATR or MA Crossover
//***********************************************

strategy(title="PtahX EMA/ATR Strategy", overlay=true, pyramiding=1, calc_on_every_tick=true, default_qty_value=1, initial_capital=10000, slippage=2)

//*****************************
// Global Inputs
//*****************************

fastMA = input(title="Fast Moving Average", defval=20, step=1)
slowMA = input(title="Slow Moving Average", defval=55, step=1)
source = input(close, title="Source")
atrLength = input(title="ATR Length", defval=14, minval=7, step=1)
slMultiplier = input(title="Stop Loss Multiple", type=input.float, defval=3, minval=1, step=0.2)
tpMultiplier = input(title= "Take Profit Multiple", type=input.float, defval=3, minval=1, step=0.2)
maPlot = input(true, title="Plot EMA?")
maCrossoverExit =  input(false, title="Exit with Slow MA Crossover?")
atrExit = input(true, title="Exit with ATR?")
//***********************************
// ATR
//***********************************
atr = atr(atrLength)


//***********************************
// Volatility Filter
//**********************************
// During uptrends the ATR indicator tends to post lower volatility.
// During downtrends, the ATR indicator tends to post higher volatility

volatilityBullish = atr < atr[1]
volatilityBearish = atr > atr[1]


//***********************************
// Moving Averages
//***********************************

// Double Line Plot Code (used for Entries & Exits not plotted by default)
fast = ema(source, fastMA)
slow = ema(source, slowMA)
maLong = crossover(fast, slow)
maShort = crossunder(fast, slow)

// Single Line Plot Code
bullish = slow > slow[1]
bearish = slow < slow[1]
barColor = bullish ? color.green : bearish ? color.red : color.blue


//*****************************
// Entries
//*****************************

entryLong = maLong and volatilityBullish
entryShort = maShort and volatilityBearish

if entryLong
    sLoss = source - atr * slMultiplier
    strategy.entry("Long", strategy.long, qty=10)
    strategy.exit("Long Exit", "Long", stop=sLoss)


if entryShort
    sLoss = source + atr * slMultiplier
    tProfit = close > slowMA
    strategy.entry("Short", strategy.short, qty=10)
    strategy.exit("Short Exit", "Short", stop=sLoss)


//*****************************
// Exits
//*****************************

exitLong = 0
exitShort = 0

if maCrossoverExit
    exitLong = maShort
    exitShort = maLong
    strategy.exit("Long Exit", "Long", when = exitLong)
    strategy.exit("Short Exit", "Short", when = exitShort)

if atrExit
    exitLong = source + atr * tpMultiplier
    exitShort = source - atr * tpMultiplier
    strategy.exit("Long Exit", "Long", limit = exitLong)
    strategy.exit("Short Exit", "Short", limit = exitShort)


//******************************
// ATR Based Exit/ Stop Plotting
//******************************

// Stop Loss Calculations
longStopLoss = source - atr(atrLength) * slMultiplier
shortStopLoss = source + atr(atrLength) * slMultiplier

longTakeProfit = source - atr(atrLength) * slMultiplier
shortTakeProfit = source + atr(atrLength) * slMultiplier


//*********************************
//Chart Plotting
//*********************************

//ATR Based Stop Losses
plot(shortStopLoss, color=color.fuchsia, offset=0, transp=0, show_last=5, linewidth=2, style=plot.style_stepline, title="Short Stop Loss")
plot(longStopLoss, color=color.fuchsia, offset=0, transp=0, show_last=5, linewidth=2, style=plot.style_stepline, title="Long Stop Loss")


// Single Slow EMA Option
plot(slow and maPlot ? slow : na, title="EMA", color=barColor, linewidth=3)
Published by ChaoZhang on the FMZ strategy square · last modified 2023-11-16. Collected in the Quant Trading Vault. Unvalidated research: re-test with your own data and costs before trusting it.
Build this with AgenKit
A spec is not a trading system. Paste this into your coding agent and AgenKit runs a specialist team — architecture, test-first build, risk gates, review — with paper trading on by default.
/agenkit build a production-grade trading bot with a backtest engine, risk controls and paper trading by default from strategies/Dual-Moving-Average-Deviation-Combined-with-ATR-Indicator-Trend-Following-Strategy.md- npx agenkit install engineering-kit in your project
- Paste the command into your agent and approve each phase
- Get tests, backtest, risk controls and a paper-trading switch
Understand it first
Before you run this, read the lesson behind the idea and how to backtest it honestly. Specs like this one are the survivors of an unknown number of trials; deflate their results accordingly.
Related specs
- ATR Dynamic Trend Following and EMA Crossover Trading StrategyPine Script · Trend following · 1d
- ATR and Moving Average Crossover Hybrid StrategyPine Script · Trend following · 1h
- ATR and T3 Moving Average StrategyPine Script · Trend following · 5m
- Adaptive ATR and RSI Trend Following Strategy with Trailing Stop LossPine Script · Trend following · 1h
- Bollinger Bands and RSI Trend Following StrategyPine Script · Trend following · 1h
- Dual ATR Channel Trend Following StrategyPine Script · Trend following · 15m