Dual Moving Average Oscillation Breakout Strategy
The Dual Moving Average Oscillation Breakout strategy is a short-term trading strategy that utilizes a dual moving average system. The strategy generates trading signals based on price channels and double Bollinger…
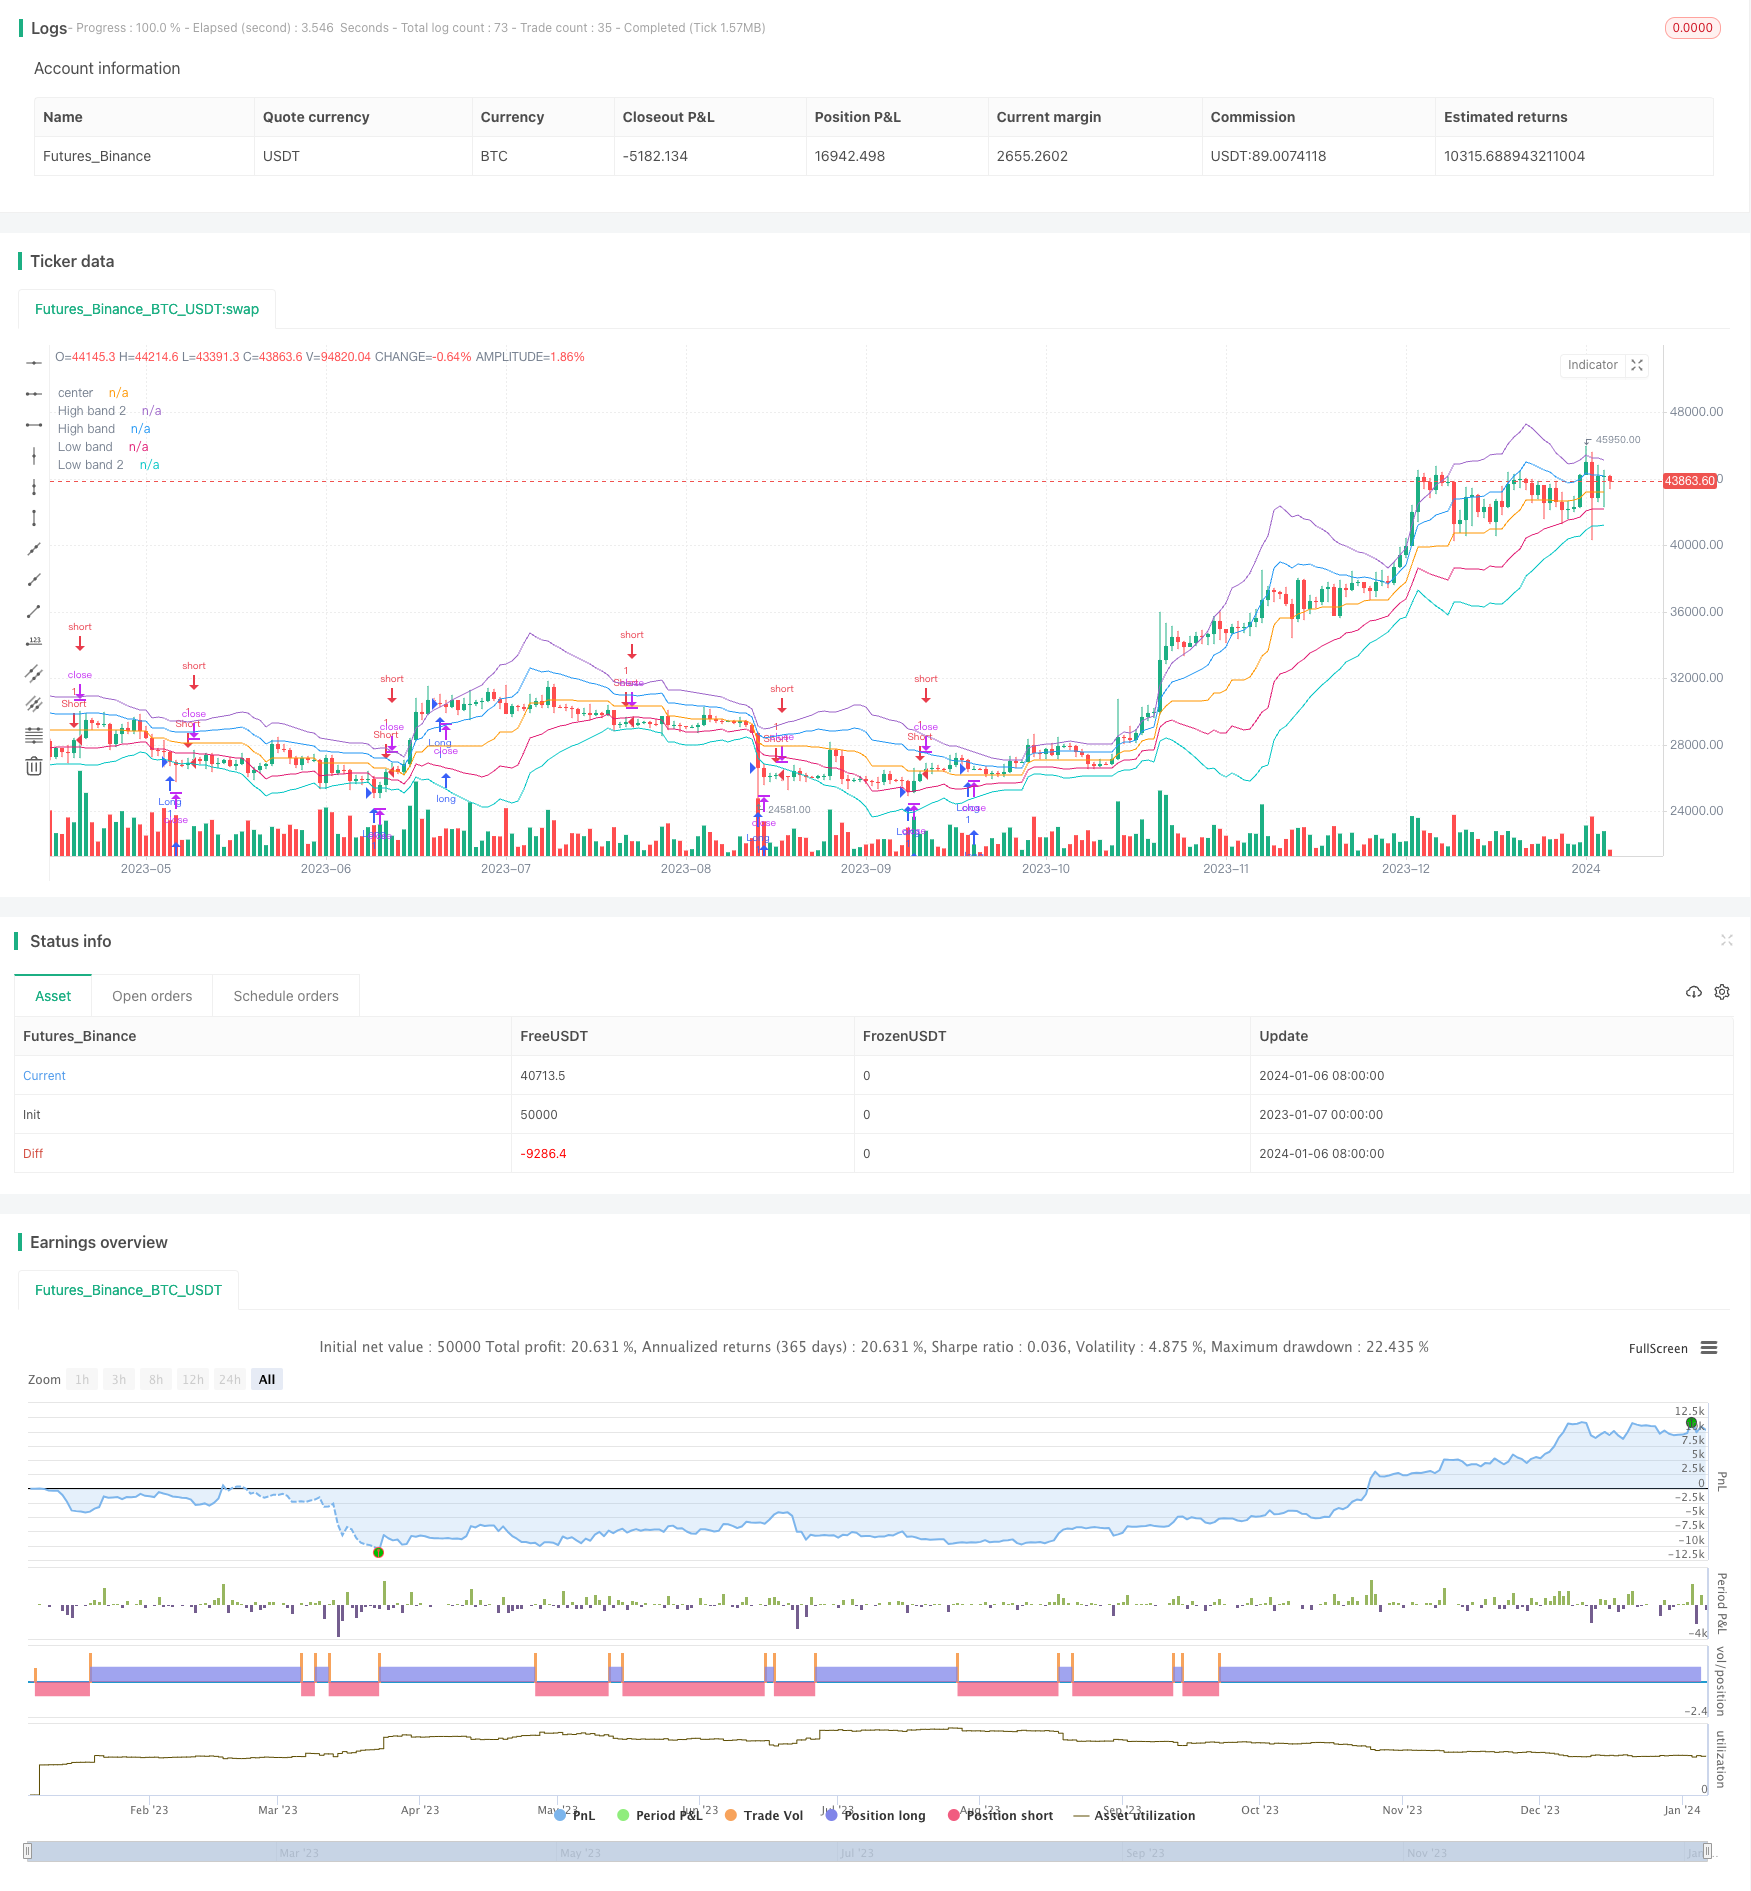
Overview
The Dual Moving Average Oscillation Breakout strategy is a short-term trading strategy that utilizes a dual moving average system. The strategy generates trading signals based on price channels and double Bollinger Bands, aided by fast RSI indicators to determine overbought and oversold conditions. It aims to capture breakouts in medium-term price trends for profit.
Strategy Logic
The Dual Moving Average Oscillation Breakout strategy uses 20-period price channels and Bollinger Bands as the main trading indicators. The price channel consists of moving averages of the highest and lowest prices, representing the current price oscillation range. Bollinger Bands are formed by the midline of the price channel and standard deviations, which intuitively describe the fluctuation range of prices. When prices approach the upper and lower rails of the channel, it indicates that prices may break through the oscillation range and form a new trend. At this point, combined with the fast RSI indicator to judge overbought or oversold conditions, the trend direction can be determined and trading decisions can be made.
Specifically, when the fast RSI is below 5, it is considered the oversold zone, and when the fast RSI exceeds 99, it is considered the overbought zone. In addition, factors such as the direction of K-line entities and new highs (lows) in prices should also be considered to avoid false breakouts. When the above conditions are met, buy and sell signals are generated.
Advantages
The biggest advantage of the Dual Moving Average Oscillation Breakout strategy is that it captures the inflection points of medium-term price trends for profit. Compared to single moving averages and channels, double Bollinger Bands more intuitively reflect price fluctuations and volumes. And compared to longer cycle indicators such as 20-day and 60-day moving averages, it responds more quickly to price changes and has a higher success rate in capturing turns. In addition, combining the fast RSI indicator can effectively filter false breakouts. Therefore, this strategy can maximize the probability of profit.
Risks
The Dual Moving Average Oscillation Breakout strategy has some risks. First, medium-term trading itself has higher stop-loss risks. In a strong trend, false breakouts may occur multiple times on medium-term indicators, causing stops. Second, the effectiveness of fast RSI indicators in judging overbought and oversold zones will be affected by market sentiment. When structural changes occur in the market, the utility of such auxiliary indicators will decrease. Finally, incorporating other factors such as closing prices, volume and turnover can improve decision accuracy.
The countermeasure is to appropriately adjust the stop loss range, loosen the stop loss point in an uptrend, and tighten it in a downtrend. In addition, fully consider more auxiliary indicators to avoid relying solely on one or two indicators. When the judgment effect decreases, appropriately reduce the position to avoid risks.
Optimization Directions
There is still room for further optimization of the Dual Moving Average Oscillation Breakout strategy. First, parameter optimization. More cycle parameters can be tested to find the optimal parameter combination. Second, model optimization. Introduce machine learning models to more accurately judge overbought and oversold areas. Third, time frame optimization. Test under different time frames such as daily and 60 minutes separately to determine the best application scenario. Fourth, condition optimization. Add more volume and price indicators to filter signals, such as volume expansion and trend index DMI.
Conclusion
The Dual Moving Average Oscillation Breakout Strategy captures medium-term price breakouts by constructing a double Bollinger band system, which is an effective trend tracking strategy. The strategy has high success rate and fast response, and can profit effectively. By means of parameter optimization, model optimization, time frame selection and other means, the strategy performance can be further improved. This strategy is suitable for experienced quantitative traders to conduct quantitative improvements and applications.
Parameters
| Name | Default | What it controls |
|---|---|---|
| v_input_1 | true | Long |
| v_input_2 | true | Short |
| v_input_3 | 20 | Period |
| v_input_4 | true | Use ColorBar |
| v_input_5 | true | Use CryptoBottom |
| v_input_6 | true | Use RSI |
| v_input_7 | true | Use min/max |
| v_input_8 | false | Show Bands |
| v_input_9 | false | Show Background |
| v_input_10 | false | Show Locomotive |
Source Pine Script
/*backtest
start: 2023-01-07 00:00:00
end: 2024-01-07 00:00:00
period: 1d
basePeriod: 1h
exchanges: [{"eid":"Futures_Binance","currency":"BTC_USDT"}]
*/


//@version=2
strategy("Noro's Bands Strategy v1.4", shorttitle = "NoroBands str 1.4", overlay=true, default_qty_type = strategy.percent_of_equity, default_qty_value=100.0, pyramiding=0)

//Settings
needlong = input(true, defval = true, title = "Long")
needshort = input(true, defval = true, title = "Short")
len = input(20, defval = 20, minval = 2, maxval = 200, title = "Period")
color = input(true, "Use ColorBar")
usecb = input(true, "Use CryptoBottom")
usersi = input(true, "Use RSI")
usemm = input(true, "Use min/max")
needbb = input(false, defval = false, title = "Show Bands")
needbg = input(false, defval = false, title = "Show Background")
needlo = input(false, defval = false, title = "Show Locomotive")
src = close

//Fast RSI
fastup = rma(max(change(src), 0), 2)
fastdown = rma(-min(change(src), 0), 2)
fastrsi = fastdown == 0 ? 100 : fastup == 0 ? 0 : 100 - (100 / (1 + fastup / fastdown))

//CryptoBottom
mac = sma(close, 10)
lencb = abs(close - mac)
sma = sma(lencb, 100)
max = max(open, close)
min = min(open, close)

//PriceChannel
lasthigh = highest(src, len)
lastlow = lowest(src, len)
center = (lasthigh + lastlow) / 2

//dist
dist = abs(src - center)
distsma = sma(dist, len)
hd = center + distsma
ld = center - distsma
hd2 = center + distsma * 2
ld2 = center - distsma * 2

//Trend
trend = close < ld and high < hd ? -1 : close > hd and low > ld ? 1 : trend[1]

//Lines
colo = needbb == false ? na : black
plot(hd2, color = colo, linewidth = 1, transp = 0, title = "High band 2")
plot(hd, color = colo, linewidth = 1, transp = 0, title = "High band")
plot(center, color = colo, linewidth = 1, transp = 0, title = "center")
plot(ld, color = colo, linewidth = 1, transp = 0, title = "Low band")
plot(ld2, color = colo, linewidth = 1, transp = 0, title = "Low band 2")

//Background
col = needbg == false ? na : trend == 1 ? lime : red
bgcolor(col, transp = 80)

//Signals
up = trend == 1 and ((close < open or color == false) or close < hd) and (min < min[1] or usemm == false) ? 1 : 0
dn = trend == -1 and ((close > open or color == false) or close > ld) and (max > max[1] or usemm == false) ? 1 : 0
up2 = close < open and lencb > sma * 3 and min < min[1] and fastrsi < 10 ? 1 : 0 //CryptoBottom
//dn2 = close > open and len > sma * 3 and max > max[1] and fastrsi > 90 ? 1 : 0 //CryptoBottom
up3 = fastrsi < 5 ? 1 : 0
//dn3 = fastrsi > 99 ? 1 : 0

//Locomotive
uploco = trend == 1 and close < open and min < min[1] and close < center ? 1 : 0
plotarrow(needlo == true and uploco == 1 ? 1 : 0, colorup = black, colordown = black, transp = 0)

longCondition = up == 1 or (up2 == 1 and usecb == true) or (up3 == 1 and usersi == true)
if (longCondition)
    strategy.entry("Long", strategy.long, needlong == false ? 0 : na)

shortCondition = dn == 1
if (shortCondition)
strategy.entry("Short", strategy.short, needshort == false ? 0 : na)Published by ChaoZhang on the FMZ strategy square · last modified 2024-01-08. Collected in the Quant Trading Vault. Unvalidated research: re-test with your own data and costs before trusting it.
Build this with AgenKit
A spec is not a trading system. Paste this into your coding agent and AgenKit runs a specialist team — architecture, test-first build, risk gates, review — with paper trading on by default.
/agenkit build a production-grade trading bot with a backtest engine, risk controls and paper trading by default from strategies/Dual-Moving-Average-Oscillation-Breakout-Strategy.md- npx agenkit install engineering-kit in your project
- Paste the command into your agent and approve each phase
- Get tests, backtest, risk controls and a paper-trading switch
Understand it first
Before you run this, read the lesson behind the idea and how to backtest it honestly. Specs like this one are the survivors of an unknown number of trials; deflate their results accordingly.
Related specs
- Bollinger Band Channel Breakout Trading StrategyPine Script · Breakout · 1d
- Bollinger Bands Dynamic Breakout StrategyPine Script · Breakout · 1h
- Cross boundary Dynamic Range Quantitative Trading Strategy Based on Bollinger BandsPine Script · Breakout · 3h
- EMA and Bollinger Bands Breakout StrategyPine Script · Breakout · 1h
- Momentum Breakout Moving Average StrategyPine Script · Breakout · 1d
- Momentum Breakout Trading Strategy 440964Pine Script · Breakout · 5m