Strategy vault / Trend following
Dual Range Filter Trend Tracking Strategy
The Dual Range Filter Trend Tracking Strategy is a quantitative trading strategy that utilizes dual EMA range filtering to identify trend direction and track trends. This strategy combines dual moving average…
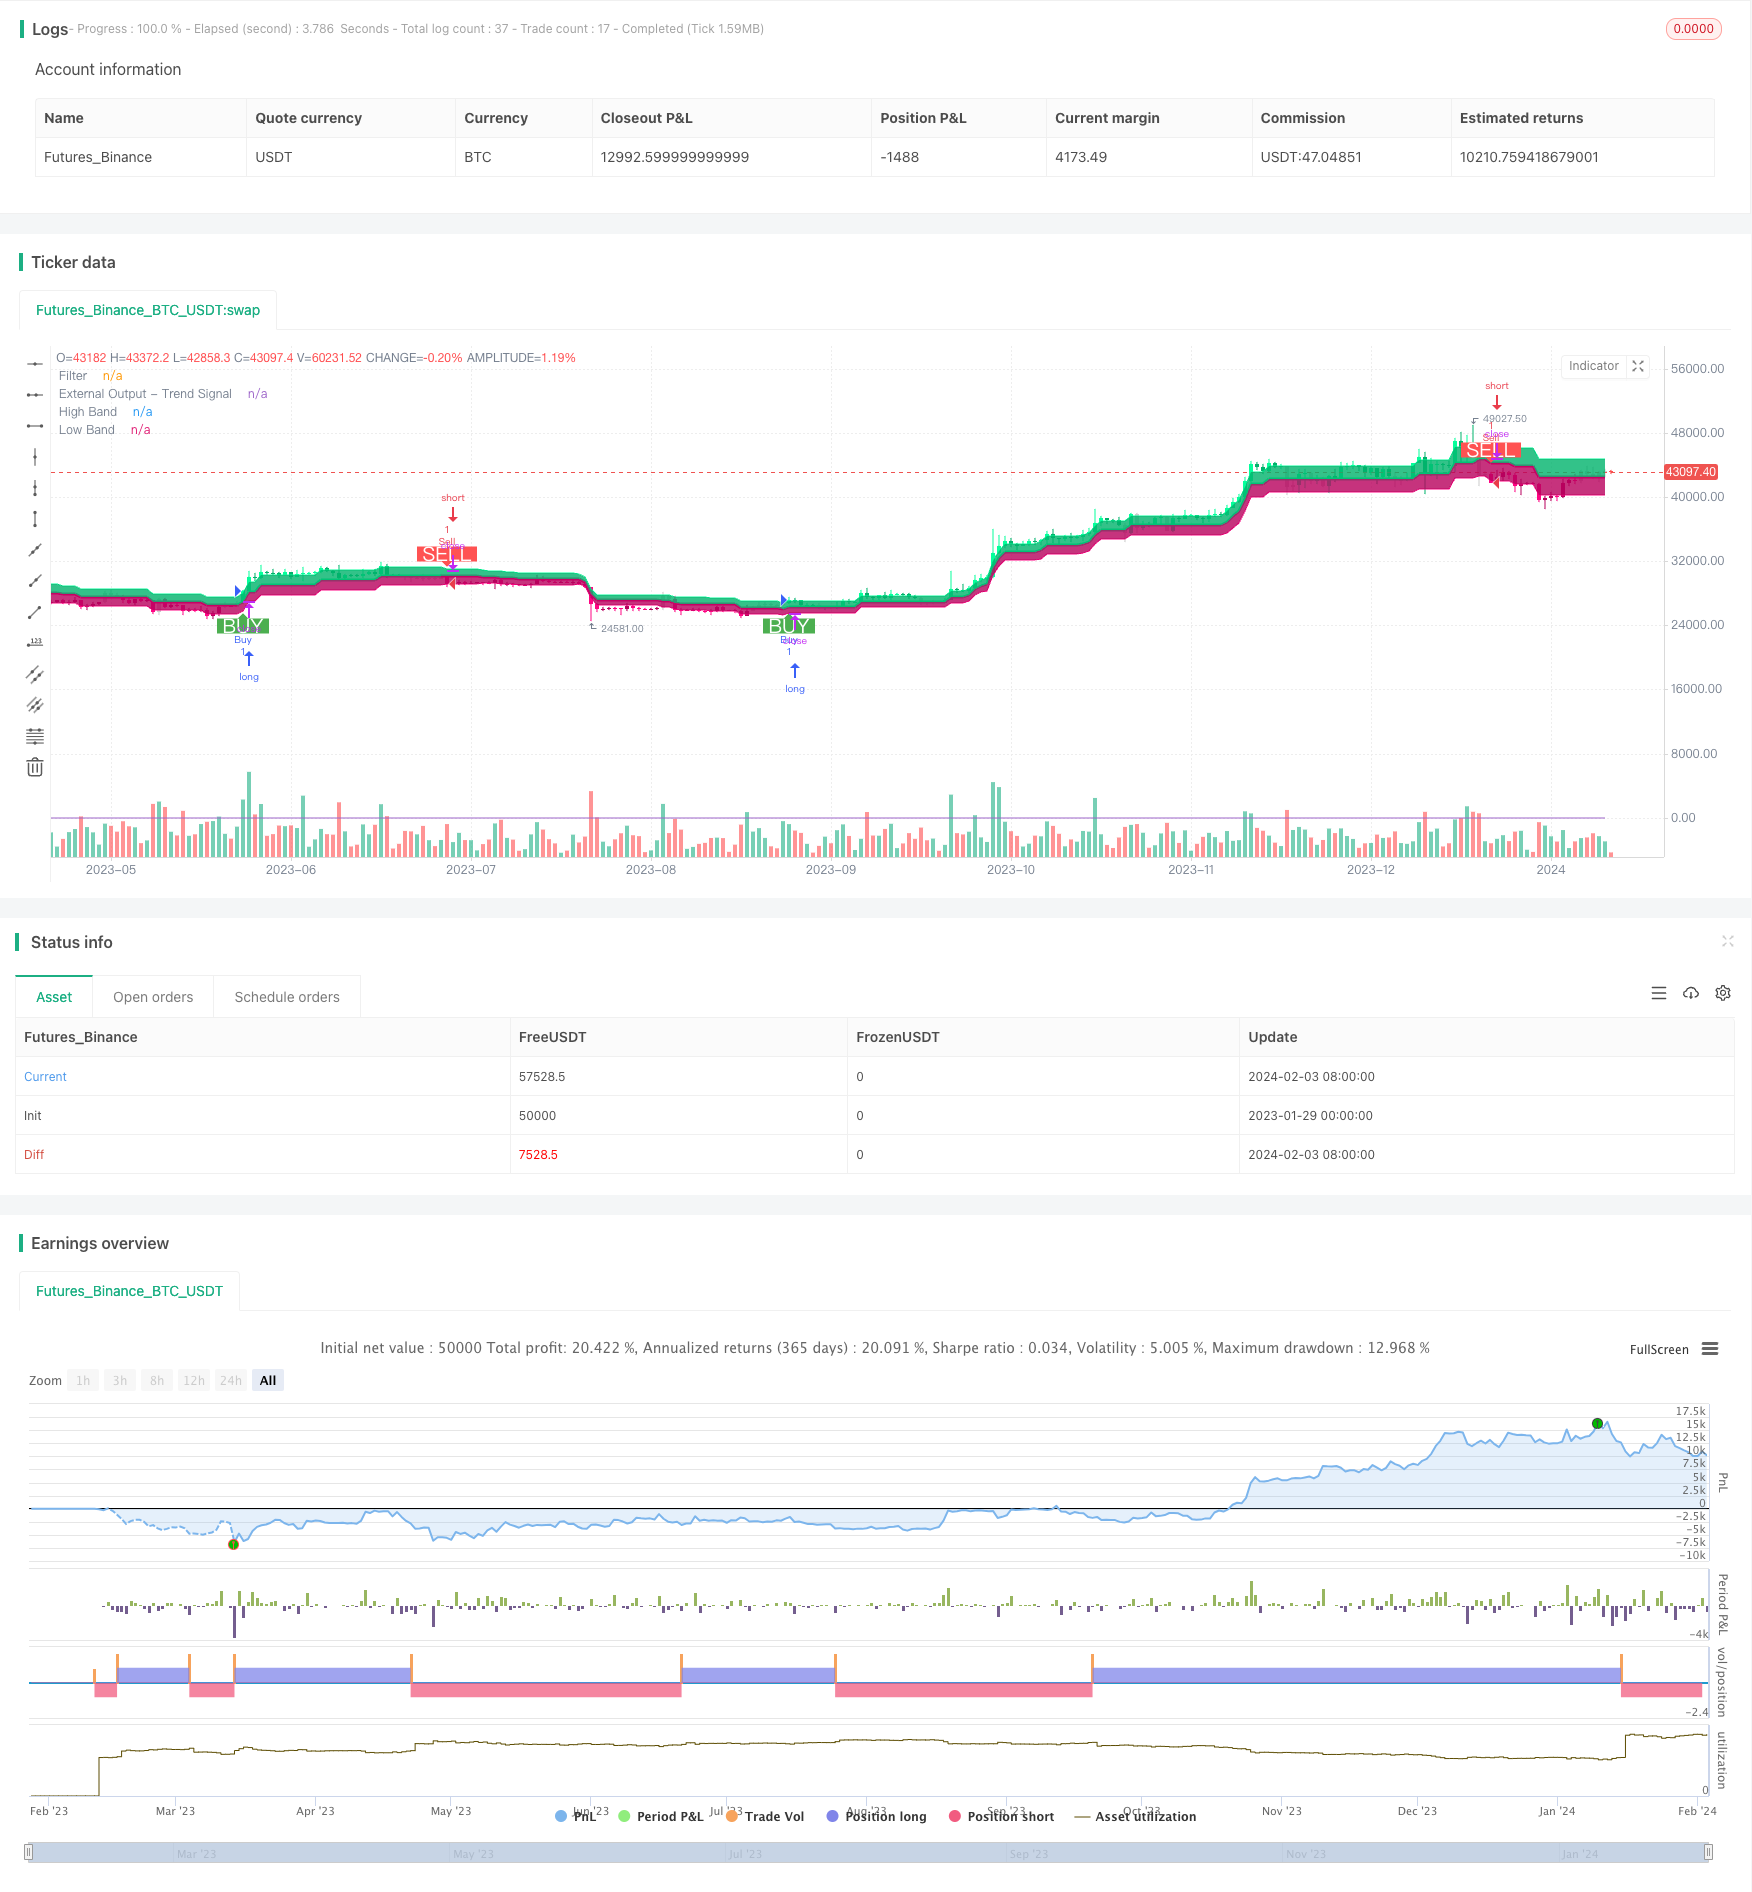
Overview
The Dual Range Filter Trend Tracking Strategy is a quantitative trading strategy that utilizes dual EMA range filtering to identify trend direction and track trends. This strategy combines dual moving average filtering and ATR range calculation to effectively recognize mid-to-long term trend direction and lock in profits with trailing stop loss.
Strategy Logic
The core of this strategy is the dual EMA range filtering. It calculates the ATR range of candlesticks and smoothes it, then uses two EMAs to locate the position of candlesticks within the range to determine if it is currently in a trend. When the price breaks through the range, it signals a change in the trend.
Specifically, the strategy first calculates the ATR range size of the candlesticks, and then smoothes it with two EMAs. The ATR range represents the normal fluctuation range of the candlesticks. When the price exceeds this range, it means a change in the trend has occurred. The strategy records the direction when the price breaks through the EMA range. When the direction changes, it means a trend reversal has occurred, and that is when it can choose to enter the market.
After entering the market, the strategy uses a floating stop loss to lock in profits. During the holding period, it constantly judges whether the candlestick has fallen back out of range. If a pullback occurs, it will exit the current position. This can effectively lock the profits from trend trading.
Advantage Analysis
The Dual Range Filter Trend Tracking Strategy combines the advantages of moving average filtering and range calculation to accurately determine trend direction and avoids frequently entering and exiting the market in ranging markets. The specific advantages are:
- Use ATR principle to judge candlestick fluctuation range, avoids entering the market without direction during ranging market
- The dual EMA filter improves judgment accuracy and reduces false signals
- Real-time floating stop loss can effectively lock in trend profits
- Simple and clear strategy logic, easy to understand and optimize
Risk Analysis
There are also some risks with this strategy, mainly in the following aspects:
- Large gaps can break through the ATR range, resulting in premature entry
- In strong trending markets, the stop loss may be triggered prematurely
- Improper parameter settings also affects strategy performance
To address these risks, methods such as optimizing parameters appropriately, preventing false breakouts, judging trend strength can be used to solve them.
Optimization Suggestions
The Dual Range Filter Trend Tracking Strategy also has potential for further optimization, with the main optimization directions including:
- Optimize ATR parameters to smooth candlestick fluctuation range
- Incorporate volume indicators to avoid false breakouts
- Judge trend strength to distinguish one-time breakouts and sustainable trends
- Optimize stop loss price to track long trends while ensuring profit
Through these optimizations, the strategy can achieve steady profits in more market environments.
Summary
The Dual Range Filter Trend Tracking Strategy integrates the various advantages of moving average filtering and ATR range judgment, and can effectively identify the direction and entry timing of sustainable mid-to-long term trends. It only enters the market when trends change, and uses a floating stop loss to lock in profits. This strategy has simple and clear logic and is very suitable for mid-to-long term trend trading. Through continuous optimization of parameters and judgment rules, this strategy can achieve good returns across various markets.
Parameters
| Name | Default | What it controls |
|---|---|---|
| v_input_1 | 0 | Filter Type: Type 1 | Type 2 |
| v_input_2 | 0 | Movement Source: Close | Wicks |
| v_input_3 | 2.618 | Range Size |
| v_input_4 | 0 | Range Scale: Average Change | Pips | Ticks | % of Price | ATR | Points | Standard Deviation | Absolute |
| v_input_5 | 14 | Range Period (for ATR, Average Change, and Standard Deviation) |
| v_input_6 | true | Smooth Range |
| v_input_7 | 27 | Smoothing Period |
| v_input_8 | true | Average Filter Changes |
| v_input_9 | 2 | Number Of Changes To Average |
| v_input_10 | 100 | Take Profit Percentage |
| v_input_11 | 100 | Stop Loss Percentage |
Source Pine Script
/*backtest
start: 2023-01-29 00:00:00
end: 2024-02-04 00:00:00
period: 1d
basePeriod: 1h
exchanges: [{"eid":"Futures_Binance","currency":"BTC_USDT"}]
*/

//@version=4
strategy("Range Filter [DW] & Labels", shorttitle="RF [DW] & Labels", overlay=true)

//Conditional Sampling EMA Function
Cond_EMA(x, cond, n)=>
    var val     = array.new_float(0)
    var ema_val = array.new_float(1)
    if cond
        array.push(val, x)
        if array.size(val) > 1
            array.remove(val, 0)
        if na(array.get(ema_val, 0))
            array.fill(ema_val, array.get(val, 0))
        array.set(ema_val, 0, (array.get(val, 0) - array.get(ema_val, 0))*(2/(n + 1)) + array.get(ema_val, 0))
    EMA = array.get(ema_val, 0)
    EMA

//Conditional Sampling SMA Function
Cond_SMA(x, cond, n)=>
    var vals = array.new_float(0)
    if cond
        array.push(vals, x)
        if array.size(vals) > n
            array.remove(vals, 0)
    SMA = array.avg(vals)
    SMA

//Standard Deviation Function
Stdev(x, n)=>
    sqrt(Cond_SMA(pow(x, 2), 1, n) - pow(Cond_SMA(x, 1, n), 2))

//Range Size Function
rng_size(x, scale, qty, n)=>
    ATR      = Cond_EMA(tr(true), 1, n)
    AC       = Cond_EMA(abs(x - x[1]), 1, n)
    SD       = Stdev(x, n)
    rng_size = scale=="Pips" ? qty*0.0001 : scale=="Points" ? qty*syminfo.pointvalue : scale=="% of Price" ? close*qty/100 : scale=="ATR" ? qty*ATR :
               scale=="Average Change" ? qty*AC : scale=="Standard Deviation" ? qty*SD : scale=="Ticks" ? qty*syminfo.mintick : qty

//Two Type Range Filter Function
rng_filt(h, l, rng_, n, type, smooth, sn, av_rf, av_n)=>
    rng_smooth = Cond_EMA(rng_, 1, sn)
    r          = smooth ? rng_smooth : rng_
    var rfilt  = array.new_float(2, (h + l)/2)
    array.set(rfilt, 1, array.get(rfilt, 0))
    if type=="Type 1"
        if h - r > array.get(rfilt, 1)
            array.set(rfilt, 0, h - r)
        if l + r < array.get(rfilt, 1)
            array.set(rfilt, 0, l + r)
    if type=="Type 2"
        if h >= array.get(rfilt, 1) + r
            array.set(rfilt, 0, array.get(rfilt, 1) + floor(abs(h - array.get(rfilt, 1))/r)*r)
        if l <= array.get(rfilt, 1) - r
            array.set(rfilt, 0, array.get(rfilt, 1) - floor(abs(l - array.get(rfilt, 1))/r)*r)
    rng_filt1 = array.get(rfilt, 0)
    hi_band1  = rng_filt1 + r
    lo_band1  = rng_filt1 - r
    rng_filt2 = Cond_EMA(rng_filt1, rng_filt1 != rng_filt1[1], av_n)
    hi_band2  = Cond_EMA(hi_band1, rng_filt1 != rng_filt1[1], av_n)
    lo_band2  = Cond_EMA(lo_band1, rng_filt1 != rng_filt1[1], av_n)
    rng_filt  = av_rf ? rng_filt2 : rng_filt1
    hi_band   = av_rf ? hi_band2 : hi_band1
    lo_band   = av_rf ? lo_band2 : lo_band1
    [hi_band, lo_band, rng_filt]

//-----------------------------------------------------------------------------------------------------------------------------------------------------------------
//Inputs
//-----------------------------------------------------------------------------------------------------------------------------------------------------------------

//Filter Type
f_type = input(defval="Type 1", options=["Type 1", "Type 2"], title="Filter Type")

//Movement Source
mov_src = input(defval="Close", options=["Wicks", "Close"], title="Movement Source")

//Range Size Inputs
rng_qty   = input(defval=2.618, minval=0.0000001, title="Range Size")
rng_scale = input(defval="Average Change", options=["Points", "Pips", "Ticks", "% of Price", "ATR", "Average Change", "Standard Deviation", "Absolute"], title="Range Scale")

//Range Period
rng_per = input(defval=14, minval=1, title="Range Period (for ATR, Average Change, and Standard Deviation)")

//Range Smoothing Inputs
smooth_range = input(defval=true, title="Smooth Range")
smooth_per   = input(defval=27, minval=1, title="Smoothing Period")

//Filter Value Averaging Inputs
av_vals    = input(defval=true, title="Average Filter Changes")
av_samples = input(defval=2, minval=1, title="Number Of Changes To Average")

// New inputs for take profit and stop loss
take_profit_percent = input(defval=100.0, minval=0.1, maxval=1000.0, title="Take Profit Percentage", step=0.1)
stop_loss_percent = input(defval=100, minval=0.1, maxval=1000.0, title="Stop Loss Percentage", step=0.1)

//-----------------------------------------------------------------------------------------------------------------------------------------------------------------
//Definitions
//-----------------------------------------------------------------------------------------------------------------------------------------------------------------

//High And Low Values
h_val = mov_src=="Wicks" ? high : close
l_val = mov_src=="Wicks" ? low : close

//Range Filter Values
[h_band, l_band, filt] = rng_filt(h_val, l_val, rng_size((h_val + l_val)/2, rng_scale, rng_qty, rng_per), rng_per, f_type, smooth_range, smooth_per, av_vals, av_samples)

//Direction Conditions
var fdir = 0.0
fdir    := filt > filt[1] ? 1 : filt < filt[1] ? -1 : fdir
upward   = fdir==1 ? 1 : 0
downward = fdir==-1 ? 1 : 0

//Colors
filt_color = upward ? #05ff9b : downward ? #ff0583 : #cccccc
bar_color  = upward and (close > filt) ? (close > close[1] ? #05ff9b : #00b36b) :
             downward and (close < filt) ? (close < close[1] ? #ff0583 : #b8005d) : #cccccc

//-----------------------------------------------------------------------------------------------------------------------------------------------------------------
//Outputs
//-----------------------------------------------------------------------------------------------------------------------------------------------------------------

//Filter Plot
filt_plot = plot(filt, color=filt_color, transp=0, linewidth=3,  title="Filter")

//Band Plots
h_band_plot = plot(h_band, color=#05ff9b, transp=100, title="High Band")
l_band_plot = plot(l_band, color=#ff0583, transp=100, title="Low Band")

//Band Fills
fill(h_band_plot, filt_plot, color=#00b36b, transp=85, title="High Band Fill")
fill(l_band_plot, filt_plot, color=#b8005d, transp=85, title="Low Band Fill")

//Bar Color
barcolor(bar_color)

//External Trend Output
plot(fdir, transp=100, editable=false, display=display.none, title="External Output - Trend Signal")

// Trading Conditions Logic
longCond = close > filt and close > close[1] and upward > 0 or close > filt and close < close[1] and upward > 0
shortCond = close < filt and close < close[1] and downward > 0 or close < filt and close > close[1] and downward > 0

CondIni = 0
CondIni := longCond ? 1 : shortCond ? -1 : CondIni[1]
longCondition = longCond and CondIni[1] == -1
shortCondition = shortCond and CondIni[1] == 1

// Strategy Entry and Exit
strategy.entry("Buy", strategy.long, when = longCondition)
strategy.entry("Sell", strategy.short, when = shortCondition)

// New: Close conditions based on percentage change
long_take_profit_condition = close > strategy.position_avg_price * (1 + take_profit_percent / 100)
short_take_profit_condition = close < strategy.position_avg_price * (1 - take_profit_percent / 100)

long_stop_loss_condition = close < strategy.position_avg_price * (1 - stop_loss_percent / 100)
short_stop_loss_condition = close > strategy.position_avg_price * (1 + stop_loss_percent / 100)

strategy.close("Buy", when = shortCondition or long_take_profit_condition or long_stop_loss_condition)
strategy.close("Sell", when = longCondition or short_take_profit_condition or short_stop_loss_condition)

// Plot Buy and Sell Labels
plotshape(longCondition, title = "Buy Signal", text ="BUY", textcolor = color.white, style=shape.labelup, size = size.normal, location=location.belowbar, color = color.green, transp = 0)
plotshape(shortCondition, title = "Sell Signal", text ="SELL", textcolor = color.white, style=shape.labeldown, size = size.normal, location=location.abovebar, color = color.red, transp = 0)

// Alerts
alertcondition(longCondition, title="Buy Alert", message = "BUY")
alertcondition(shortCondition, title="Sell Alert", message = "SELL")
Published by ChaoZhang on the FMZ strategy square · last modified 2024-02-05. Collected in the Quant Trading Vault. Unvalidated research: re-test with your own data and costs before trusting it.
Build this with AgenKit
A spec is not a trading system. Paste this into your coding agent and AgenKit runs a specialist team — architecture, test-first build, risk gates, review — with paper trading on by default.
/agenkit build a production-grade trading bot with a backtest engine, risk controls and paper trading by default from strategies/Dual-Range-Filter-Trend-Tracking-Strategy.md- npx agenkit install engineering-kit in your project
- Paste the command into your agent and approve each phase
- Get tests, backtest, risk controls and a paper-trading switch
Understand it first
Before you run this, read the lesson behind the idea and how to backtest it honestly. Specs like this one are the survivors of an unknown number of trials; deflate their results accordingly.
Related specs
- ATR and Moving Average Crossover Hybrid StrategyPine Script · Trend following · 1h
- Bollinger Bands and RSI Trend Following StrategyPine Script · Trend following · 1h
- Dual ATR Channel Trend Following StrategyPine Script · Trend following · 15m
- Dual MA Crossover Trend Tracking StrategyPine Script · Trend following · 1h
- Dual Mode Adaptive Trend Trading Strategy EMA Crossover with ATR Volatility Based Risk Management SystemPine Script · Trend following · 1d
- Dual Moving Average Crossover Dynamic Position Optimization Strategy with EMA Cross Signal SystemPine Script · Trend following · 1h