Strategy vault / Trend following
Dual Take Profit Moving Average Crossover Quantitative Strategy
This strategy utilizes simple moving average crossover and dual take profit techniques to control risk and increase profitability. It is suitable for medium-term trading and capturing opportunities during trend changes.
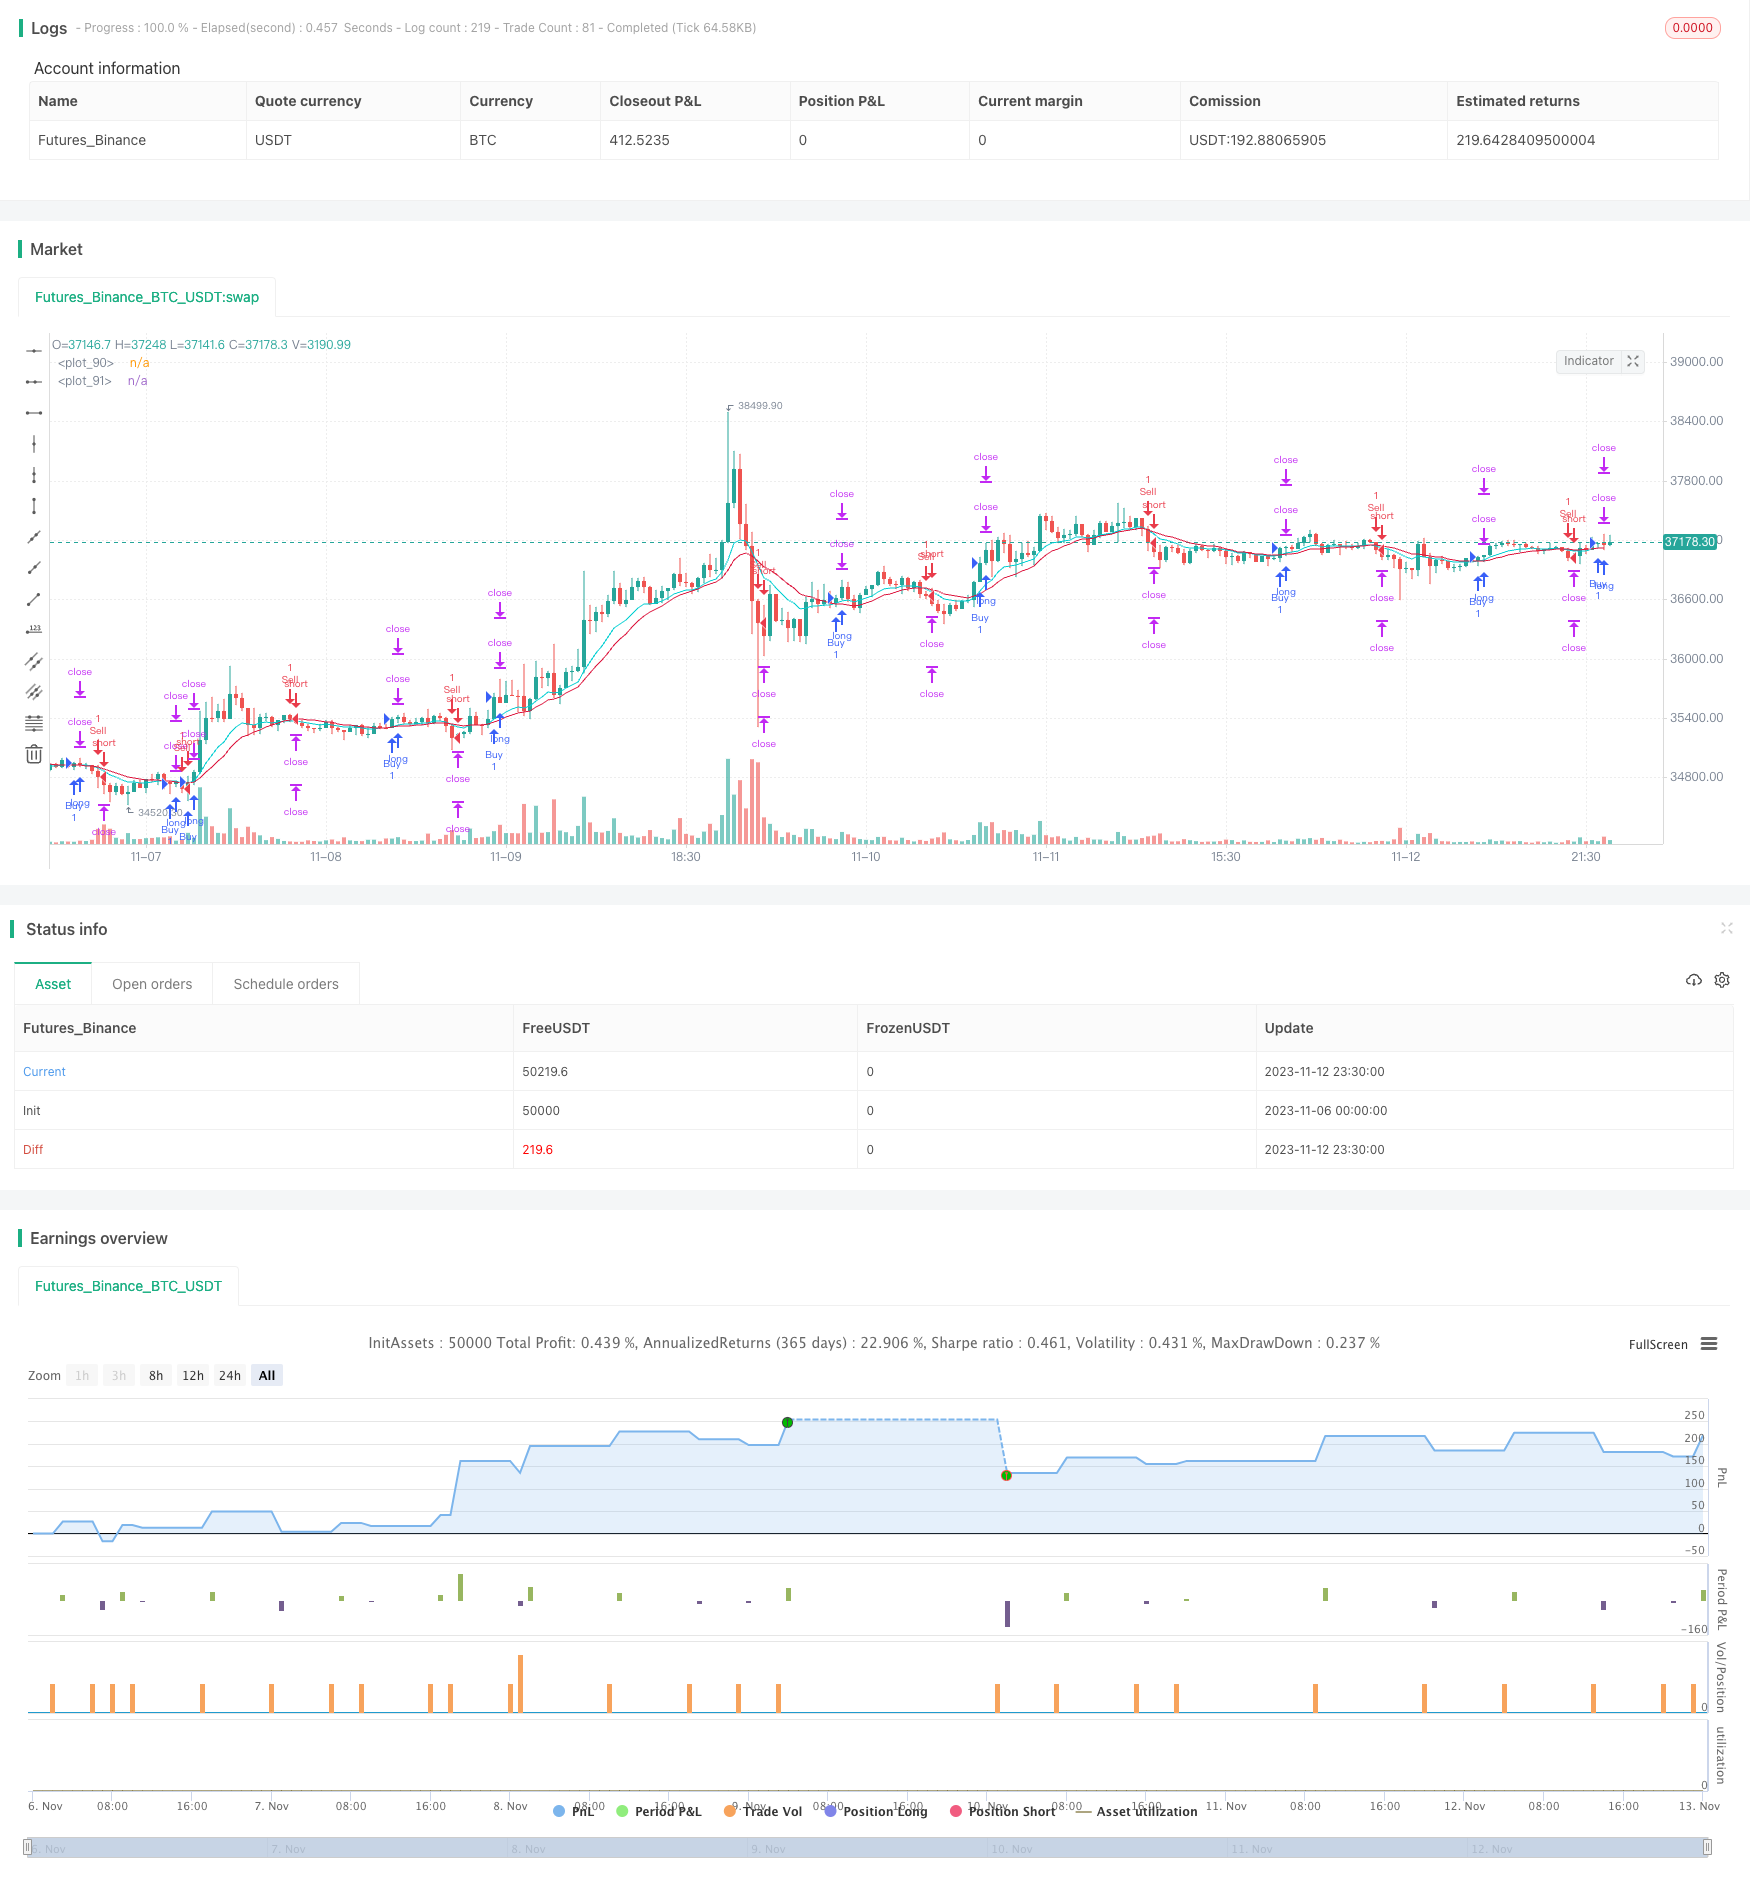
Overview
This strategy utilizes simple moving average crossover and dual take profit techniques to control risk and increase profitability. It is suitable for medium-term trading and capturing opportunities during trend changes.
Strategy Logic
The strategy is based on EMA and WMA crossover to determine market trends. It goes long when EMA crosses above WMA, and goes short when EMA crosses below WMA.
Upon entry, two take profit levels are set. The first take profit is fixed at entry price + 20 pips, and the second take profit is fixed at entry price + 40 pips. Meanwhile, a stop loss is placed at entry price - 20 pips.
When price hits the first take profit, it will close out half of the position. The remaining position will keep running towards the second take profit or until stopped out.
There are three possible outcomes for each trade:
Price hits stop loss, takes 2% loss directly.
Price hits first take profit first, closes half position locking 1% profit, then keeps running until stopped out, ending with break even.
After hitting first take profit, price keeps running and hits second take profit, ending with 1% + 2% = 3% total profit.
Advantage Analysis
The biggest advantage of this dual take profit strategy is that it controls risk and avoids huge single loss. Stop loss caps maximum loss within 2% when market moves against. The two take profits allow bigger gain when trend goes as expected.
Compared to single take profit/stop loss, this strategy has three outcomes - loss, win or break even, reducing the probability of stop loss. Even if stopped out, max loss is limited to 2%. Compared to traditional strategies, the dual take profit mechanism significantly reduces DD and improves win rate.
Another advantage is its simplicity. EMA and WMA are well-known indicators that are easy to understand. The take profit/stop loss logic is straightforward to monitor. These make the strategy easy to be adopted by beginners.
Risk Analysis
Despite the advantages, there are also risks to be aware of for this strategy.
Firstly, as moving average indicators, EMA and WMA have relatively weak capabilities in identifying ranging market. Too many false signals may occur when trend is unclear, leading to over-trading.
Secondly, the fixed take profit/stop loss levels may not adapt to market volatility. They could be penetrated easily during high volatility, rendering them ineffective.
Lastly, the strategy cannot respond to unexpected events, with risk of being trapped. Major news events can create huge price gaps that directly breach the profit/loss levels, causing huge losses.
Optimization Directions
There are several aspects to further optimize the strategy:
Improve entry signals. Test better moving average or trend indicators than EMA and WMA to generate higher quality signals.
Dynamically adjust take profit/stop loss. Use methods like ATR, trailing stop loss etc to make profit/loss levels adapt to markets.
Add filters. Require volume or secondary indicator confirmation before crossover to avoid traps. Also consider whether to trade around major events.
Optimize position sizing. Fine tune position size according to capital management rules.
Conclusion
In summary, this is a simple and practical trend following strategy. It utilizes EMA and WMA crossover for entries, and dual take profit to control risks. Compared to traditional strategies, it has higher win rate and lower risk. Of course, limitations of the indicators and profit/loss settings should be watched out for. Further optimizations can make the strategy more robust.
Parameters
| Name | Default | What it controls |
|---|---|---|
| v_input_1 | true | Buy |
| v_input_2 | true | Sell |
| v_input_3 | 2019 | Start year |
| v_input_4 | true | Start month |
| v_input_5 | true | Start day |
| v_input_6 | false | Start hour |
| v_input_7 | false | Start minute |
| v_input_8 | false | set end time? |
| v_input_9 | 2019 | end year |
| v_input_10 | 12 | end month |
| v_input_11 | 31 | end day |
| v_input_12 | 23 | end hour |
| v_input_13 | 59 | end minute |
| v_input_14 | 10 | EMA period |
| v_input_15 | 20 | WMA period |
| v_input_16 | 20 | a |
| v_input_17 | 40 | b |
| v_input_18 | 10 | Risk per trade% |
Source Pine Script
/*backtest
start: 2023-11-06 00:00:00
end: 2023-11-13 00:00:00
period: 30m
basePeriod: 15m
exchanges: [{"eid":"Futures_Binance","currency":"BTC_USDT"}]
*/

//@version=4
strategy("FS ATR & PS (MA)", overlay=true)

// Strategy
Buy  = input(true)
Sell = input(true)

// Time Period
start_year   = input(title='Start year'   ,defval=2019)
start_month  = input(title='Start month'  ,defval=1)
start_day    = input(title='Start day'    ,defval=1)
start_hour   = input(title='Start hour '  ,defval=0)
start_minute = input(title='Start minute' ,defval=0)
end_time     = input(title='set end time?',defval=false)
end_year     = input(title='end year'     ,defval=2019)
end_month    = input(title='end month'    ,defval=12)
end_day      = input(title='end day'      ,defval=31)
end_hour     = input(title='end hour'     ,defval=23)
end_minute   = input(title='end minute'   ,defval=59)

// MA
ema_period   = input(title='EMA period',defval=10)
wma_period   = input(title='WMA period',defval=20)
ema = ema(close,ema_period)
wma = wma(close,wma_period)

// Entry Condition
longCondition  =
 crossover(ema,wma) and Buy and
 nz(strategy.position_size) == 0 and
 time > timestamp(start_year, start_month, start_day, start_hour, start_minute) and
 (end_time?(time < timestamp(end_year, end_month, end_day, end_hour, end_minute)):true)

shortCondition =
 crossunder(ema,wma) and Sell and
 nz(strategy.position_size) == 0 and
 time > timestamp(start_year, start_month, start_day, start_hour, start_minute) and
 (end_time?(time < timestamp(end_year, end_month, end_day, end_hour, end_minute)):true)

// Exit Condition
a = input(20)*10
b = input(40)*10
c = a*syminfo.mintick
d = b*syminfo.mintick

long_stop_level     = float(na)
long_profit_level1  = float(na)
long_profit_level2  = float(na)
long_even_level     = float(na)

short_stop_level    = float(na)
short_profit_level1 = float(na)
short_profit_level2 = float(na)
short_even_level    = float(na)

long_stop_level     := longCondition  ? close - c : long_stop_level     [1]
long_profit_level1  := longCondition  ? close + c : long_profit_level1  [1]
long_profit_level2  := longCondition  ? close + d : long_profit_level2  [1]
long_even_level     := longCondition  ? close + 0 : long_even_level     [1]

short_stop_level    := shortCondition ? close + c : short_stop_level    [1]
short_profit_level1 := shortCondition ? close - c : short_profit_level1 [1]
short_profit_level2 := shortCondition ? close - d : short_profit_level2 [1]
short_even_level    := shortCondition ? close + 0 : short_even_level    [1]

// Position Sizing
Risk = input(defval=10, title="Risk per trade%", step=1, minval=0, maxval=100)/100
size  = 1

// Strategy
if longCondition
    strategy.entry("Buy"  , strategy.long, qty=size)
    strategy.exit ("Exit1", stop=long_stop_level, limit=long_profit_level1, qty=size/2)
    strategy.exit ("Exit2", stop=long_stop_level, limit=long_profit_level2)

if shortCondition
    strategy.entry("Sell" , strategy.short, qty=size)
    strategy.exit ("Exit3", stop=short_stop_level, limit=short_profit_level1, qty=size/2)
    strategy.exit ("Exit4", stop=short_stop_level, limit=short_profit_level2)

// Plot
plot(strategy.position_size <= 0 ? na : long_stop_level    , color=#dc143c, style=plot.style_linebr, linewidth=1)
plot(strategy.position_size <= 0 ? na : long_profit_level1 , color=#00ced1, style=plot.style_linebr, linewidth=1)
plot(strategy.position_size <= 0 ? na : long_profit_level2 , color=#00ced1, style=plot.style_linebr, linewidth=1)
plot(strategy.position_size <= 0 ? na : long_even_level    , color=#ffffff, style=plot.style_linebr, linewidth=1)
plot(strategy.position_size >= 0 ? na : short_stop_level   , color=#dc143c, style=plot.style_linebr, linewidth=1)
plot(strategy.position_size >= 0 ? na : short_profit_level1, color=#00ced1, style=plot.style_linebr, linewidth=1)
plot(strategy.position_size >= 0 ? na : short_profit_level2, color=#00ced1, style=plot.style_linebr, linewidth=1)
plot(strategy.position_size >= 0 ? na : short_even_level   , color=#ffffff, style=plot.style_linebr, linewidth=1)
plot(ema,color=#00ced1)
plot(wma,color=#dc143c)
Published by ChaoZhang on the FMZ strategy square · last modified 2023-11-14. Collected in the Quant Trading Vault. Unvalidated research: re-test with your own data and costs before trusting it.
Build this with AgenKit
A spec is not a trading system. Paste this into your coding agent and AgenKit runs a specialist team — architecture, test-first build, risk gates, review — with paper trading on by default.
/agenkit build a production-grade trading bot with a backtest engine, risk controls and paper trading by default from strategies/Dual-Take-Profit-Moving-Average-Crossover-Quantitative-Strategy.md- npx agenkit install engineering-kit in your project
- Paste the command into your agent and approve each phase
- Get tests, backtest, risk controls and a paper-trading switch
Understand it first
Before you run this, read the lesson behind the idea and how to backtest it honestly. Specs like this one are the survivors of an unknown number of trials; deflate their results accordingly.
Related specs
- ATR and Moving Average Crossover Hybrid StrategyPine Script · Trend following · 1h
- Bollinger Bands and RSI Trend Following StrategyPine Script · Trend following · 1h
- Dual ATR Channel Trend Following StrategyPine Script · Trend following · 15m
- Dual MA Crossover Trend Tracking StrategyPine Script · Trend following · 1h
- Dual Mode Adaptive Trend Trading Strategy EMA Crossover with ATR Volatility Based Risk Management SystemPine Script · Trend following · 1d
- Dual Moving Average Crossover Dynamic Position Optimization Strategy with EMA Cross Signal SystemPine Script · Trend following · 1h