Dynamic Channel Percentage Envelope Strategy
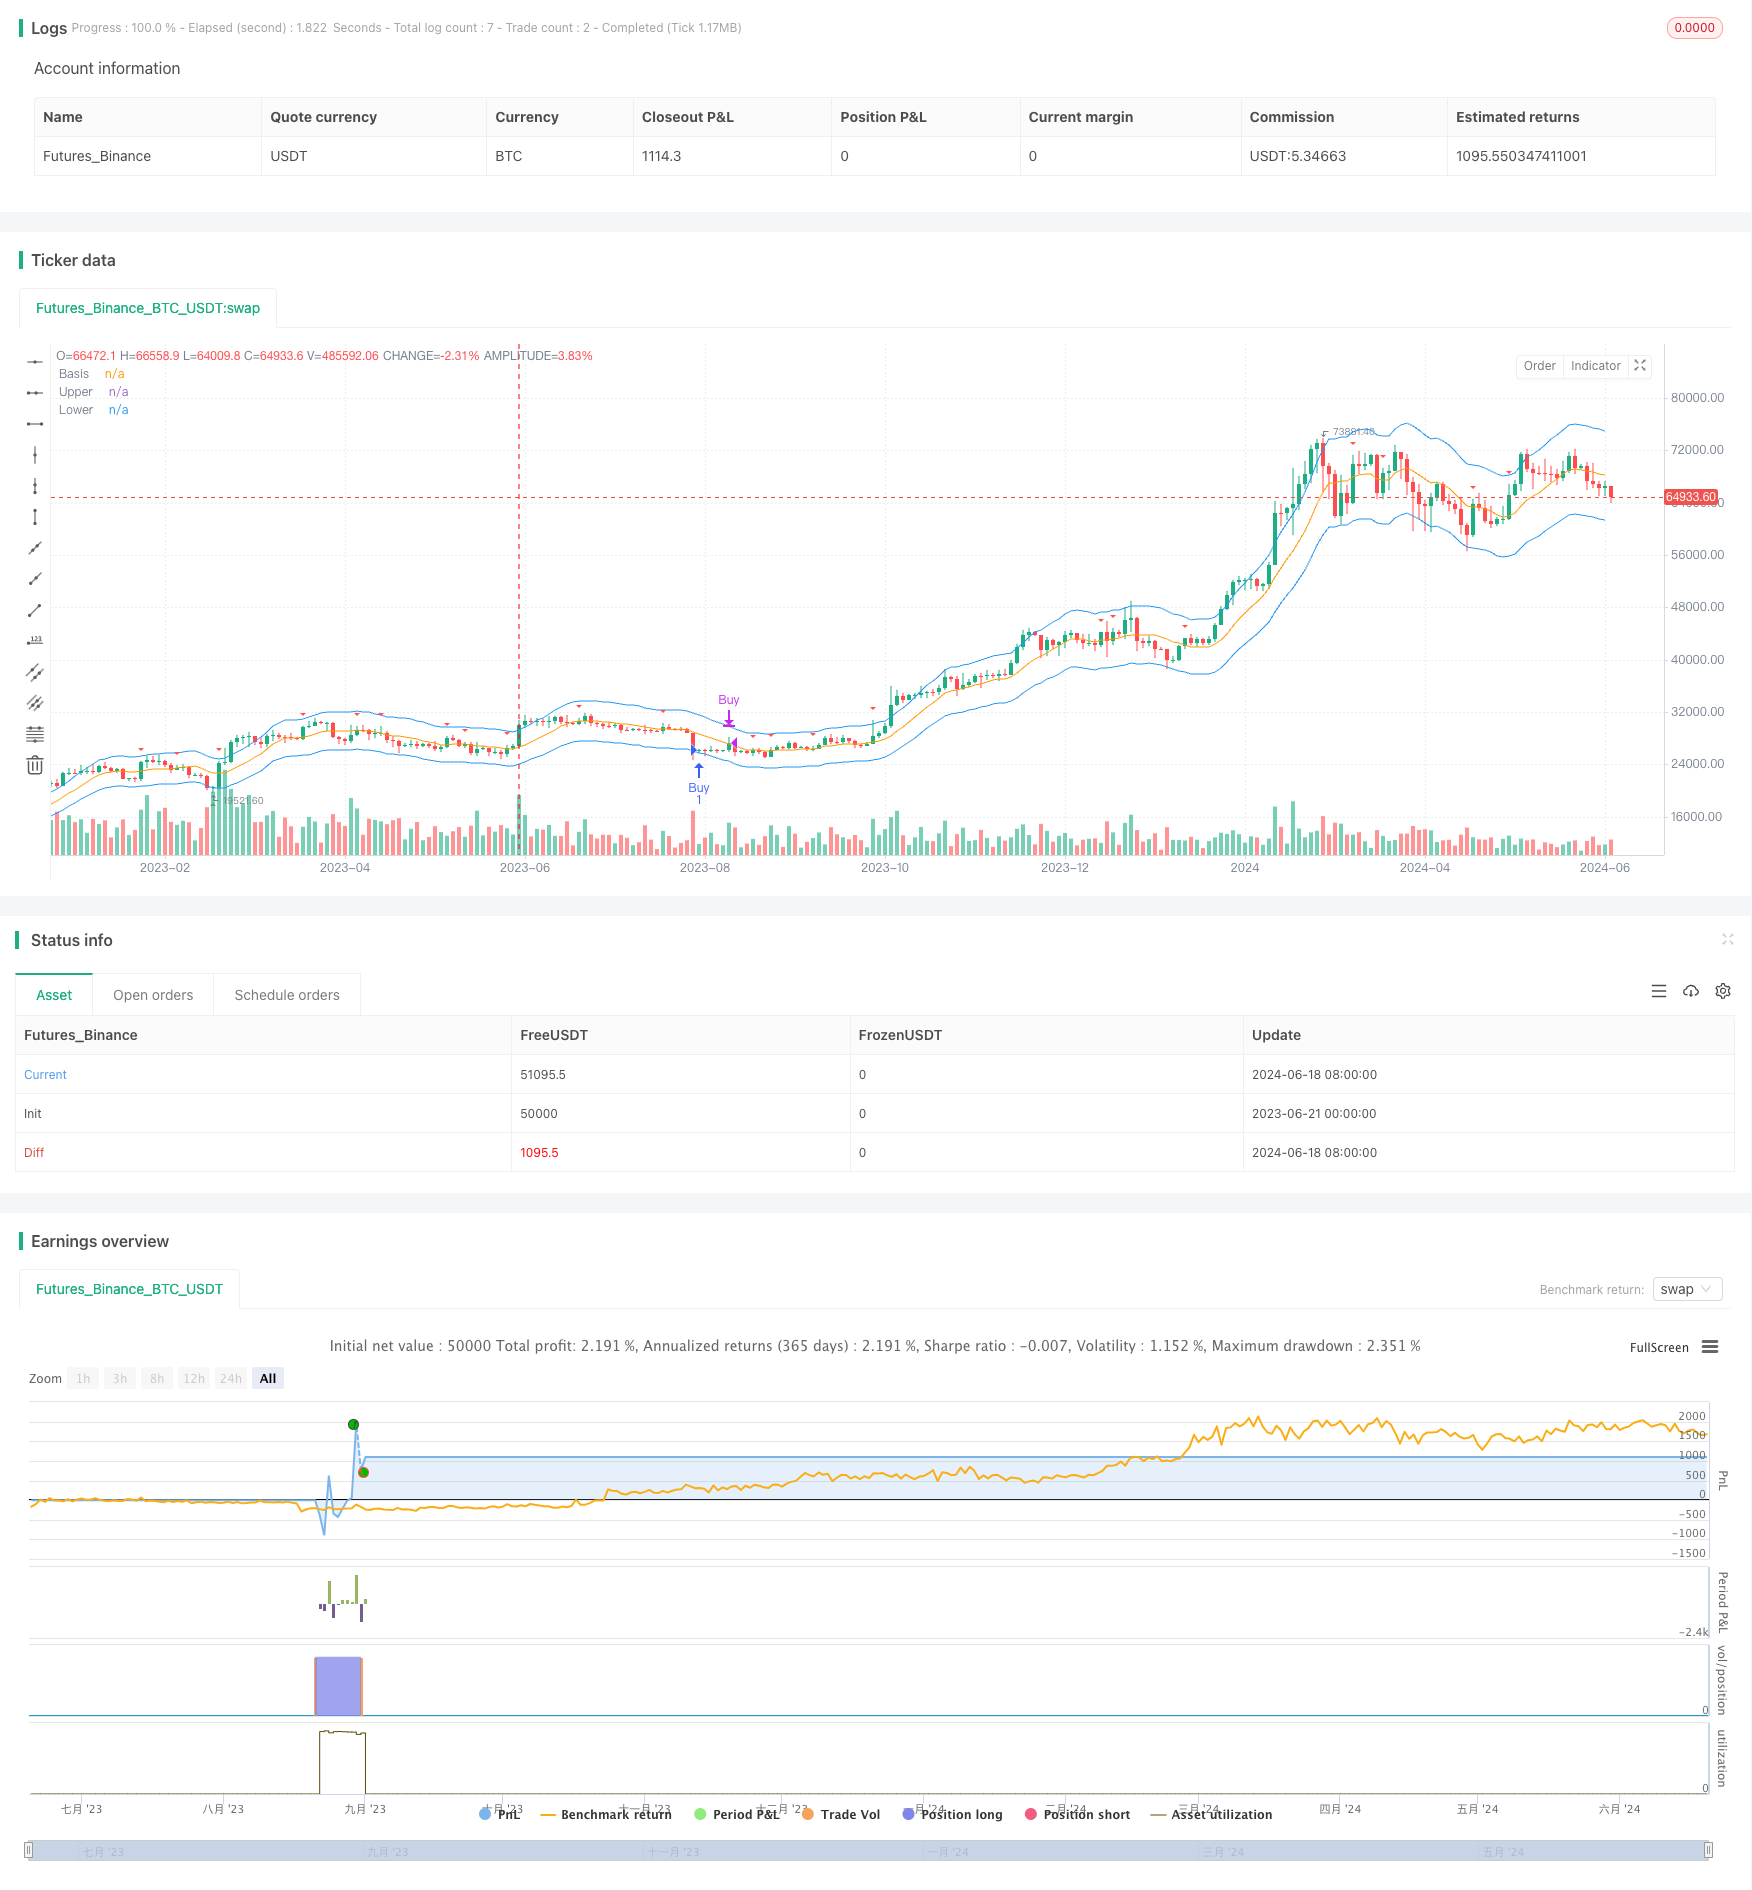
The Dynamic Channel Percentage Envelope Strategy is a trading system based on price movement ranges. This strategy utilizes a Moving Average (MA) as a baseline and sets channel boundaries at a certain percentage…
Overview
The Dynamic Channel Percentage Envelope Strategy is a trading system based on price movement ranges. This strategy utilizes a Moving Average (MA) as a baseline and sets channel boundaries at a certain percentage above and below it. The core idea is to buy when the price touches the lower boundary and sell when it rises back to the centerline, thus capturing price fluctuations within the channel. This approach combines elements of trend following and oscillation trading, aiming to optimize entry and exit timing.
Strategy Principles
Baseline Calculation: The strategy allows users to choose between a Simple Moving Average (SMA) or an Exponential Moving Average (EMA) as the baseline. The default period is 10, but this can be adjusted through input parameters.
Channel Boundary Setting: The upper and lower channel boundaries are determined by adding or subtracting a certain percentage from the baseline. The default percentage is 10%, which can also be adjusted through parameters.
Trade Signal Generation:
- Buy Signal: Triggered when the price crosses above the lower boundary from below.
- Sell Signal: Triggered when the price crosses above the baseline from below.
Trade Execution:
- Open a long position when a buy signal appears and there is no current position.
- Close the position when a sell signal appears and a long position is held.
Strategy Advantages
High Adaptability: By using a moving average as the baseline, the strategy can adapt to different market environments and volatilities.
Effective Risk Management: By setting percentage channels, the strategy can control risk to a certain extent, avoiding frequent trading in extreme market conditions.
High Flexibility: The strategy provides multiple adjustable parameters, including MA type, period, and channel width, allowing users to optimize according to different markets and personal preferences.
Good Visualization: The strategy intuitively displays the baseline and channel boundaries on the chart, making it easy for traders to understand market structure and current position.
Balance between Trend Following and Reversal: By buying at the lower boundary, the strategy can capture potential reversal opportunities; selling at the baseline helps to take profits when the trend continues.
Strategy Risks
False Breakout Risk: Prices may briefly break through the channel boundary and quickly retreat, leading to false signals and unnecessary trades.
Poor Performance in Choppy Markets: In sideways markets without clear trends, the strategy may generate frequent trading signals, increasing transaction costs.
Lag: Due to the use of moving averages, the strategy may react slowly in rapidly changing markets, missing important entry or exit opportunities.
Parameter Sensitivity: Strategy performance largely depends on parameter settings, with different parameter combinations potentially leading to drastically different results.
Dependence on a Single Technical Indicator: Relying solely on the relationship between price and the channel for trading may ignore other important market information and fundamental factors.
Strategy Optimization Directions
Introduce Multi-Timeframe Analysis: Combining longer-term trend judgments can improve trading accuracy and profitability.
Add Filtering Conditions: For example, adding volume confirmation or other technical indicators (such as RSI, MACD) as auxiliary judgments can reduce false signals.
Dynamically Adjust Channel Width: Automatically adjust the channel percentage based on market volatility to adapt to different market environments.
Optimize Exit Mechanism: Consider introducing trailing stops or volatility-based dynamic stops to better protect profits.
Implement Partial Position Management: Allow for partial position building and closing to reduce the risk of single decisions.
Incorporate Market Sentiment Indicators: Combine market sentiment indicators such as the VIX index to adjust strategy parameters or pause trading during high volatility periods.
Develop Adaptive Parameter Mechanisms: Use machine learning algorithms to automatically optimize strategy parameters based on historical data.
Conclusion
The Dynamic Channel Percentage Envelope Strategy is a flexible trading system that combines trend following and oscillation trading concepts. By setting percentage channels based on moving averages, the strategy can capture price movement opportunities in different market environments. Its strengths lie in strong adaptability, effective risk management, and high visualization, but it also faces risks such as false breakouts and poor performance in choppy markets.
To further enhance strategy performance, consider introducing multi-timeframe analysis, adding filtering conditions, dynamically adjusting channel width, and other optimization directions. Additionally, combining other technical indicators and fundamental analysis, as well as implementing more sophisticated position management and risk control mechanisms, are worthwhile improvement paths to explore.
Overall, the Dynamic Channel Percentage Envelope Strategy provides traders with a solid framework that has the potential to become a robust trading tool through reasonable parameter settings and continuous optimization. However, like all trading strategies, when applying it to live trading, it's necessary to carefully evaluate market conditions and make appropriate adjustments based on individual risk tolerance and trading objectives.
Source Pine Script
/*backtest
start: 2023-06-21 00:00:00
end: 2024-06-20 00:00:00
period: 2d
basePeriod: 1d
exchanges: [{"eid":"Futures_Binance","currency":"BTC_USDT"}]
*/

//@version=4
strategy("Envelope Strategy", overlay=true)

// Input parameters
len = input(10, title="Length", minval=1)
percent = input(10.0, title="Percent")
src = input(close, title="Source")
exponential = input(false, title="Use EMA")

// Calculate basis, upper, and lower envelopes
basis = exponential ? ema(src, len) : sma(src, len)
k = percent / 100.0
upper = basis * (1 + k)
lower = basis * (1 - k)

// Buy and Sell conditions
buy_signal = crossover(src, lower)
sell_signal = crossover(src, basis)

// Plotting the basis, upper, and lower envelopes
plot(basis, "Basis", color=color.orange)
plot(upper, "Upper", color=color.blue)
plot(lower, "Lower", color=color.blue)

// Plotting buy and sell signals
plotshape(buy_signal, title="Buy Signal", location=location.belowbar, color=color.green, style=shape.triangleup, size=size.small)
plotshape(sell_signal, title="Sell Signal", location=location.abovebar, color=color.red, style=shape.triangledown, size=size.small)

// Trading operations
if (buy_signal and strategy.position_size == 0)
    strategy.entry("Buy", strategy.long)
if (sell_signal and strategy.position_size == 1)
    strategy.close("Buy")
Published by ChaoZhang on the FMZ strategy square · last modified 2024-06-21. Collected in the Quant Trading Vault. Unvalidated research: re-test with your own data and costs before trusting it.
Build this with AgenKit
A spec is not a trading system. Paste this into your coding agent and AgenKit runs a specialist team — architecture, test-first build, risk gates, review — with paper trading on by default.
/agenkit build a production-grade trading bot with a backtest engine, risk controls and paper trading by default from strategies/Dynamic-Channel-Percentage-Envelope-Strategy.md- npx agenkit install engineering-kit in your project
- Paste the command into your agent and approve each phase
- Get tests, backtest, risk controls and a paper-trading switch
Understand it first
Before you run this, read the lesson behind the idea and how to backtest it honestly. Specs like this one are the survivors of an unknown number of trials; deflate their results accordingly.
Related specs
- Adaptive Multi Period Trading Strategy Based on Wave Trend Momentum BreakoutPine Script · Breakout · 2h
- BB Breakout StrategyPine Script · Breakout · 1d
- BMSB Breakout Strategy BMSBPine Script · Breakout · 1h
- Bollinger Band T3 Moving Average StrategyPine Script · Breakout · 10m
- Bollinger Bands Dual track Breakthrough StrategyPine Script · Breakout · 30m
- Bollinger Breakout StrategyPine Script · Breakout · 30m