Strategy vault / Trend following
Dynamic MA Crossover Trend Following Strategy
This strategy uses the crossover of dynamic resistance/support bands and MA lines as entry signals, and adopts trend following stops to lock in profits.
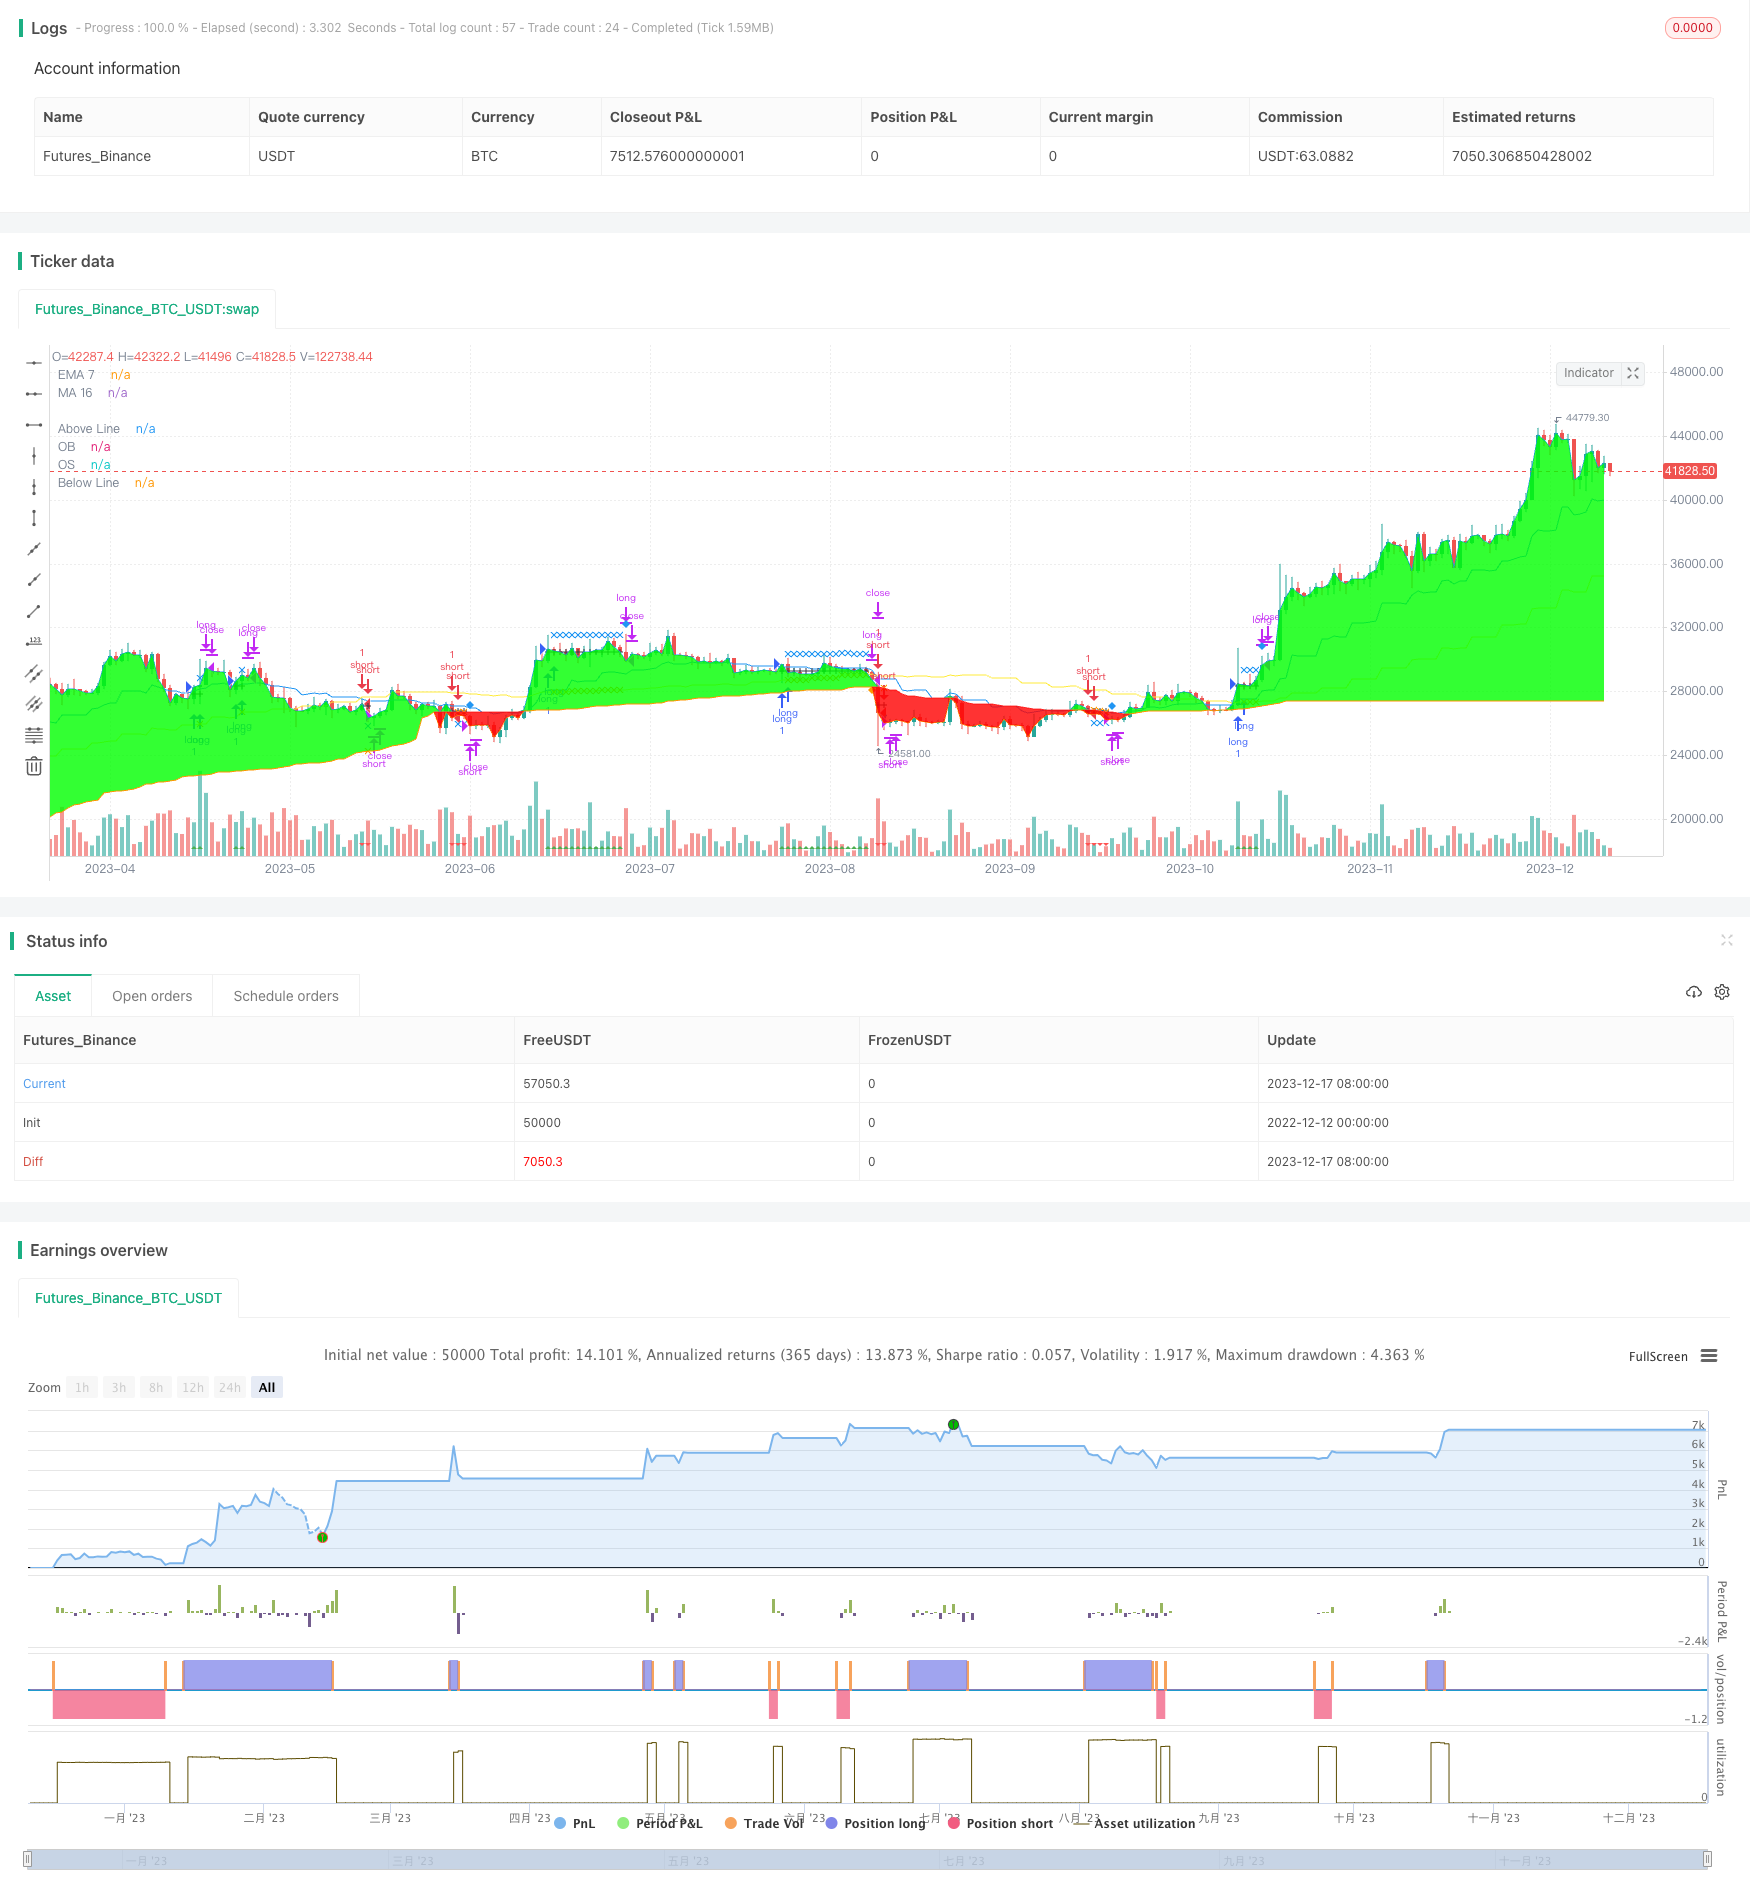
Overview
This strategy uses the crossover of dynamic resistance/support bands and MA lines as entry signals, and adopts trend following stops to lock in profits.
Strategy Logic
Calculate dynamic resistance and support levels using percentile statistics to identify potential reversal zones.
When price enters the reversal zone, check if fast MA crosses over/under slow MA to generate trading signals.
After entry, start trailing stop mechanism to lock in profits dynamically and follow the trend.
When price hits predefined stop loss or take profit levels, close positions.
Advantages
Dynamic bands help identify potential reversal areas and improve entry accuracy.
Combining MA crossover and percentile channel avoids false signals.
Trailing stop locks in profits effectively and prevents excessive drawdowns.
Customizable parameters suit different market environments.
Risks
False signals may occur in non-trending markets.
Overly aggressive entries due to improper parameter tuning.
Backtest data should cover sufficient market cycles.
Consider wider stops in live trading to prevent gaps.
Enhancement
Test different MA periods combinations.
Optimize reversal identification by adjusting dynamic bands parameters.
Evaluate impacts on equity curve from different trailing stop parameters.
Try adding filters to improve reliability.
Conclusion
The overall logic of this strategy is clear. It uses dynamic bands to filter signals, judges trend direction by MA crossover, and effectively controls risk with trailing stop mechanism. Further optimization through parameter tuning can continuously improve strategy performance for production.
Parameters
| Name | Default | What it controls |
|---|---|---|
| v_input_1 | 0 | Trade Type : BOTH | SHORT | LONG |
| v_input_2 | 2017 | From Year |
| v_input_3 | 9999 | To Year |
| v_input_4 | true | Stop Loss Percent |
| v_input_5 | 3.5 | Profit Percent LONG |
| v_input_6 | 3 | Profit Percent SHORT |
| v_input_7 | 1.5 | ATR Multiple for PT |
| v_input_8 | 1.5 | ATR Multiple for SL |
| v_input_9 | 128 | DZ Length |
| v_input_10 | 40 | Hi is Above X% of Sample |
| v_input_11 | 60 | Lo is Below X% of Sample |
| v_input_12 | 5D | MA16 Resolution |
| v_input_13 | true | Use DZ SL |
Source Pine Script
/*backtest
start: 2022-12-12 00:00:00
end: 2023-12-18 00:00:00
period: 1d
basePeriod: 1h
exchanges: [{"eid":"Futures_Binance","currency":"BTC_USDT"}]
*/

// This source code is subject to the terms of the Mozilla Public License 2.0 at https://mozilla.org/MPL/2.0/
// © allanster

//@version=4

strategy("MA-EMA Crossover LT", shorttitle="MA-EMA XO", overlay=true)


//==================== STRATEGY CODE ======================

tradeType = input("BOTH", title="Trade Type ", options=["LONG", "SHORT", "BOTH"])

// === BACKTEST RANGE ===
FromMonth = 01//input(defval=01, title="From Month", minval=1)
FromDay = 01//input(defval=01, title="From Day", minval=1)
FromYear = input(defval=2017, title="From Year", minval=2000)
ToMonth = 12//input(defval=12, title="To Month", minval=1)
ToDay = 31//input(defval=31, title="To Day", minval=1)
ToYear = input(defval=9999, title="To Year", minval=2000)

testPeriod() =>
    time > timestamp(FromYear, FromMonth, FromDay, 00, 00) and
       time < timestamp(ToYear, ToMonth, ToDay, 23, 59)

stopLossPercent = input(1.00, "Stop Loss Percent")
profitPercent_long = input(3.50, "Profit Percent LONG")
profitPercent_short = input(3.0, "Profit Percent SHORT")

atr_multi_PT = input(1.50, "ATR Multiple for PT")
atr_multi_SL = input(1.50, "ATR Multiple for SL")
//////////////////////////////

isLongOpen = false
isShortOpen = false

//Order open on previous ticker?
isLongOpen := nz(isLongOpen[1])
isShortOpen := nz(isShortOpen[1])

/////////////////////
//Trailing and Profit variables
trigger = 0.0
trigger := na

profitTrigger = 0.0
profitTrigger := na

//obtain values from last ticker
entryPrice = 0.0
entryPrice := nz(entryPrice[1])

stopLossLevel = 0.0
stopLossLevel := nz(stopLossLevel[1])

profitPriceLevel = 0.0
profitPriceLevel := nz(profitPriceLevel[1])


//If in active trade, lets load with current value
if isLongOpen
    profitTrigger := profitPriceLevel ? high : na
    trigger := stopLossLevel ? ohlc4 : na
    trigger
if isShortOpen
    profitTrigger := profitPriceLevel ? low : na
    trigger := stopLossLevel ? ohlc4 : na
    trigger

isStopLoss = isLongOpen ? trigger < stopLossLevel :
   isShortOpen ? trigger > stopLossLevel : na
isProfitCatch = isLongOpen ? profitTrigger > profitPriceLevel :
   isShortOpen ? profitTrigger < profitPriceLevel : na

//===================      Optional Entry Condition    ============
src    = close
len = input(defval = 128, title = "DZ Length", type = input.integer, minval = 1)
// use_dz = input(false, title="Use Dynamic Zone")
pcntAbove = input(defval = 40, title = "Hi is Above X% of Sample", type = input.float, minval = 0, maxval = 100, step = 1.0)
pcntBelow = input(defval = 60, title = "Lo is Below X% of Sample", type = input.float, minval = 0, maxval = 100, step = 1.0)

smplAbove = percentile_nearest_rank(src, len, pcntAbove)
smplBelow = percentile_nearest_rank(src, len, 100 - pcntBelow)

above     = plot(src > smplAbove ? src : smplAbove, title = "Above Line", color = na)
probOB    = plot(smplAbove, title = "OB", color = color.green)
probOS    = plot(smplBelow, title = "OS", color = color.red)
below     = plot(src < smplBelow ? src : smplBelow, title = "Below Line", color = na)
fill(above,  probOB, color = #00FF00, transp = 80)
fill(below,  probOS, color = #FF0000, transp = 80)

// long_dz = close > smplAbove
// short_dz = close < smplBelow


//==============           Entry Conditions        =====================
timeframe = input("5D", title="MA16 Resolution", type=input.resolution)
_ma = sma(hlc3, 16)
ma=security(syminfo.tickerid, timeframe, _ma, barmerge.gaps_off, barmerge.lookahead_on)

_ema=ema(hlc3,7)
ema=security(syminfo.tickerid, timeframe, _ema, barmerge.gaps_off, barmerge.lookahead_on)


long = ma[1] > ema[1] ? crossover(ema, ma) : abs(ma - ema)/ma > 0.025 ? crossover(close, ema) : false
short = ma[1] < ema[1] ? crossunder(ema,ma) : abs(ma - ema)/ma > 0.025 ? crossunder(close, ema): false //:crossunder(close, ema)

longEntry = (tradeType == "LONG" or tradeType == "BOTH") and long
shortEntry = (tradeType == "SHORT" or tradeType == "BOTH") and short

//Upon Entry, do this.
if longEntry or shortEntry
    entryPrice := ohlc4
    entryPrice

//set price points for new orders
use_dz_sl = input(true, title="Use DZ SL")
if isLongOpen
    stopLossLevel := use_dz_sl? max(smplAbove, ma) : ema - 0.25*atr_multi_PT* atr(32) //ma
    profitTrail = ma + atr_multi_PT* atr(32)
    profitPriceLevel :=  max( (1 + 0.01 * profitPercent_long) * entryPrice, profitTrail)
    profitPriceLevel
if isShortOpen
    stopLossLevel :=  use_dz_sl? min(smplBelow, ma) : ema + 0.25*atr_multi_PT* atr(32) //ma
    profitTrail = ma - atr_multi_PT* atr(32)
    profitPriceLevel := min( (1 - 0.01 * profitPercent_short) * entryPrice, profitTrail)
    profitPriceLevel

shortExit = isShortOpen[1] and (isStopLoss or isProfitCatch or longEntry)
longExit = isLongOpen[1] and (isStopLoss or isProfitCatch or shortEntry)


if (longExit or shortExit) and not(longEntry or shortEntry)
    trigger := na
    profitTrigger := na
    entryPrice := na
    stopLossLevel := na
    profitPriceLevel := na
    // highest := na
    // lowest := na
    // lowest

if testPeriod() and (tradeType == "LONG" or tradeType == "BOTH")
    strategy.entry("long", strategy.long, when=longEntry)
    strategy.close("long", when=longExit)

if testPeriod() and (tradeType == "SHORT" or tradeType == "BOTH")
    strategy.entry("short", strategy.short, when=shortEntry)
    strategy.close("short", when=shortExit)


//If the value changed to invoke a buy, lets set it before we leave
isLongOpen := longEntry ? true : longExit == true ? false : isLongOpen
isShortOpen := shortEntry ? true : shortExit == true ? false : isShortOpen


plotshape(isShortOpen, title="Short Open", color=color.red, style=shape.triangledown, location=location.bottom)
plotshape(isLongOpen, title="Long Open", color=color.green, style=shape.triangleup, location=location.bottom)

plotshape(entryPrice ? entryPrice : na, title="Entry Level", color=color.black, style=shape.cross, location=location.absolute)
plotshape(stopLossLevel ? stopLossLevel : na, title="Stop Loss Level", color=color.orange, style=shape.xcross, location=location.absolute)
plotshape(profitPriceLevel ? profitPriceLevel : na, title="Profit Level", color=color.blue, style=shape.xcross, location=location.absolute)
plotshape(profitTrigger[1] ? isProfitCatch : na, title="Profit Exit Triggered", style=shape.diamond, location=location.abovebar, color=color.blue, size=size.small)
plotshape(trigger[1] ? isStopLoss : na, title="Stop Loss Triggered", style=shape.diamond, location=location.belowbar, color=color.orange, size=size.small)

plot(ma, title="MA 16", color=color.yellow)
plot(ema, title="EMA 7", color=color.blue)Published by ChaoZhang on the FMZ strategy square · last modified 2023-12-19. Collected in the Quant Trading Vault. Unvalidated research: re-test with your own data and costs before trusting it.
Build this with AgenKit
A spec is not a trading system. Paste this into your coding agent and AgenKit runs a specialist team — architecture, test-first build, risk gates, review — with paper trading on by default.
/agenkit build a production-grade trading bot with a backtest engine, risk controls and paper trading by default from strategies/Dynamic-MA-Crossover-Trend-Following-Strategy.md- npx agenkit install engineering-kit in your project
- Paste the command into your agent and approve each phase
- Get tests, backtest, risk controls and a paper-trading switch
Understand it first
Before you run this, read the lesson behind the idea and how to backtest it honestly. Specs like this one are the survivors of an unknown number of trials; deflate their results accordingly.
Related specs
- ATR and Moving Average Crossover Hybrid StrategyPine Script · Trend following · 1h
- Bollinger Bands and RSI Trend Following StrategyPine Script · Trend following · 1h
- Dual ATR Channel Trend Following StrategyPine Script · Trend following · 15m
- Dual MA Crossover Trend Tracking StrategyPine Script · Trend following · 1h
- Dual Mode Adaptive Trend Trading Strategy EMA Crossover with ATR Volatility Based Risk Management SystemPine Script · Trend following · 1d
- Dual Moving Average Crossover Dynamic Position Optimization Strategy with EMA Cross Signal SystemPine Script · Trend following · 1h