Strategy vault / Trend following
Dynamic Oscillation Trend Capture Strategy
The Dynamic Oscillation Trend Capture Strategy is a quantitative trading strategy that combines the MACD indicator with the Hilo Activator indicator. This strategy aims to capture market trend changes and volatility…
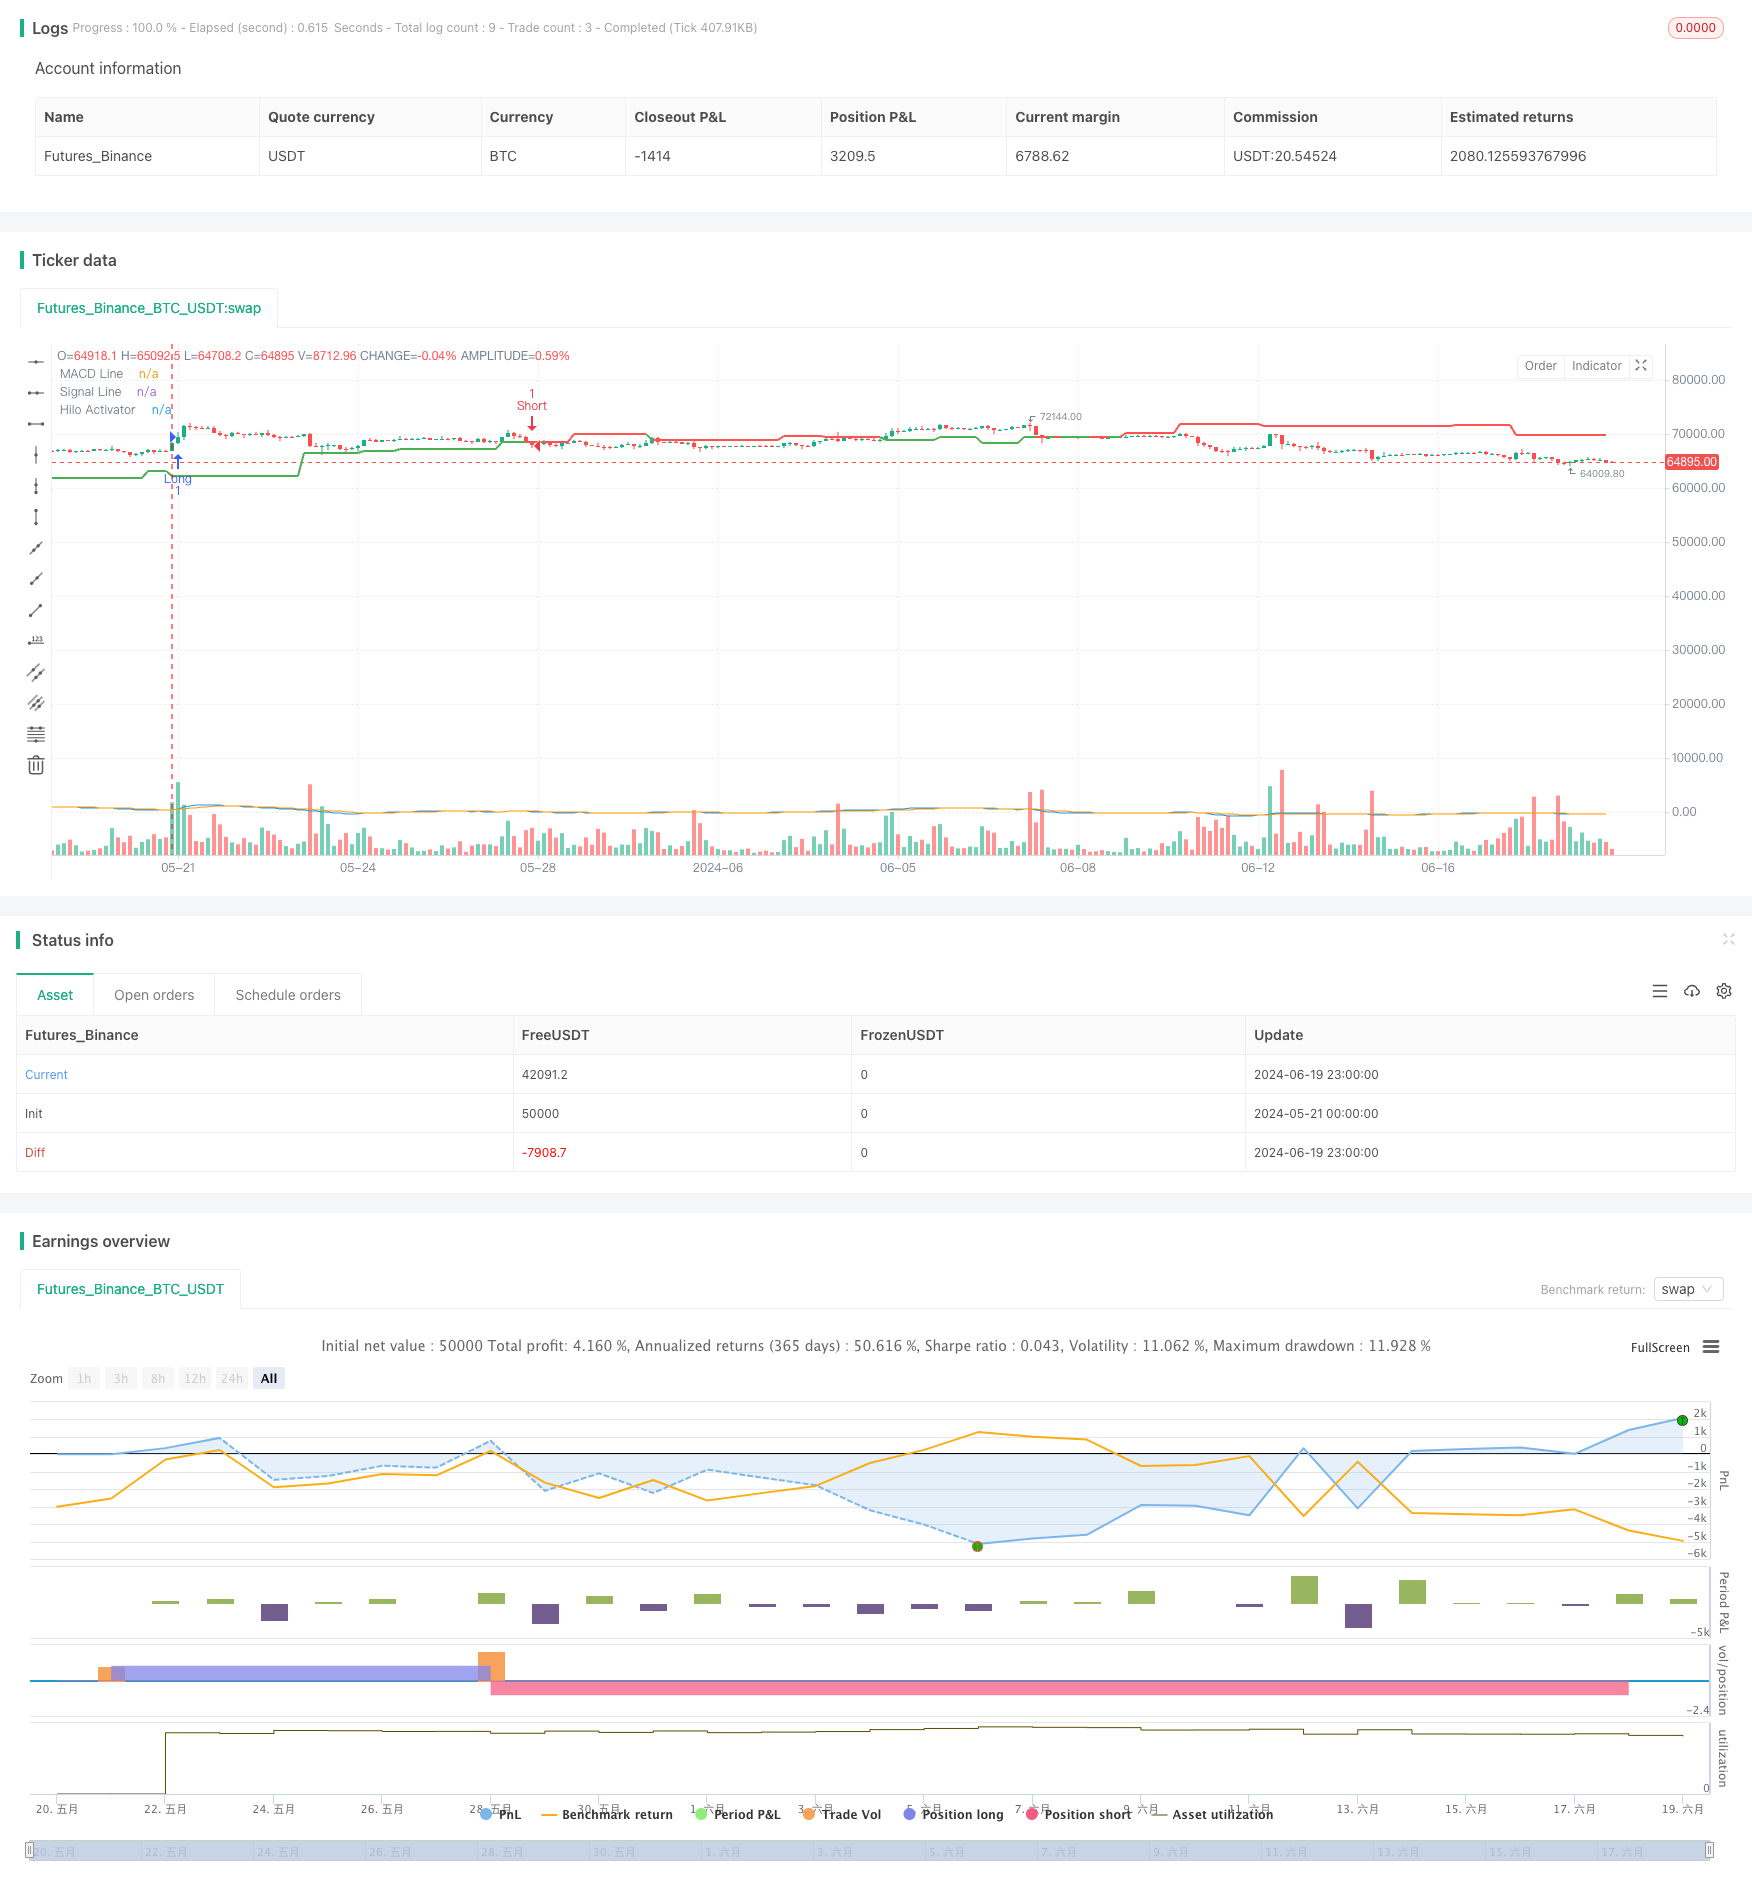
Overview
The Dynamic Oscillation Trend Capture Strategy is a quantitative trading strategy that combines the MACD indicator with the Hilo Activator indicator. This strategy aims to capture market trend changes and volatility opportunities by using crossover signals from these two indicators to determine entry and exit points. The core idea of the strategy is to use the MACD indicator to identify trend strength and direction while utilizing the Hilo Activator as a supplementary tool for trend confirmation and risk control.
Strategy Principles
MACD Indicator:
- Uses parameters of 12 for fast length, 26 for slow length, and 9 for signal smoothing.
- Crossovers between the MACD line and signal line generate trading signals.
Hilo Activator Indicator:
- Calculated based on the highest and lowest points over 4 periods.
- Used to confirm trend direction and provide additional risk management.
Trading Logic:
- Open a long position when the MACD line crosses above the signal line and the Hilo Activator is green.
- Open a short position when the MACD line crosses below the signal line and the Hilo Activator is red.
Visualization:
- Hilo Activator is plotted as a line, red when above the closing price and green when below.
- MACD line and signal line are plotted in blue and orange, respectively, on the chart.
Strategy Advantages
Multi-Indicator Fusion: Combines trend-following (MACD) and oscillation capture (Hilo Activator) indicators, improving signal reliability.
Trend Confirmation: Uses Hilo Activator as a trend confirmation tool, reducing the impact of false breakouts and signals.
Flexibility: Strategy parameters can be adjusted to adapt to different market environments and trading instruments.
Visual Intuitiveness: Through color coding and graphical representation, traders can visually understand market conditions and signals.
Risk Management: Hilo Activator provides an additional layer of risk control, helping to limit losses.
Strategy Risks
Sideways Market Risk: In ranging or oscillating markets, frequent false signals may lead to overtrading and losses.
Lag: Both MACD and Hilo Activator are lagging indicators, potentially missing important turning points in rapidly changing markets.
Parameter Sensitivity: Strategy performance is highly dependent on chosen parameters, which may require different settings for various market conditions.
Trend Dependency: The strategy performs best in strong trend markets but may underperform in markets with unclear trends.
Lack of Stop-Loss Mechanism: The code does not include an explicit stop-loss strategy, which may lead to excessive losses in adverse market conditions.
Strategy Optimization Directions
Introduce Adaptive Parameters: Automatically adjust MACD and Hilo Activator parameters based on market volatility to adapt to different market environments.
Add Stop-Loss and Take-Profit Mechanisms: Implement ATR-based or fixed percentage stop-loss and take-profit points to control risk and lock in profits.
Incorporate Volume Analysis: Combine volume indicators to improve signal reliability and entry timing accuracy.
Optimize Signal Filtering: Add additional filtering conditions, such as trend strength or volatility indicators, to reduce false signals.
Implement Dynamic Position Sizing: Adjust position size for each trade based on market conditions and account risk.
Add Time Filters: Avoid trading during periods of high volatility or low liquidity.
Introduce Machine Learning Algorithms: Use machine learning techniques to optimize parameter selection and signal generation processes.
Conclusion
The Dynamic Oscillation Trend Capture Strategy is a quantitative trading system that combines MACD and Hilo Activator indicators. By fusing these two indicators, the strategy aims to capture market trend changes and volatility opportunities. The strategy's strengths lie in its multi-indicator fusion approach and flexible parameter settings, allowing it to adapt to different market environments. However, the strategy also faces challenges such as sideways market risk and parameter sensitivity.
To further enhance the strategy's performance, considerations can be made to introduce adaptive parameters, improve risk management mechanisms, incorporate additional technical indicators, and utilize machine learning techniques for optimization. Through these improvements, the strategy has the potential to achieve more stable and reliable performance under various market conditions.
Overall, the Dynamic Oscillation Trend Capture Strategy provides traders with a promising quantitative trading framework. However, in practical application, traders need to carefully evaluate the strategy's risks and make necessary adjustments and optimizations based on specific trading objectives and market environments.
Source Pine Script
/*backtest
start: 2024-05-21 00:00:00
end: 2024-06-20 00:00:00
period: 3h
basePeriod: 15m
exchanges: [{"eid":"Futures_Binance","currency":"BTC_USDT"}]
*/

//@version=5
strategy("Hilo MACD Strategy", overlay=true)

// Parâmetros do Hilo Activator
hiloPeriod = input.int(4, title="Hilo Period")

// Cálculo do Hilo Activator
hiloHigh = ta.highest(high, hiloPeriod)
hiloLow = ta.lowest(low, hiloPeriod)
hiloActivator = ta.valuewhen(close > hiloHigh[1] and close[1] < hiloHigh[2], hiloHigh, hiloPeriod)
hiloActivator := na(hiloActivator) ? ta.valuewhen(close < hiloLow[1] and close[1] > hiloLow[2], hiloLow, hiloPeriod) : hiloActivator
hiloActivator := na(hiloActivator) ? ta.valuewhen(close[1] > hiloHigh[1] and close < hiloLow[1], hiloLow, hiloPeriod) : hiloActivator

hiloColor = hiloActivator > close ? color.red : color.green
plot(hiloActivator, title="Hilo Activator", color=hiloColor, linewidth=2)

// Parâmetros do MACD
fastLength = input.int(12, title="MACD Fast Length")
slowLength = input.int(26, title="MACD Slow Length")
signalSmoothing = input.int(9, title="MACD Signal Smoothing")

// Cálculo do MACD
[macdLine, signalLine, _] = ta.macd(close, fastLength, slowLength, signalSmoothing)

// Plot MACD para visualização
plot(macdLine, title="MACD Line", color=color.blue)
plot(signalLine, title="Signal Line", color=color.orange)

// Condições de entrada e saída
longCondition = ta.crossover(macdLine, signalLine) and hiloColor == color.green
shortCondition = ta.crossunder(macdLine, signalLine) and hiloColor == color.red

if (longCondition)
    strategy.entry("Long", strategy.long)

if (shortCondition)
    strategy.entry("Short", strategy.short)
Published by ChaoZhang on the FMZ strategy square · last modified 2024-06-21. Collected in the Quant Trading Vault. Unvalidated research: re-test with your own data and costs before trusting it.
Build this with AgenKit
A spec is not a trading system. Paste this into your coding agent and AgenKit runs a specialist team — architecture, test-first build, risk gates, review — with paper trading on by default.
/agenkit build a production-grade trading bot with a backtest engine, risk controls and paper trading by default from strategies/Dynamic-Oscillation-Trend-Capture-Strategy.md- npx agenkit install engineering-kit in your project
- Paste the command into your agent and approve each phase
- Get tests, backtest, risk controls and a paper-trading switch
Understand it first
Before you run this, read the lesson behind the idea and how to backtest it honestly. Specs like this one are the survivors of an unknown number of trials; deflate their results accordingly.
Related specs
- Adaptive ATR and RSI Trend Following Strategy with Trailing Stop LossPine Script · Trend following · 1h
- Adaptive Bollinger Bands Trend Tracking StrategyPine Script · Trend following · 1h
- Adaptive Price Crossing Moving Average Trading StrategyPine Script · Trend following · 1d
- Advanced Multi Indicator Multi Dimensional Trend Cross Quantitative StrategyPine Script · Trend following · 3h
- Advanced Supertrend Indicator Trading Mechanism Optimization StrategyPine Script · Trend following · 1d
- Bollinger Bands and RSI Trend Following StrategyPine Script · Trend following · 1h