Strategy vault / Trend following
Dynamic WaveTrend and Fibonacci Integrated Quantitative Trading Strategy
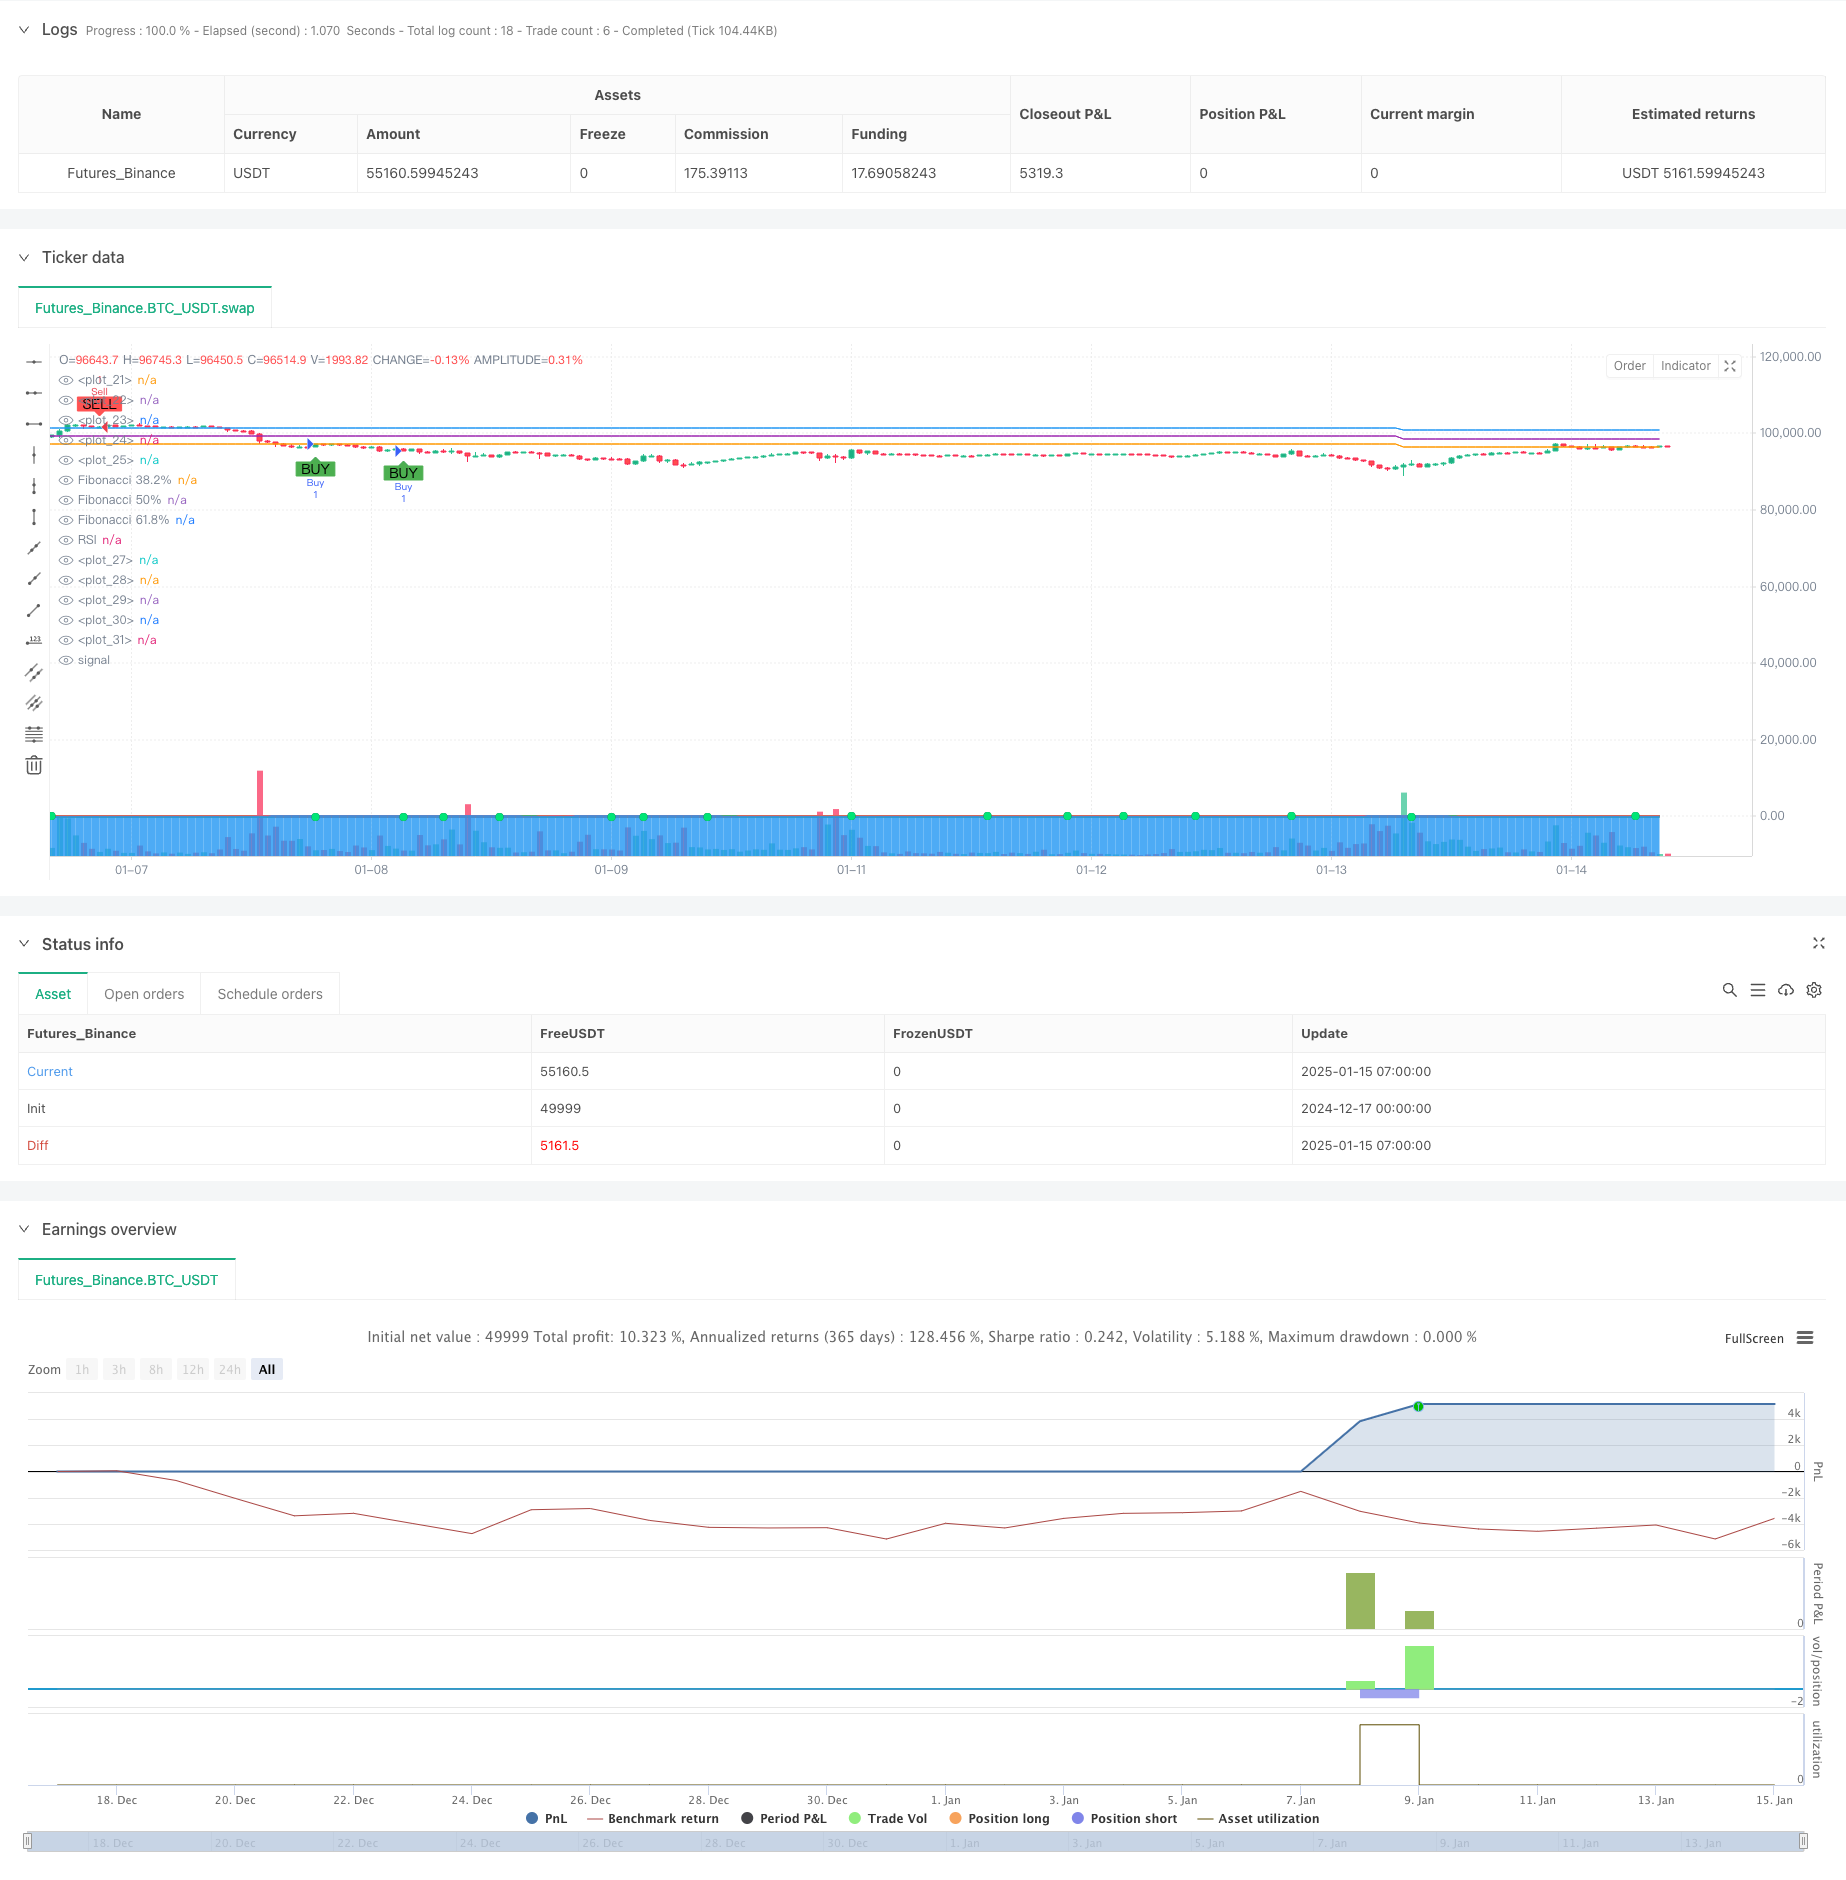
This is a comprehensive quantitative trading strategy that combines WaveTrend indicator, Fibonacci retracement levels, and RSI indicator. The strategy seeks optimal trading opportunities in market trends and price…
Overview
This is a comprehensive quantitative trading strategy that combines WaveTrend indicator, Fibonacci retracement levels, and RSI indicator. The strategy seeks optimal trading opportunities in market trends and price fluctuations through the coordination of multiple technical indicators. It continuously tracks market trends through dynamic adjustment and improves trading accuracy through multiple signal confirmations.
Strategy Principle
The strategy is based on several core elements:
- WaveTrend indicator: Constructs a dynamic volatility channel by calculating the exponential moving average (EMA) and standard deviation of prices. Trading signals are generated when the fast line (WT1) crosses the slow line (WT2).
- Fibonacci retracement levels: The strategy dynamically calculates and updates price highs and lows, drawing three key Fibonacci retracement levels at 38.2%, 50%, and 61.8%.
- RSI indicator: Uses a 14-period Relative Strength Index (RSI) to confirm market overbought and oversold conditions.
- Multiple signal confirmation: The strategy requires simultaneous satisfaction of specific conditions including WaveTrend crossover signals, RSI overbought/oversold signals, and price relationship with Fibonacci levels.
Strategy Advantages
- High signal reliability: Effectively reduces the impact of false signals through the coordination of multiple technical indicators.
- Comprehensive risk control: Implements a point-based stop-loss and take-profit mechanism to effectively control risk for each trade.
- Strong adaptability: Strategy can dynamically adjust Fibonacci levels to adapt to different market environments.
- Clear signals: Trading signals are clear, easy to understand and execute.
Strategy Risks
- Market volatility risk: Stop-loss points may become too loose in severely volatile markets.
- Signal lag: Due to the use of moving averages and other technical indicators, signals may have some lag.
- Money management risk: Fixed stop-loss and take-profit levels may not be suitable for all market environments.
Strategy Optimization Directions
- Dynamic stop-loss and take-profit: Suggest changing fixed point stop-loss and take-profit to dynamic mechanism based on ATR indicator.
- Market environment filtering: Add trend strength filter to adjust strategy parameters in different market environments.
- Signal optimization: Consider adding volume indicators to assist in confirming trading signals.
- Parameter optimization: Recommend optimizing WaveTrend and RSI parameters to adapt to different trading instruments and timeframes.
Summary
This is a well-designed quantitative trading strategy with clear logic. Through the combined use of multiple technical indicators, it can effectively capture market opportunities while controlling risks. The strategy's main advantages lie in its reliable signal system and comprehensive risk control mechanism. Through the suggested optimization directions, the strategy's stability and adaptability can be further enhanced.
Source Pine Script
/*backtest
start: 2024-12-17 00:00:00
end: 2025-01-15 08:00:00
period: 1h
basePeriod: 1h
exchanges: [{"eid":"Futures_Binance","currency":"BTC_USDT","balance":49999}]
*/

//@version=5
strategy(title="Şinasi Özel Tarama", shorttitle="Şinasi Tarama", overlay=true)

// LazyBear WaveTrend Göstergesi
n1 = input(10, "Channel Length")
n2 = input(21, "Average Length")
obLevel1 = input(60, "Over Bought Level 1")
obLevel2 = input(53, "Over Bought Level 2")
osLevel1 = input(-60, "Over Sold Level 1")
osLevel2 = input(-53, "Over Sold Level 2")

ap = hlc3
esa = ta.ema(ap, n1)
d = ta.ema(math.abs(ap - esa), n1)
ci = (ap - esa) / (0.015 * d)
tci = ta.ema(ci, n2)

wt1 = tci
wt2 = ta.sma(wt1, 4)

plot(0, color=color.gray)
plot(obLevel1, color=color.red)
plot(osLevel1, color=color.green)
plot(obLevel2, color=color.red)
plot(osLevel2, color=color.green)

plot(wt1, color=color.green)
plot(wt2, color=color.red)
plot(wt1 - wt2, color=color.blue, style=plot.style_area, transp=80)
plot(ta.crossover(wt1, wt2) ? wt2 : na, color=color.black, style=plot.style_circles, linewidth=3)
plot(ta.crossover(wt1, wt2) ? wt2 : na, color=(wt2 - wt1 > 0 ? color.red : color.lime), style=plot.style_circles, linewidth=2)
barcolor(ta.crossover(wt1, wt2) ? (wt2 - wt1 > 0 ? color.aqua : color.yellow) : na)

// Fibonacci seviyelerini çizmek için yeni en yüksek ve en düşük fiyatları her yeni mumda güncelleme
var float fibLow = na
var float fibHigh = na

// Fibonacci seviyelerini yeniden hesapla
if (na(fibLow) or na(fibHigh))
    fibLow := low
    fibHigh := high
else
    fibLow := math.min(fibLow, low)
    fibHigh := math.max(fibHigh, high)

fib38 = fibLow + 0.382 * (fibHigh - fibLow)
fib50 = fibLow + 0.5 * (fibHigh - fibLow)
fib618 = fibLow + 0.618 * (fibHigh - fibLow)

plot(fib38, color=color.orange, linewidth=1, title="Fibonacci 38.2%")
plot(fib50, color=color.purple, linewidth=1, title="Fibonacci 50%")
plot(fib618, color=color.blue, linewidth=1, title="Fibonacci 61.8%")

// RSI hesaplama
rsiPeriod = input(14, title="RSI Length")
rsiValue = ta.rsi(close, rsiPeriod)
plot(rsiValue, color=color.blue, title="RSI")

// Buy ve Sell sinyalleri

// Buy sinyali
buyCondition = rsiValue < 30 and close < fib38 and close < fib50 and close < fib618 and ta.crossover(wt1, wt2)
plotshape(buyCondition, title="Buy Signal", location=location.belowbar, color=color.green, style=shape.labelup, text="BUY")

// Sell sinyali
sellCondition = rsiValue > 70 and close > fib38 and close > fib50 and close > fib618 and ta.crossunder(wt1, wt2)
plotshape(sellCondition, title="Sell Signal", location=location.abovebar, color=color.red, style=shape.labeldown, text="SELL")

// Strateji giriş ve çıkış
// Buy (Alım) işlemi
if (buyCondition)
    strategy.entry("Buy", strategy.long)

// Sell (Satım) işlemi
if (sellCondition)
    strategy.entry("Sell", strategy.short)

// TP (Take Profit) seviyesinin 3500 pip olarak ayarlanması
// SL (Stop Loss) seviyesinin 7000 pip olarak ayarlanması

pipValue = syminfo.mintick * 10 // Pip değeri

// Buy TP (Alım TP) seviyesi
buyTPCondition = buyCondition
strategy.exit("Buy Exit", "Buy", limit=close + 300 * pipValue, stop=close - 700 * pipValue)

// Sell TP (Satım TP) seviyesi
sellTPCondition = sellCondition
strategy.exit("Sell Exit", "Sell", limit=close - 3500 * pipValue, stop=close + 7000 * pipValue)
Published by ChaoZhang on the FMZ strategy square · last modified 2025-01-17. Collected in the Quant Trading Vault. Unvalidated research: re-test with your own data and costs before trusting it.
Build this with AgenKit
A spec is not a trading system. Paste this into your coding agent and AgenKit runs a specialist team — architecture, test-first build, risk gates, review — with paper trading on by default.
/agenkit build a production-grade trading bot with a backtest engine, risk controls and paper trading by default from strategies/Dynamic-WaveTrend-and-Fibonacci-Integrated-Quantitative-Trading-Strategy.md- npx agenkit install engineering-kit in your project
- Paste the command into your agent and approve each phase
- Get tests, backtest, risk controls and a paper-trading switch
Understand it first
Before you run this, read the lesson behind the idea and how to backtest it honestly. Specs like this one are the survivors of an unknown number of trials; deflate their results accordingly.
Related specs
- Multi Period Trend Confirmation Dynamic Risk Control Quantitative Trading StrategyPine Script · Trend following · 1h
- Multi Period Trend Following and Volume Analysis Adaptive Risk StrategyPine Script · Trend following · 1d
- Bollinger Bands and RSI Trend Following StrategyPine Script · Trend following · 1h
- Dual ATR Channel Trend Following StrategyPine Script · Trend following · 15m
- Dual Mode Adaptive Trend Trading Strategy EMA Crossover with ATR Volatility Based Risk Management SystemPine Script · Trend following · 1d
- Dynamic Dual EMA Crossover Strategy with Adaptive Profit Loss ControlPine Script · Trend following · 1d