EintSimple Pullback Strategy
The EintSimple Pullback Strategy is a mean reversion strategy based on dual moving average crossover. It first uses a long-term and a short-term moving average line. When the short-term moving average line breaks…
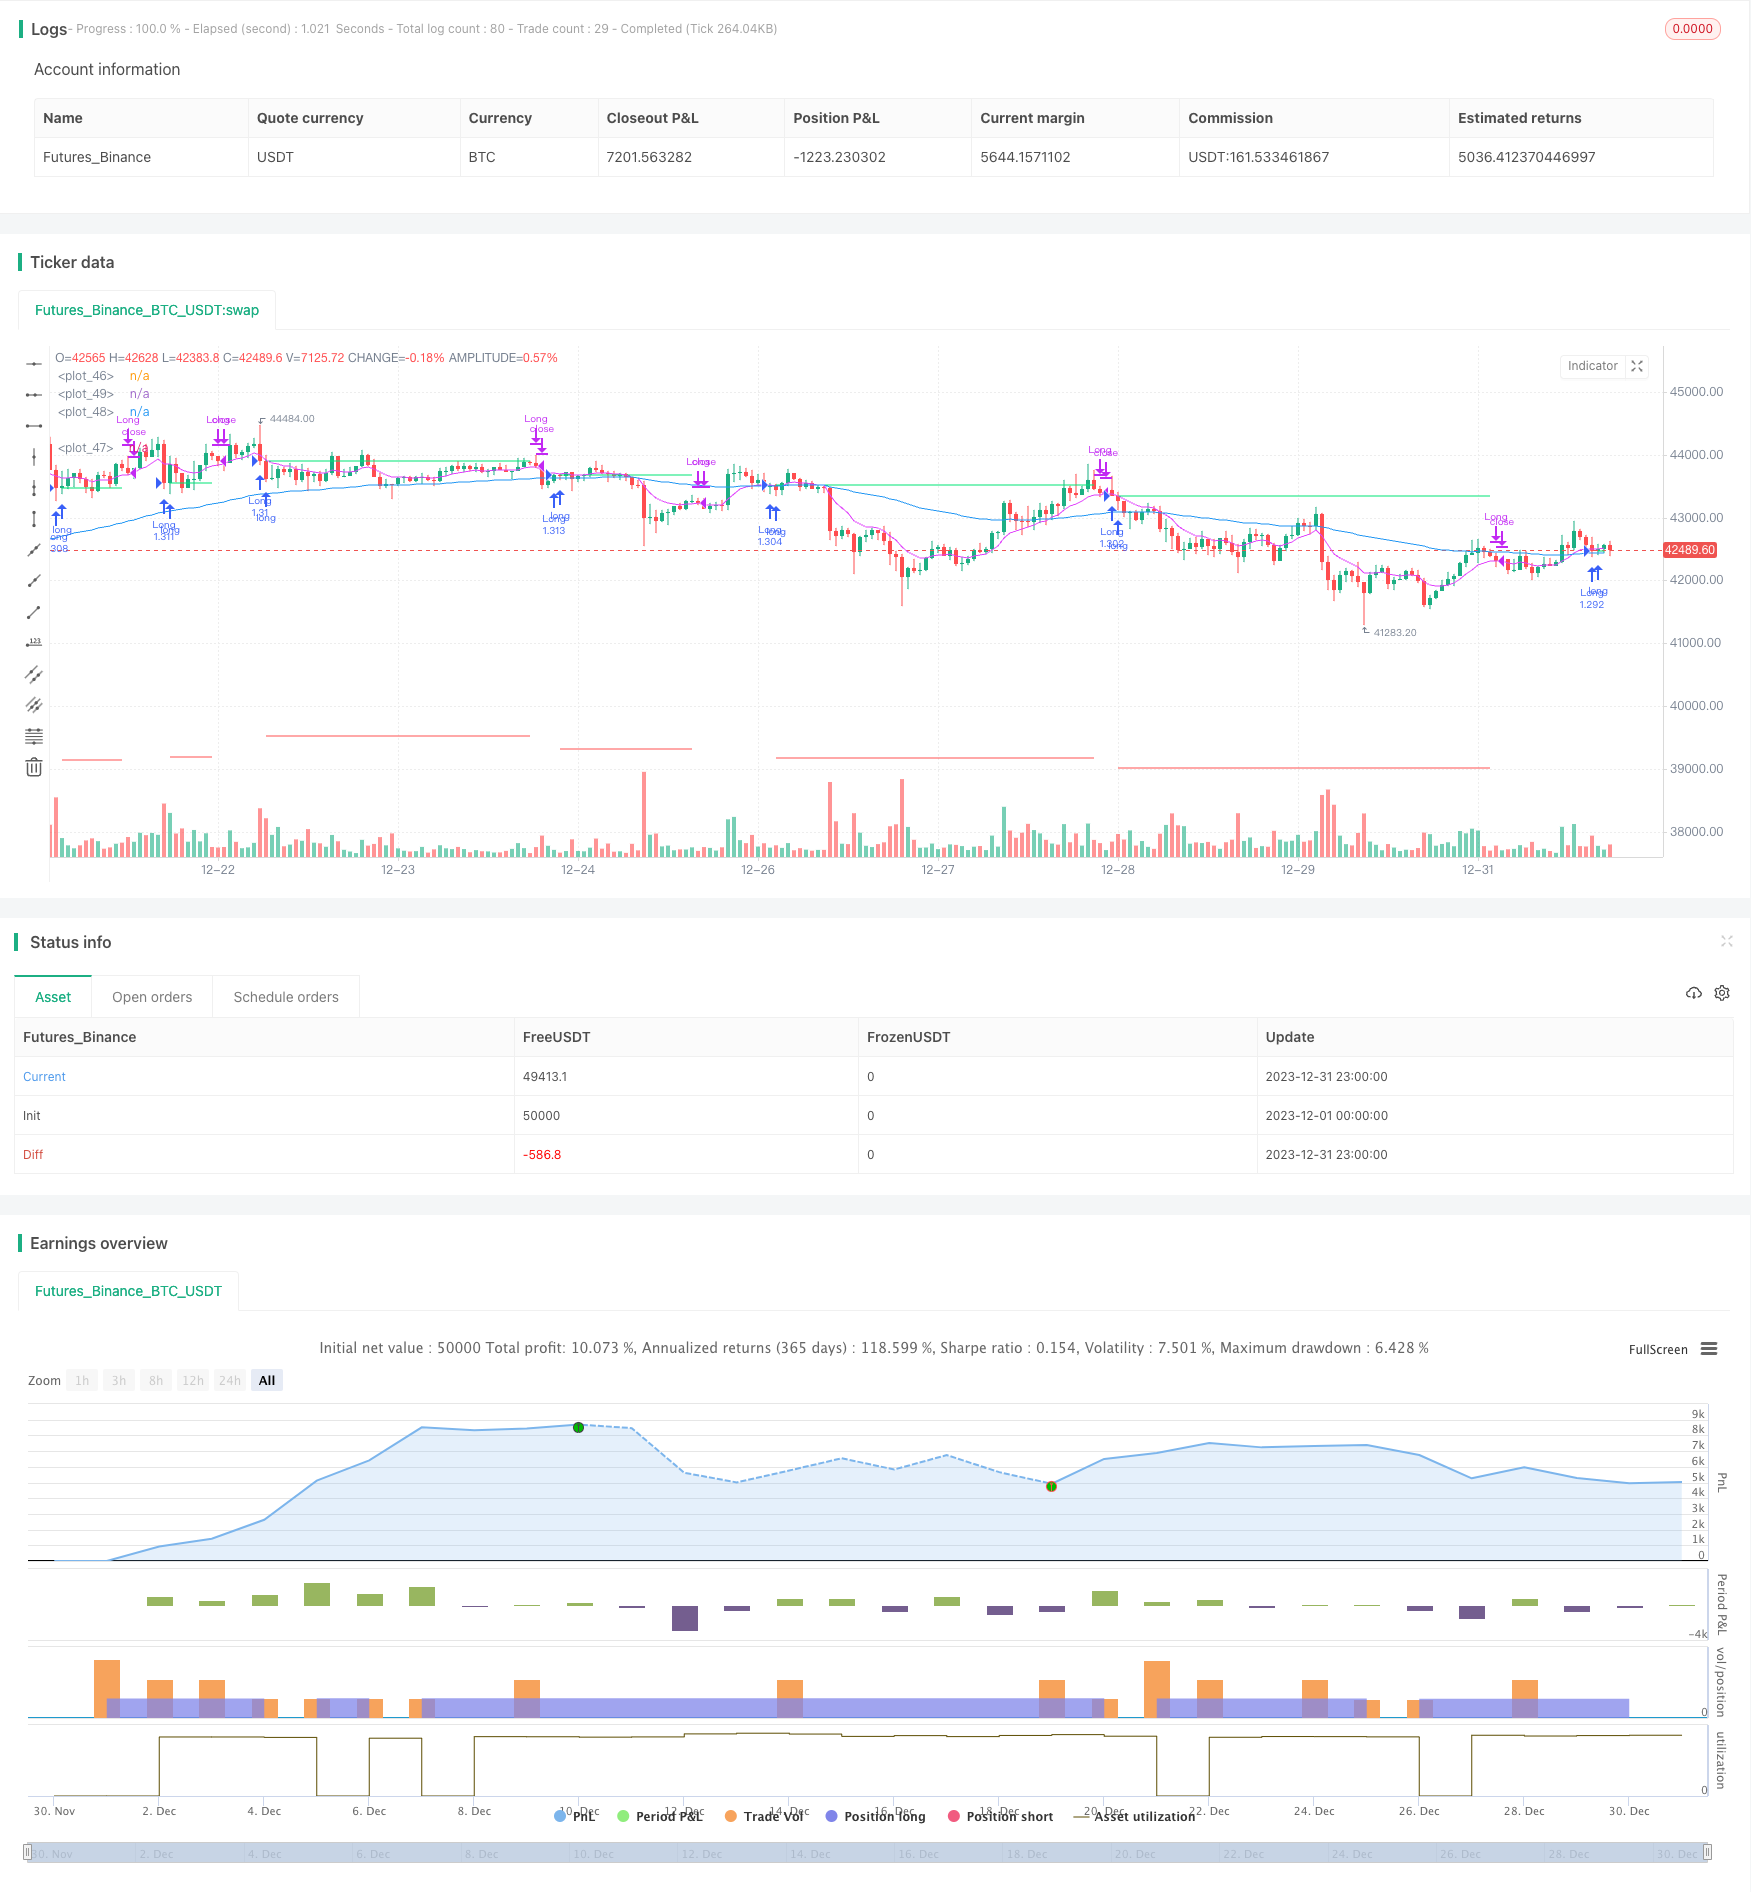
Moving Average Crossover EintSimple Pullback Strategy
Overview
The EintSimple Pullback Strategy is a mean reversion strategy based on dual moving average crossover. It first uses a long-term and a short-term moving average line. When the short-term moving average line breaks through the long-term moving average line from the bottom, a buy signal is generated. To filter false breakouts, this strategy also requires the close price to be higher than the long-term moving average line.
After entering the market, if the price falls back below the short-term moving average line again, it will trigger an exit signal. In addition, this strategy also sets a stop loss exit. If the retracement from the highest point reaches the set stop loss percentage, it will also exit positions.
Strategy Logic
The strategy mainly relies on the golden cross of dual moving averages to determine entry timing. Specifically, the following conditions must be met at the same time before opening a position to go long:
- The close price is greater than the long-term moving average ma1
- The close price is lower than the short-term moving average ma2
- There is currently no position
After meeting the above conditions, this strategy will take a full long position.
The exit signal judgment is based on two conditions. One is that the price falls back below the short-term moving average again. The other is that the retracement from the highest point reaches the set stop loss percentage. The specific exit conditions are as follows:
- The close price is greater than the short-term moving average ma2
- The retracement from the highest point reaches the set stop loss percentage
When either exit condition is met, this strategy will close all long positions.
Advantages
Using dual moving average crossover combined with solid close prices to judge can effectively filter false breakouts.
Adopting pullback entry can enter after the price forms short-term inflection points.
With stop loss setting, it can limit the maximum drawdown.
Risks
Dual moving average crossover strategies tend to produce frequent trading signals and may chase peaks and kill bottoms.
Improper parameter settings of moving averages may result in overly smooth or overly sensitive curves.
Overly loose stop loss settings will lead to enlarged losses.
Optimization
Test different length combinations of long-term and short-term moving averages to find the optimal parameters.
Compare the effects of using close price and typical price to determine moving average crossovers.
Test adding filters like volume or volatility indicators.
Backtest optimize the stop loss percentage to find the best setting.
Conclusion
The EintSimple Pullback Strategy is a simple and practical dual moving average pullback strategy. It effectively utilizes the directional functionality of moving averages while combining solid close prices to filter out false signals. Although this strategy is prone to frequent trading and chasing peaks and killing bottoms, it can be further improved through parameter optimization and adding filters. Overall, this is a great strategy for quantitative trading beginners to practice on and optimize.
Parameters
| Name | Default | What it controls |
|---|---|---|
| v_input_int_1 | 75 | (?Strategy Parameters)MA 1 Length |
| v_input_int_2 | 9 | MA 2 Length |
| v_input_float_1 | 0.1 | Stop Loss Percent |
| v_input_bool_1 | true | Exit On Lower Close |
| v_input_1 | timestamp(01 Jan 1995 13:30 +0000) | (?Time Filter)Start Filter |
| v_input_2 | timestamp(1 Jan 2099 19:30 +0000) | End Filter |
Source Pine Script
/*backtest
start: 2023-12-01 00:00:00
end: 2023-12-31 23:59:59
period: 1h
basePeriod: 15m
exchanges: [{"eid":"Futures_Binance","currency":"BTC_USDT"}]
*/

// This source code is subject to the terms of the Mozilla Public License 2.0 at https://mozilla.org/MPL/2.0/
// © ZenAndTheArtOfTrading / www.PineScriptMastery.com
// @version=5
strategy("Simple Pullback Strategy",
     overlay=true,
     initial_capital=50000,
     default_qty_type=strategy.percent_of_equity,
     default_qty_value=100)// 100% of balance invested on each trade

// Get user input
i_ma1           = input.int(title="MA 1 Length", defval=75, step=1, group="Strategy Parameters", tooltip="Long-term EMA")
i_ma2           = input.int(title="MA 2 Length", defval=9, step=1, group="Strategy Parameters", tooltip="Short-term EMA")
i_stopPercent   = input.float(title="Stop Loss Percent", defval=0.10, step=0.1, group="Strategy Parameters", tooltip="Failsafe Stop Loss Percent Decline")
i_lowerClose    = input.bool(title="Exit On Lower Close", defval=true, group="Strategy Parameters", tooltip="Wait for a lower-close before exiting above MA2")
i_startTime     = input(title="Start Filter", defval=timestamp("01 Jan 1995 13:30 +0000"), group="Time Filter", tooltip="Start date & time to begin searching for setups")
i_endTime       = input(title="End Filter", defval=timestamp("1 Jan 2099 19:30 +0000"), group="Time Filter", tooltip="End date & time to stop searching for setups")

// Get indicator values
ma1 = ta.ema(close, i_ma1)
ma2 = ta.ema(close, i_ma2)

// Check filter(s)
f_dateFilter = true

// Check buy/sell conditions
var float buyPrice = 0
buyCondition    = close > ma1 and close < ma2 and strategy.position_size == 0 and f_dateFilter
sellCondition   = close > ma2 and strategy.position_size > 0 and (not i_lowerClose or close < low[1])
stopDistance    = strategy.position_size > 0 ? ((buyPrice - close) / close) : na
stopPrice       = strategy.position_size > 0 ? buyPrice - (buyPrice * i_stopPercent) : na
stopCondition   = strategy.position_size > 0 and stopDistance > i_stopPercent

// Enter positions
if buyCondition
    strategy.entry(id="Long", direction=strategy.long)

if buyCondition[1]
    buyPrice := open

// Exit positions
if sellCondition or stopCondition
    strategy.close(id="Long", comment="Exit" + (stopCondition ? "SL=true" : ""))
    buyPrice := na

// Draw pretty colors
plot(buyPrice, color=color.lime, style=plot.style_linebr)
plot(stopPrice, color=color.red, style=plot.style_linebr, offset=-1)
plot(ma1, color=color.blue)
plot(ma2, color=color.fuchsia)
Published by ChaoZhang on the FMZ strategy square · last modified 2024-01-15. Collected in the Quant Trading Vault. Unvalidated research: re-test with your own data and costs before trusting it.
Build this with AgenKit
A spec is not a trading system. Paste this into your coding agent and AgenKit runs a specialist team — architecture, test-first build, risk gates, review — with paper trading on by default.
/agenkit build a production-grade trading bot with a backtest engine, risk controls and paper trading by default from strategies/EintSimple-Pullback-Strategy.md- npx agenkit install engineering-kit in your project
- Paste the command into your agent and approve each phase
- Get tests, backtest, risk controls and a paper-trading switch
Understand it first
Before you run this, read the lesson behind the idea and how to backtest it honestly. Specs like this one are the survivors of an unknown number of trials; deflate their results accordingly.
Related specs
- Adaptive Multi Period Trading Strategy Based on Wave Trend Momentum BreakoutPine Script · Breakout · 2h
- BB Breakout StrategyPine Script · Breakout · 1d
- BMSB Breakout Strategy BMSBPine Script · Breakout · 1h
- Bollinger Band T3 Moving Average StrategyPine Script · Breakout · 10m
- Bollinger Bands Dual track Breakthrough StrategyPine Script · Breakout · 30m
- Bollinger Breakout StrategyPine Script · Breakout · 30m