Strategy vault / Trend following
EMA Dynamic Trend Following Trading Strategy
This strategy uses technical indicators such as Exponential Moving Average (EMA), highest price, lowest price, and Average True Range (ATR) to identify the current trend direction by analyzing the relationship…
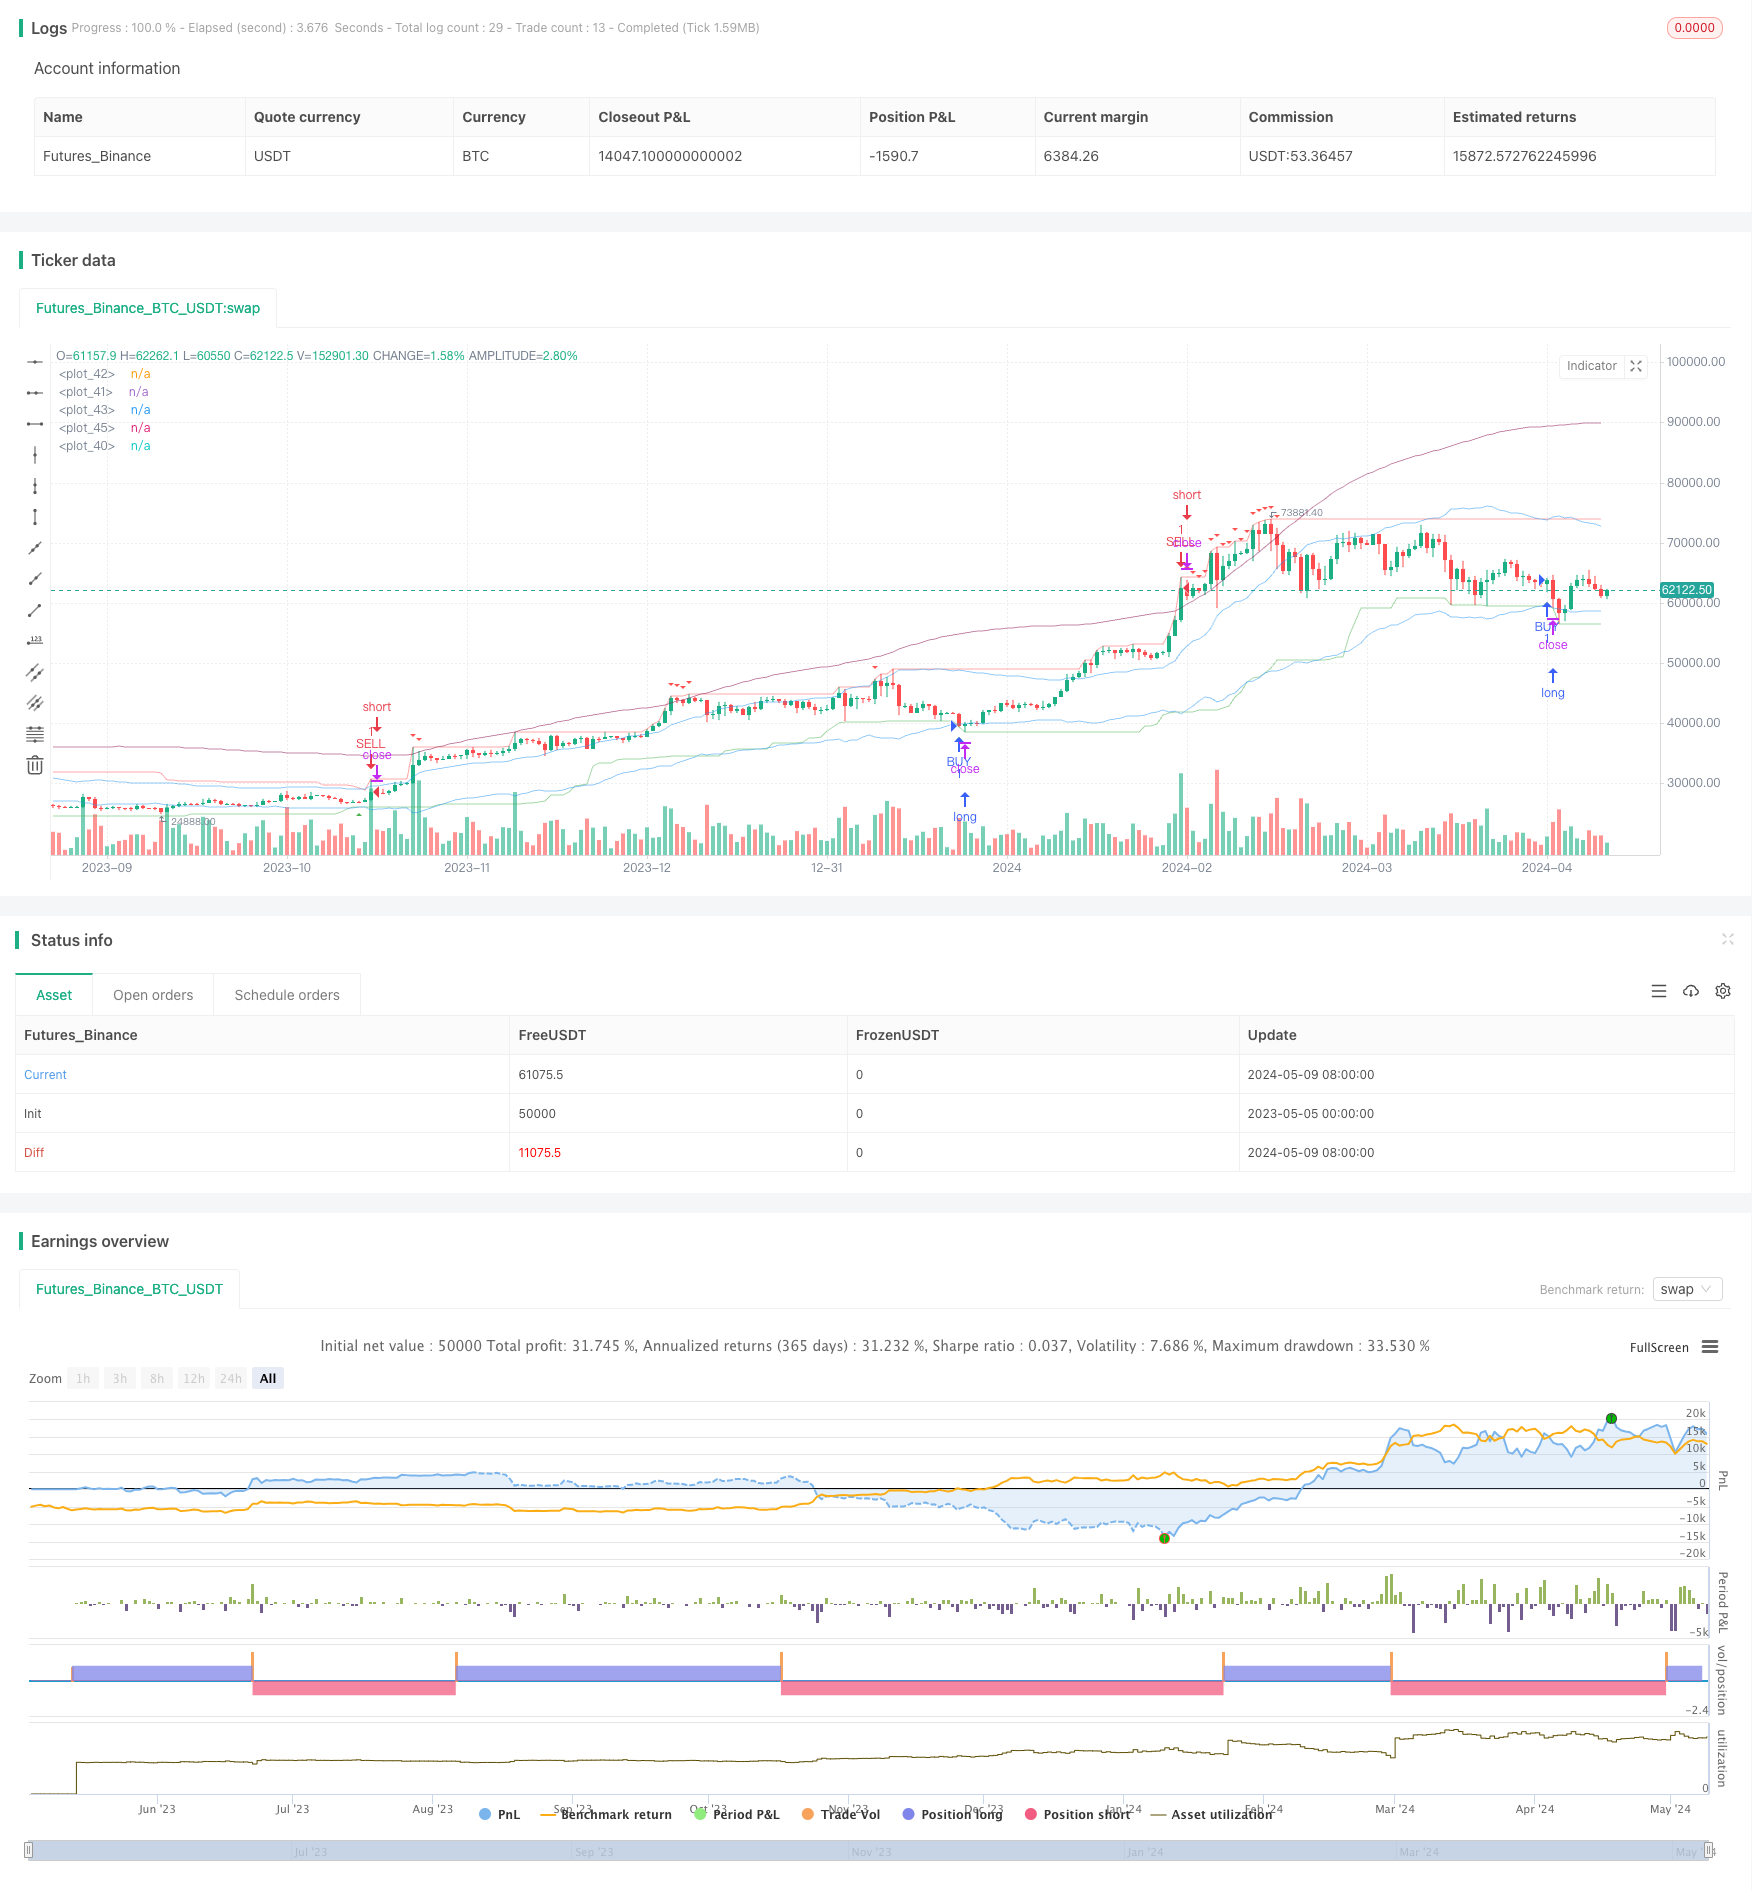
####Overview This strategy uses technical indicators such as Exponential Moving Average (EMA), highest price, lowest price, and Average True Range (ATR) to identify the current trend direction by analyzing the relationship between price and EMA, highest price, and lowest price. It generates a buy signal when the price breaks above the lowest price and a sell signal when the price breaks below the highest price or reaches the dynamic resistance level, aiming to capture trend movements and achieve excess returns.
####Strategy Principle
- Calculate ATR to measure market volatility and provide a basis for constructing dynamic channels.
- Calculate the highest and lowest prices as the foundation for determining trend direction.
- Calculate EMA_HL, which is the EMA of the highest and lowest prices, as the centerline of the dynamic channel.
- Calculate EMA_HIGHEST and EMA_LOWEST by adding and subtracting a certain multiple of ATR from EMA_HL to obtain the upper and lower bands.
- Calculate SELL_LINE by adding a certain multiple of ATR to the highest price to create a dynamic resistance level.
- Generate a buy signal when EMA_LOWEST breaks above the lowest price and the closing price is below EMA_MID.
- Generate a sell signal when EMA_HIGHEST breaks below the highest price and the closing price is above EMA_MID, or when the highest price reaches SELL_LINE.
####Strategy Advantages
- Utilizes EMA, highest price, lowest price, and other indicators to comprehensively judge the trend, resulting in reliable signals.
- Incorporates ATR as a measure of volatility to construct dynamic channels, adapting to different market conditions.
- Sets SELL_LINE as a dynamic resistance level to timely lock in profits and control drawdown risk.
- Parameters are adjustable, making the strategy suitable for different instruments and timeframes, with certain universality and flexibility.
####Strategy Risks
- Trend identification may lag, leading to suboptimal entry timing.
- Improper parameter settings may result in frequent signals and increased trading costs.
- The strategy may not perform well in rangebound markets and requires additional methods for judgment.
- In extreme market conditions, such as rapid trend reversals, the strategy may fail, requiring stop-loss settings.
####Strategy Optimization Directions
- Introduce more indicators, such as trading volume and volatility, to enrich trend judgment dimensions and improve signal reliability.
- Optimize parameters, such as ATR multiples and EMA periods, to find the optimal parameter combination and enhance strategy stability.
- Incorporate position management, such as dynamically adjusting positions based on ATR, to control single-trade risk exposure.
- Set stop-loss and take-profit levels to control maximum loss and maximum profit per trade, improving the risk-reward ratio.
- Combine with other strategies, such as breakout strategies and mean reversion strategies, to form a strategy portfolio and improve overall robustness.
####Summary This strategy utilizes technical indicators like EMA, highest price, and lowest price, combined with ATR to construct dynamic channels. It generates trading signals by breaking above the lowest price and breaking below the highest price to capture trend movements. It is a simple and practical trend-following strategy with adjustable parameters, offering good adaptability and flexibility. However, its performance may be suboptimal in rangebound markets, requiring further optimization and improvement through introducing more indicators, optimizing parameters, and adding risk controls.
Source Pine Script
/*backtest
start: 2023-05-05 00:00:00
end: 2024-05-10 00:00:00
period: 1d
basePeriod: 1h
exchanges: [{"eid":"Futures_Binance","currency":"BTC_USDT"}]
*/

// This Pine Script™ code is subject to the terms of the Mozilla Public License 2.0 at https://mozilla.org/MPL/2.0/
// © Maboi_q

//@version=5
strategy("buy sell Trend", overlay=true)

atr_length = input.int(defval=14, title='atr length')
highest_length = input.int(defval=60, title='highest length')
highest_s_length = input.int(defval=60, title='sell highest length')
lowest_length = input.int(defval=30, title='lowest length')
sell_l_length = input.int(defval=55, title='sell line length')

f = 2.382
f2 = 5.618

atr = ta.atr(atr_length)
highest = ta.highest(highest_length)
lowest = ta.lowest(lowest_length)

f_atr = atr * f
ema_hl = ta.ema((highest[1] + lowest[1]) / 2, 14)
ema_highest = ema_hl + f_atr
ema_lowest = ema_hl - f_atr
ema_mid = (ema_highest + ema_lowest) / 2

bs_hi = ta.highest(highest_s_length)
f_atr2 = atr * f2
sell_line = ta.ema(bs_hi[1] + f_atr2, sell_l_length)

buy_cond = ta.crossover(ema_lowest, lowest) and close < ema_mid
sell_cond = (ta.crossunder(ema_highest, highest) and close > ema_mid) or high >= sell_line

if buy_cond
    strategy.entry('BUY', strategy.long)

if sell_cond
    strategy.entry('SELL', strategy.short)


plot(sell_line, color=color.new(color.maroon, 50))
plot(highest, color=color.new(color.red, 50))
plot(lowest, color=color.new(color.green, 50))
plot(ema_highest, color=color.new(color.blue, 50))
// plot(ema_mid, color=color.new(color.gray, 50))
plot(ema_lowest, color=color.new(color.blue, 50))

plotshape(buy_cond, title='buy', style=shape.triangleup, location=location.belowbar,
 color=color.green, textcolor=color.green, size=size.tiny)

plotshape(sell_cond, title='sell', style=shape.triangledown, location=location.abovebar,
 color=color.red, textcolor=color.red, size=size.tiny)
Published by ChaoZhang on the FMZ strategy square · last modified 2024-05-11. Collected in the Quant Trading Vault. Unvalidated research: re-test with your own data and costs before trusting it.
Build this with AgenKit
A spec is not a trading system. Paste this into your coding agent and AgenKit runs a specialist team — architecture, test-first build, risk gates, review — with paper trading on by default.
/agenkit build a production-grade trading bot with a backtest engine, risk controls and paper trading by default from strategies/EMA-Dynamic-Trend-Following-Trading-Strategy.md- npx agenkit install engineering-kit in your project
- Paste the command into your agent and approve each phase
- Get tests, backtest, risk controls and a paper-trading switch
Understand it first
Before you run this, read the lesson behind the idea and how to backtest it honestly. Specs like this one are the survivors of an unknown number of trials; deflate their results accordingly.
Related specs
- ATR Dynamic Trend Following and EMA Crossover Trading StrategyPine Script · Trend following · 1d
- ATR and Moving Average Crossover Hybrid StrategyPine Script · Trend following · 1h
- ATR and T3 Moving Average StrategyPine Script · Trend following · 5m
- Adaptive ATR and RSI Trend Following Strategy with Trailing Stop LossPine Script · Trend following · 1h
- Bollinger Bands and RSI Trend Following StrategyPine Script · Trend following · 1h
- Dual ATR Channel Trend Following StrategyPine Script · Trend following · 15m