Strategy vault / Trend following
EMA RSI Volume Price Trend Engulfing Pattern
This strategy is a comprehensive trading system that combines multiple technical analysis tools. It utilizes Exponential Moving Average (EMA) crossovers, Stochastic Relative Strength Index (RSI), volume-price…
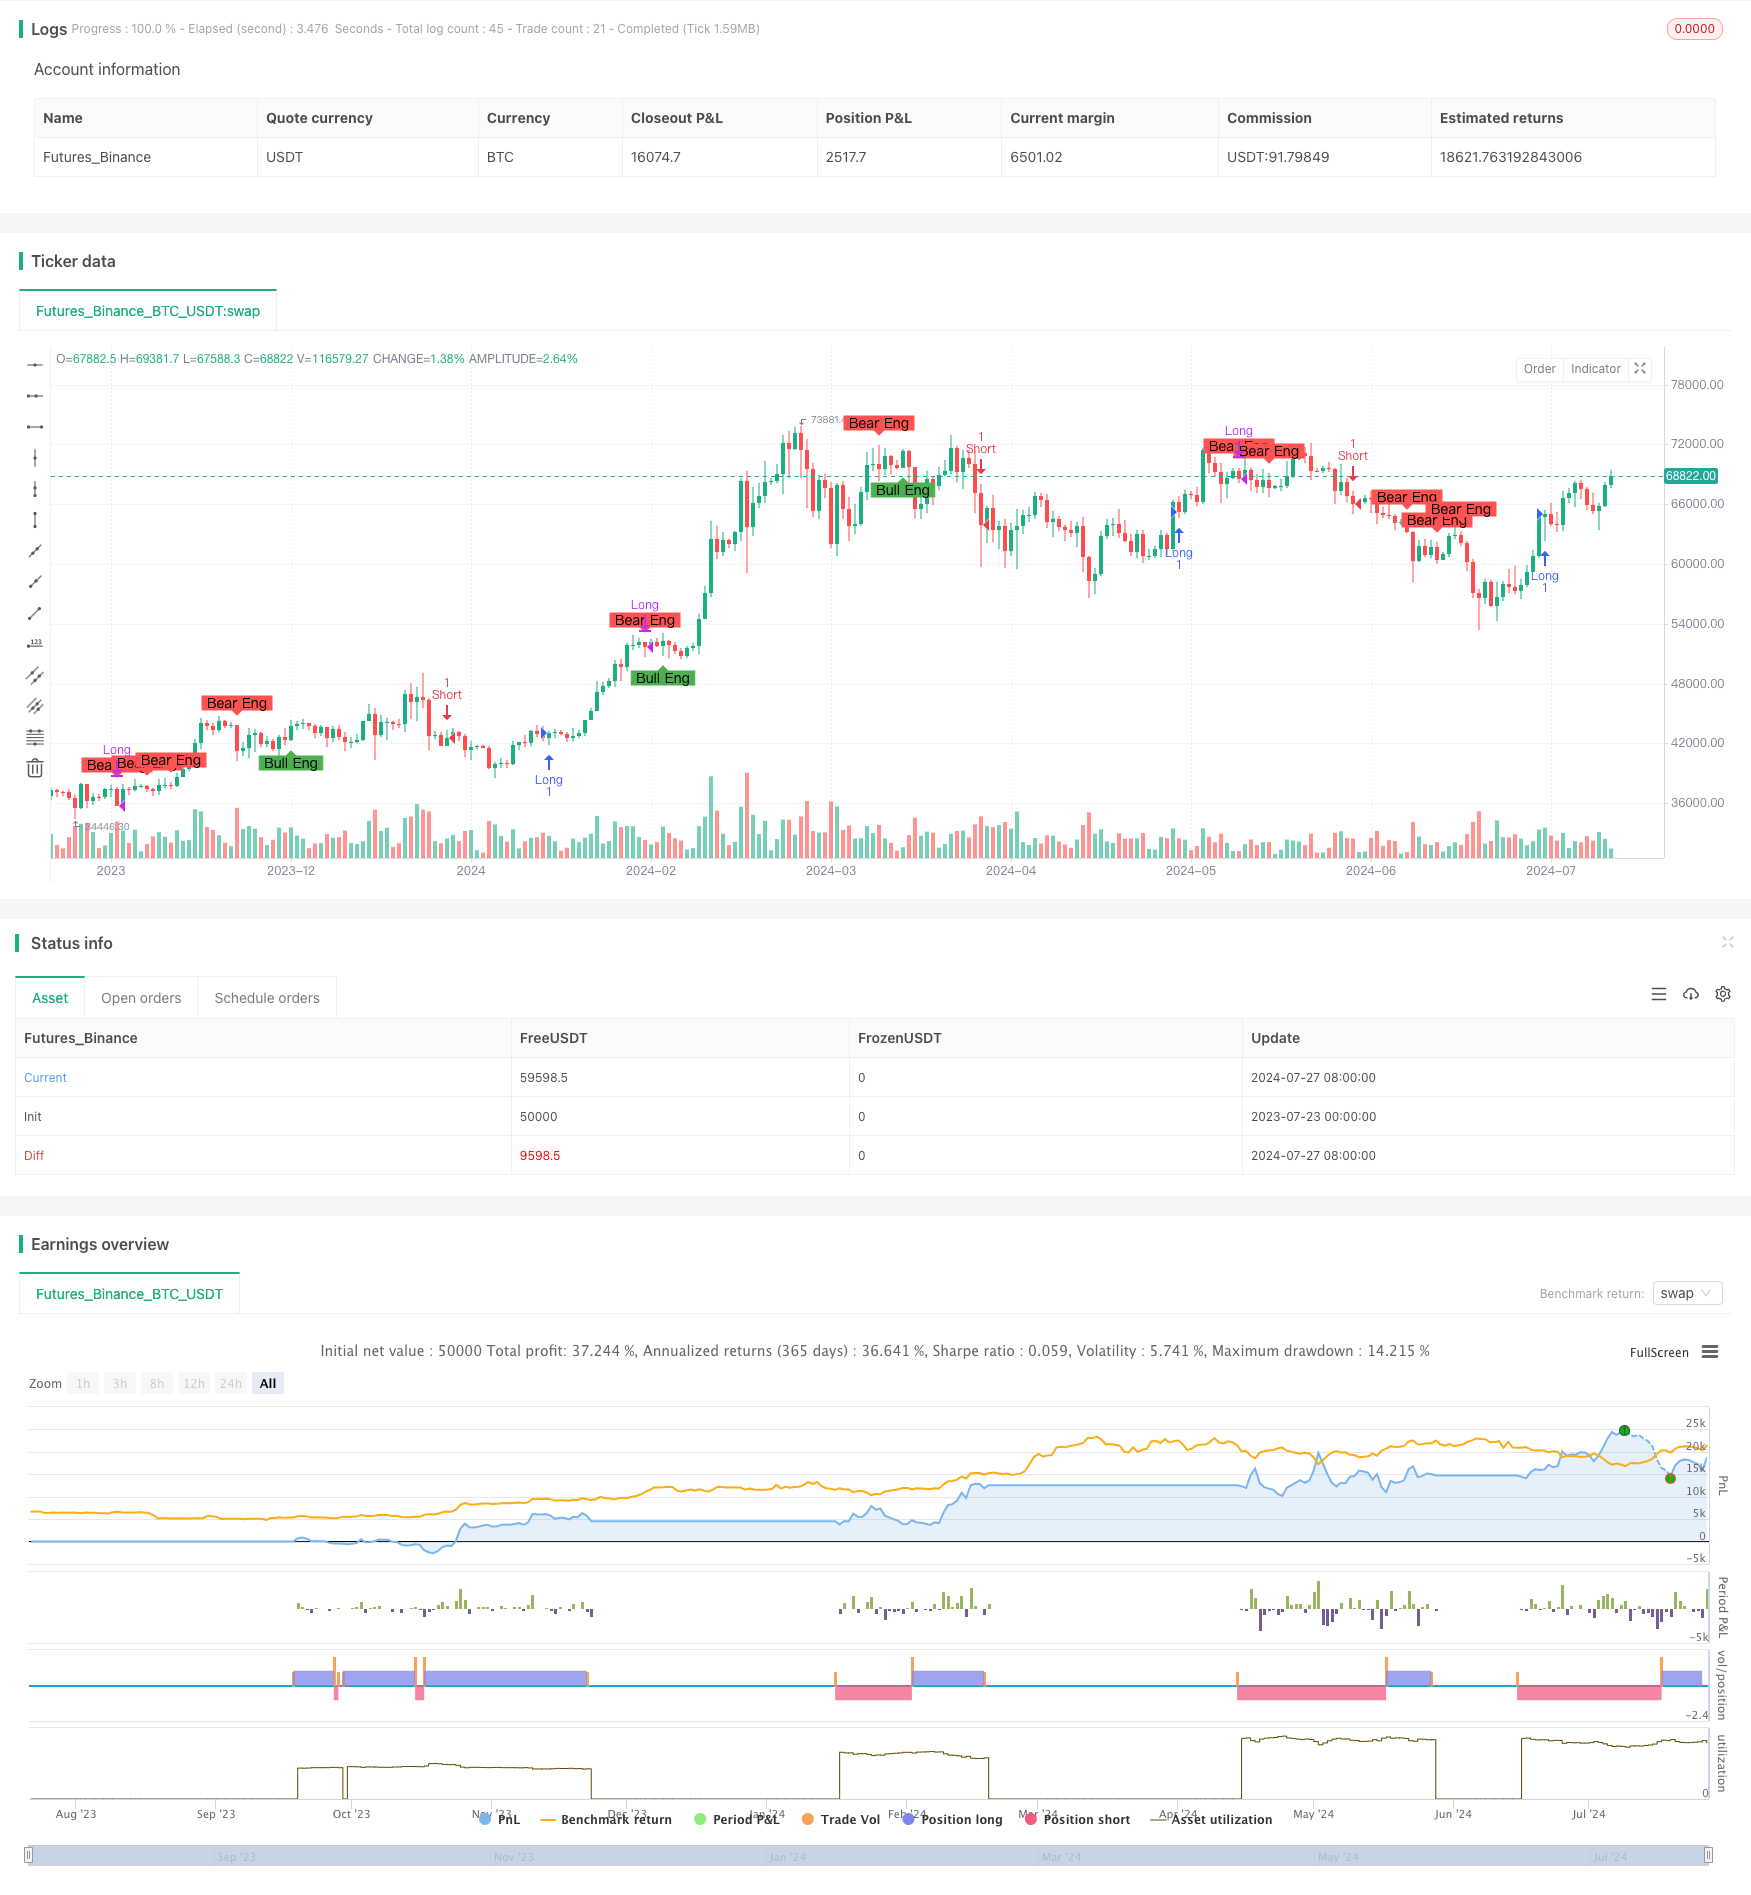
Overview
This strategy is a comprehensive trading system that combines multiple technical analysis tools. It utilizes Exponential Moving Average (EMA) crossovers, Stochastic Relative Strength Index (RSI), volume-price relationships, and candlestick patterns to generate trading signals. The core of this strategy lies in analyzing market dynamics from multiple dimensions to improve the accuracy and reliability of trading decisions.
The main components of the strategy include:
- A crossover system based on 8-period and 20-period EMAs
- A trend indicator calculated using the relationship between volume and price
- Stochastic RSI for confirming trend reversals
- Bullish and bearish divergence detection mechanism
- Engulfing pattern recognition system
By integrating these elements, the strategy aims to capture market trend turning points while managing risk through stop-loss and profit-taking mechanisms.
Strategy Principles
EMA Crossover System:
- Buy signal generated when 8-period EMA crosses above 20-period EMA
- Sell signal generated when 8-period EMA crosses below 20-period EMA
Volume-Price Trend Calculation:
- Measures market sentiment through the ratio of volume to closing price
- Used for detecting potential bullish and bearish divergences
Stochastic RSI:
- Calculates 14-period stochastic RSI to confirm potential trend reversal points
Bullish and Bearish Divergence Detection:
- Compares recent lows/highs with the volume-price trend
- Bullish divergence identified when price makes new lows but volume-price trend rises
- Bearish divergence identified when price makes new highs but volume-price trend declines
Engulfing Pattern Recognition:
- Identifies bullish and bearish engulfing patterns
- Used for setting stop-loss and take-profit points
Trading Logic:
- Buy on bullish divergence or EMA golden cross
- Sell on bearish divergence or EMA death cross
- Set stop-loss on first occurrence of reverse engulfing pattern
- Close position for profit on second occurrence of reverse engulfing pattern
Strategy Advantages
Multi-dimensional Analysis: Combines technical indicators, volume analysis, and candlestick patterns for a more comprehensive market perspective.
Trend Following and Reversal Warning: EMA crossover system helps capture major trends, while divergence detection and engulfing patterns warn of potential reversals.
Risk Management: Uses engulfing patterns to set dynamic stop-loss and profit points, helping to control risk and lock in profits.
Flexibility: Strategy can adapt to different market conditions, profiting from both trending and oscillating markets.
Automation: Strategy can be programmed, reducing human emotional interference and improving execution efficiency.
Objectivity: Based on clear technical indicators and chart patterns, reducing bias from subjective judgments.
Strategy Risks
Overtrading: Frequent EMA crossovers in oscillating markets may lead to excessive trading, increasing transaction costs.
Lag: EMA and RSI are inherently lagging indicators, potentially missing important turning points in rapidly changing markets.
False Breakouts: Short-term false breakouts may occur during consolidation phases, leading to incorrect signals.
Parameter Sensitivity: Strategy effectiveness highly depends on EMA periods, RSI parameters, etc., which may require different optimizations for different markets.
Market Environment Dependency: May perform better in strong trend markets than in oscillating markets, requiring consideration of market cycles.
Signal Conflicts: Different indicators may produce contradictory signals, necessitating clear priority rules.
Strategy Optimization Directions
Dynamic Parameter Adjustment:
- Automatically adjust EMA periods and RSI parameters based on market volatility
- Implementation: Use ATR (Average True Range) indicator to measure volatility and adjust parameters accordingly
Incorporate Market Sentiment Indicators:
- Introduce sentiment indicators like VIX or PUT/CALL ratio
- Purpose: Filter potential false signals during extreme market sentiment
Optimize Stop-Loss Mechanism:
- Consider using trailing stops, such as ATR multiple stops
- Advantage: Better adapts to market volatility, protects profits
Introduce Multi-Timeframe Analysis:
- Verify signals across multiple timeframes
- Benefit: Reduces false signals, improves trade reliability
Integrate Fundamental Data:
- Consider adding economic calendar events, quarterly reports, and other fundamental factors
- Purpose: Adjust strategy sensitivity before and after important events, avoiding unnecessary risks
Machine Learning Optimization:
- Use machine learning algorithms to optimize parameter selection and signal generation
- Potential: Can adapt to market changes, improving strategy stability and profitability
Conclusion
This "EMA Crossover, RSI, Volume-Price Trend, and Engulfing Pattern Strategy" is a comprehensive and complex trading system that combines multiple technical analysis tools and risk management techniques. By integrating EMA crossovers, Stochastic RSI, volume-price relationship analysis, and candlestick pattern recognition, this strategy aims to provide a holistic market analysis framework.
The main advantages of the strategy lie in its multi-dimensional analysis capability and flexible risk management mechanism. By combining trend-following and reversal warning systems, it can seek trading opportunities in different market environments. Meanwhile, the dynamic stop-loss and profit-taking mechanism based on engulfing patterns provides a systematic approach to money management.
However, the strategy also faces potential risks such as overtrading, parameter sensitivity, and market environment dependency. To address these challenges, we have proposed several optimization directions, including dynamic parameter adjustment, incorporating market sentiment indicators, optimizing the stop-loss mechanism, multi-timeframe analysis, integrating fundamental data, and applying machine learning techniques.
Overall, this is a complex and comprehensive trading strategy with strong adaptability and potential. Through continuous optimization and backtesting, it has the potential to become a powerful trading tool. However, users need to fully understand the principles and limitations of the strategy and apply it cautiously in actual trading.
Source Pine Script
/*backtest
start: 2023-07-23 00:00:00
end: 2024-07-28 00:00:00
period: 1d
basePeriod: 1h
exchanges: [{"eid":"Futures_Binance","currency":"BTC_USDT"}]
*/

//@version=5
strategy("Combined Strategy with Custom Signals and Reversal Patterns", overlay=true)

// Extract data
dataClose = close
dataVolume = volume
dataHigh = high
dataLow = low

// Calculate Volume-Price Relation
volume_price_trend = dataVolume / dataClose

// Calculate Stochastic RSI
stoch_rsi = ta.stoch(dataClose, dataClose, dataClose, 14)

// Calculate EMA
ema_12 = ta.ema(dataClose, 8)
ema_26 = ta.ema(dataClose, 20)

// Bullish Divergence
bullish_divergence = ((ta.lowest(dataLow, 6) < ta.lowest(dataLow, 7)) and (volume_price_trend > ta.lowest(volume_price_trend, 6)))

// Bearish Divergence
bearish_divergence = ((ta.highest(dataHigh, 6) > ta.highest(dataHigh, 7)) and (volume_price_trend < ta.highest(volume_price_trend, 6)))

// Check for buy signals
buy_signal = (bullish_divergence or ((ema_12 > ema_26) and (ema_12[1] <= ema_26[1]))) // Previous crossover point

// Check for sell signals
sell_signal = (bearish_divergence or ((ema_12 < ema_26) and (ema_12[1] >= ema_26[1]))) // Previous crossover point

// Plot custom signals
plotshape(buy_signal, style=shape.triangleup, location=location.belowbar, color=color.green, size=size.small, title="Buy Signal")
plotshape(sell_signal, style=shape.triangledown, location=location.abovebar, color=color.red, size=size.small, title="Sell Signal")

// Optional: Add alerts for buy and sell signals
alertcondition(buy_signal, title="Buy Signal Alert", message="Buy signal detected!")
alertcondition(sell_signal, title="Sell Signal Alert", message="Sell signal detected!")

// Define patterns for Reversal Candlestick Patterns
isBullishEngulfing() =>
    bullishEngulfing = close > open and close[1] < open[1] and close > open[1] and open < close[1]
    bullishEngulfing

isBearishEngulfing() =>
    bearishEngulfing = close < open and close[1] > open[1] and close < open[1] and open > close[1]
    bearishEngulfing

// Calculate patterns
bullishEngulfing = isBullishEngulfing()
bearishEngulfing = isBearishEngulfing()

// Plot reversal signals
plotshape(bullishEngulfing, title="Bullish Engulfing", location=location.belowbar, color=color.green, style=shape.labelup, text="Bull Eng")
plotshape(bearishEngulfing, title="Bearish Engulfing", location=location.abovebar, color=color.red, style=shape.labeldown, text="Bear Eng")

// Variables to count occurrences of engulfing patterns
var int bullishEngulfingCount = 0
var int bearishEngulfingCount = 0

// Strategy logic for combined signals and patterns
if (buy_signal)
    strategy.entry("Long", strategy.long)
if (sell_signal)
    strategy.entry("Short", strategy.short)

// Logic to increment the engulfing pattern counts
if (bullishEngulfing)
    bullishEngulfingCount += 1
else if (not bullishEngulfing)
    bullishEngulfingCount := 0

if (bearishEngulfing)
    bearishEngulfingCount += 1
else if (not bearishEngulfing)
    bearishEngulfingCount := 0

// Exit conditions based on engulfing patterns
if (bearishEngulfing and strategy.position_size > 0)
    strategy.close("Long")
if (bullishEngulfing and strategy.position_size < 0)
    strategy.close("Short")

// Exit conditions for the second occurrence of engulfing patterns for taking profit
if (bullishEngulfingCount == 2 and strategy.position_size < 0)
    strategy.close("Short")
if (bearishEngulfingCount == 2 and strategy.position_size > 0)
    strategy.close("Long")
Published by ChaoZhang on the FMZ strategy square · last modified 2024-07-29. Collected in the Quant Trading Vault. Unvalidated research: re-test with your own data and costs before trusting it.
Build this with AgenKit
A spec is not a trading system. Paste this into your coding agent and AgenKit runs a specialist team — architecture, test-first build, risk gates, review — with paper trading on by default.
/agenkit build a production-grade trading bot with a backtest engine, risk controls and paper trading by default from strategies/EMA-RSI-Volume-Price-Trend-Engulfing-Pattern.md- npx agenkit install engineering-kit in your project
- Paste the command into your agent and approve each phase
- Get tests, backtest, risk controls and a paper-trading switch
Understand it first
Before you run this, read the lesson behind the idea and how to backtest it honestly. Specs like this one are the survivors of an unknown number of trials; deflate their results accordingly.
Related specs
- EMA AROON ASHPine Script · Trend following · 3m
- EMA SMA Multi Indicator Comprehensive Trend Following StrategyPine Script · Trend following · 1h
- EMA200 and Stochastic RSI StrategyPine Script · Trend following · 1h
- Multi Indicator Trend Divergence Quantitative Trading StrategyPine Script · Trend following · 1d
- Multifactor Driven Trend Trading StrategyPine Script · Trend following · 1m
- Trading Strategy Following Dual Timeframe TrendsPine Script · Trend following · 1h