Strategy vault / Trend following
EMA SMA Crossover Bull Market Support Band Strategy
This strategy is a crossover strategy based on two moving averages, EMA and SMA. When the slower EMA crosses above the faster SMA, it generates a buy signal; when the slower EMA crosses below the faster SMA, it…
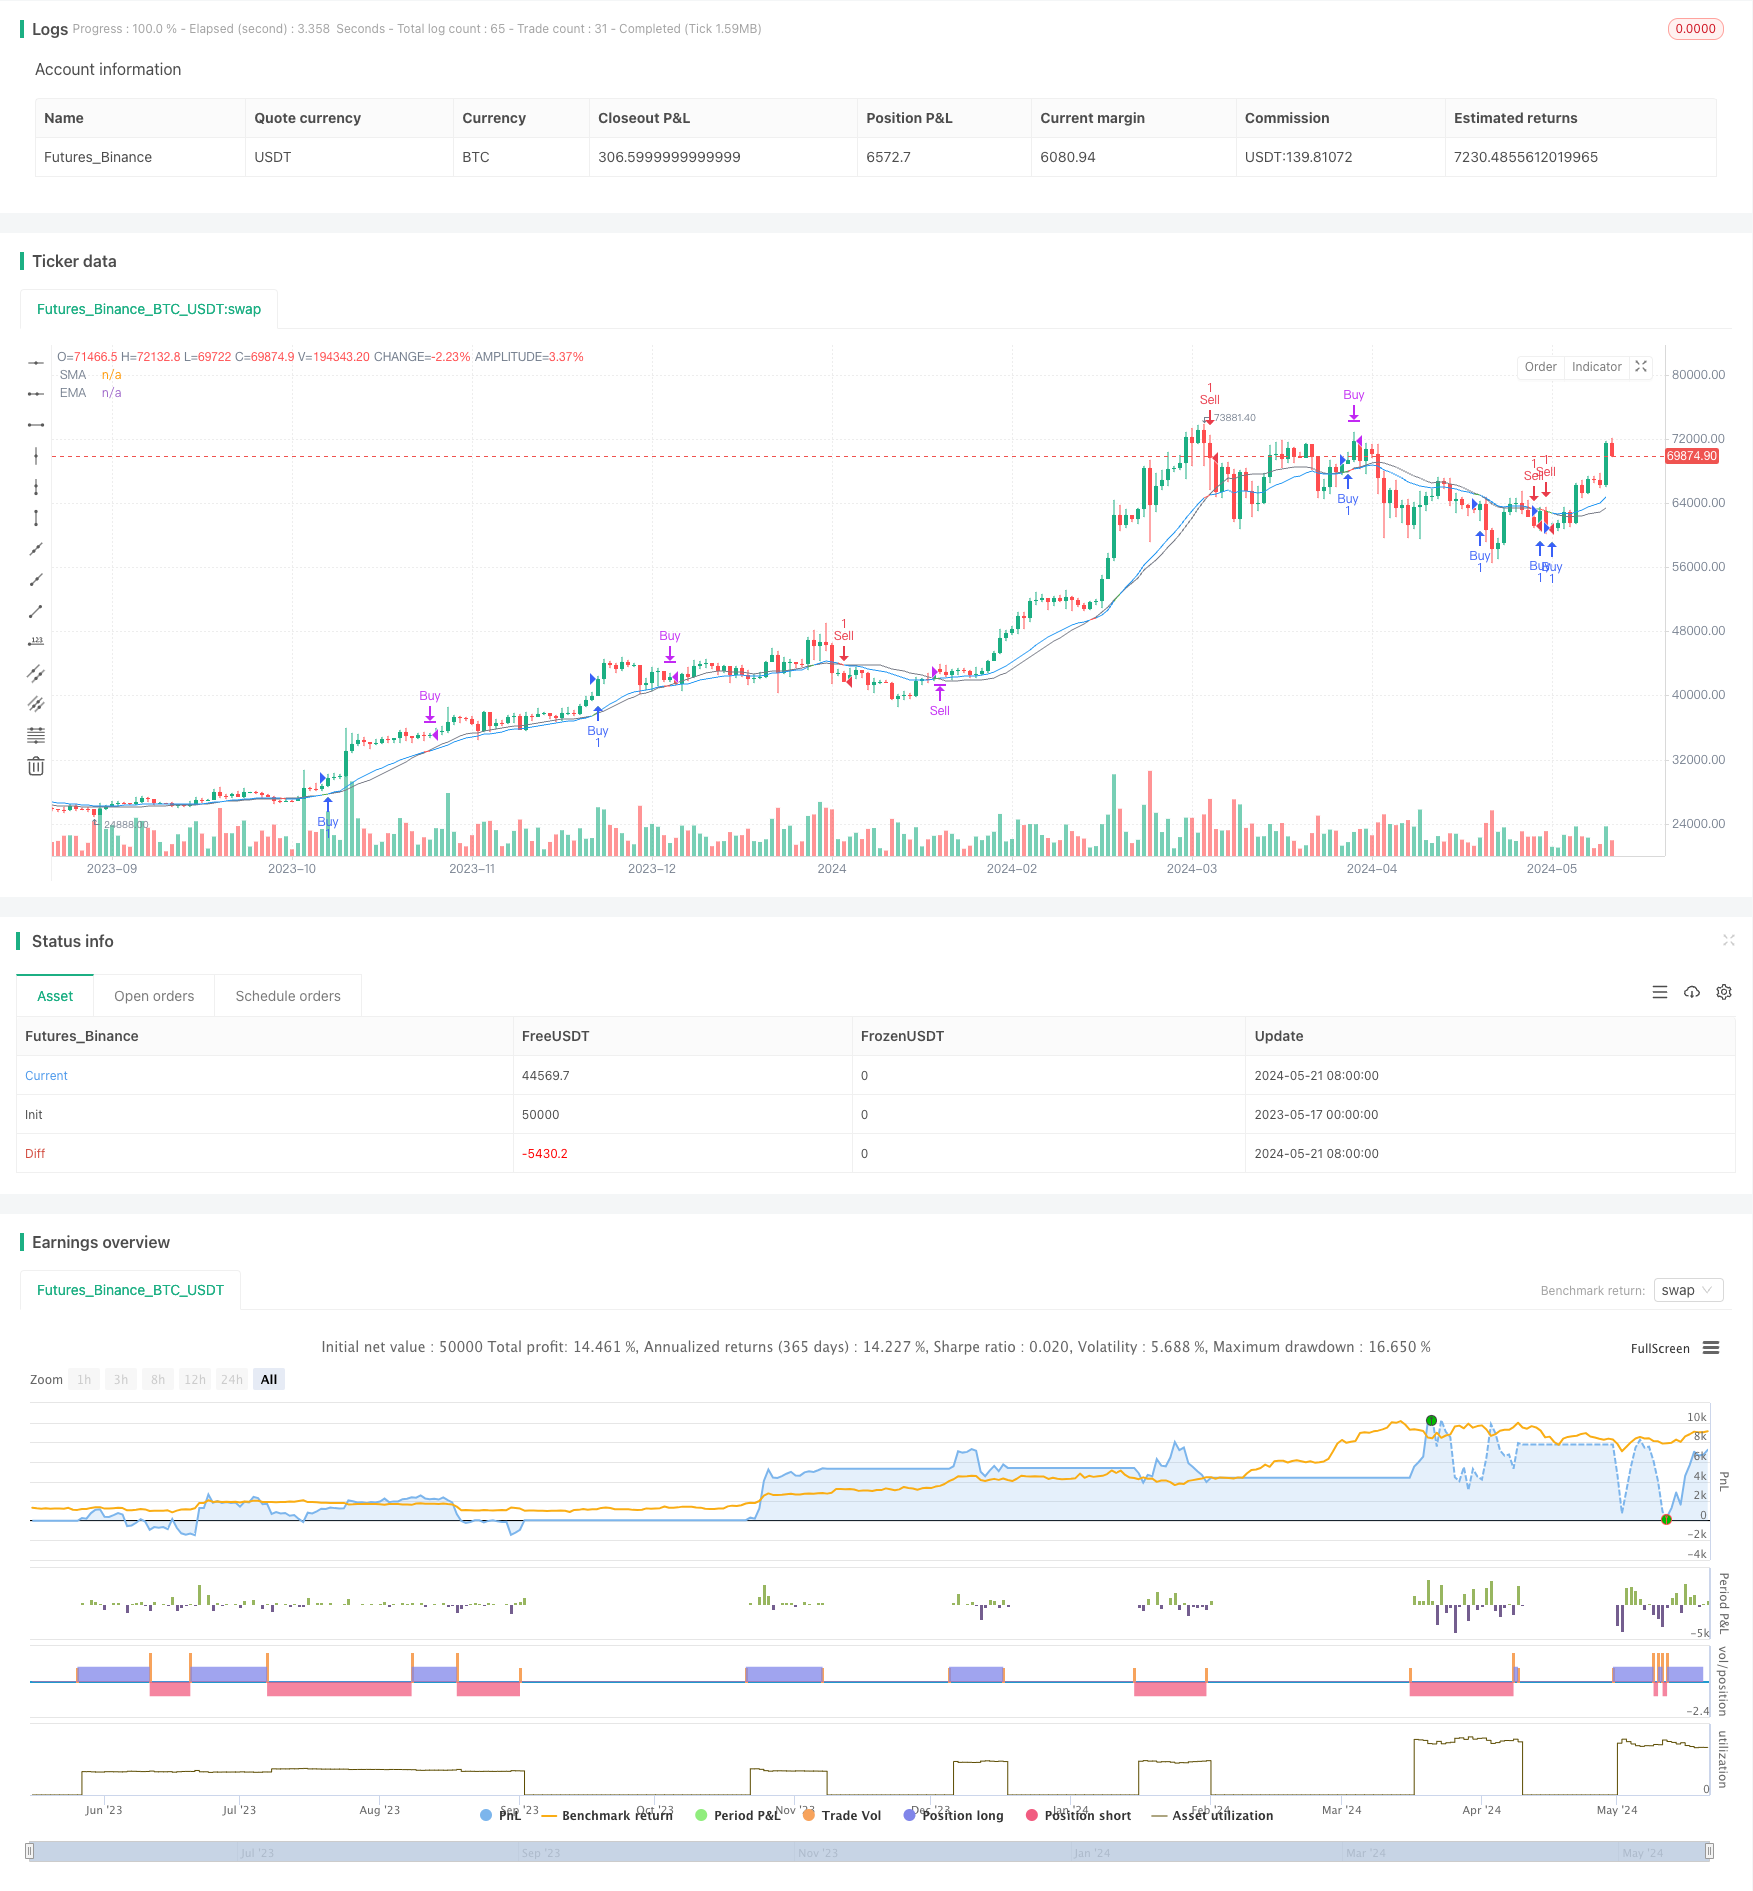
Overview
This strategy is a crossover strategy based on two moving averages, EMA and SMA. When the slower EMA crosses above the faster SMA, it generates a buy signal; when the slower EMA crosses below the faster SMA, it generates a sell signal. The strategy aims to capture upward trends in bull markets while providing some support.
Strategy Principle
The strategy uses two moving averages: a 20-period SMA and a 21-period EMA. When the EMA crosses above the SMA, it indicates that the market may be turning into an upward trend, thus generating a buy signal. Conversely, when the EMA crosses below the SMA, it indicates that the market may be turning into a downward trend, thus generating a sell signal. To confirm the signals, the strategy also requires the current closing price to be higher than the previous closing price (for buy signals) or lower than the previous closing price (for sell signals).
Advantage Analysis
- Simple and easy to understand: The strategy is based on two commonly used moving averages, with a simple principle that is easy to understand and implement.
- Trend tracking: By using the crossover of moving averages, the strategy can capture trend changes in the market relatively well, especially upward trends in bull markets.
- Support function: The slower EMA can act as a certain level of support, providing support when prices retrace.
Risk Analysis
- False signals: In highly volatile or choppy markets, the strategy may generate many false signals, leading to frequent trades and high trading costs.
- Lag: Moving averages have a certain lag, which may cause missing the best entry and exit points.
- Trend recognition: The strategy has limited ability to identify trends, and may perform poorly at market turning points or when trends are unclear.
Optimization Directions
- Combine with other indicators: Consider combining with other technical indicators, such as RSI, MACD, etc., to improve the reliability and accuracy of signals.
- Optimize parameters: Optimize the period parameters of the moving averages to adapt to different market conditions and trading instruments.
- Add stop-loss and take-profit: To control risks and protect profits, add appropriate stop-loss and take-profit mechanisms to the strategy.
Summary
The EMA-SMA Crossover Bull Market Support Band Strategy is a simple and easy-to-understand trend-following strategy that is particularly suitable for bull markets. However, the strategy also has certain limitations, such as false signals, lag, and limited trend recognition ability. By combining with other indicators, optimizing parameters, and adding stop-loss and take-profit, the performance and robustness of the strategy can be further improved.
Source Pine Script
/*backtest
start: 2023-05-17 00:00:00
end: 2024-05-22 00:00:00
period: 1d
basePeriod: 1h
exchanges: [{"eid":"Futures_Binance","currency":"BTC_USDT"}]
*/

// This source code is subject to the terms of the Mozilla Public License 2.0 at https://mozilla.org/MPL/2.0/
// © rodrinverte

//@version=5
strategy("EMA-SMA Crossover Strategy", overlay=true, initial_capital = 1000)

// Definir la longitud de las medias móviles
fast = ta.sma(close, 20)
slow = ta.ema(close, 21)

// Definir condiciones de compra y venta
buySignal = ta.crossover(slow, fast)
sellSignal = ta.crossunder(slow, fast)

// Configurar colores de las líneas y relleno
emaColor = buySignal ? color.green : sellSignal ? color.red : color.blue
smaColor = color.gray
fillColor = slow < fast ? color.new(color.green, 90) : color.new(color.red, 90)

// Esperar un periodo para confirmar la señal de compra o venta
buyConfirmation = close > close[1] and buySignal
sellConfirmation = close < close[1] and sellSignal

// Dibujar las medias móviles
plot(slow, title="EMA", color=emaColor)
plot(fast, title="SMA", color=smaColor)

// Configurar las señales de compra y venta
plotshape(buyConfirmation, style=shape.triangleup, location=location.belowbar, color=color.green, size=size.small)
plotshape(sellConfirmation, style=shape.triangledown, location=location.abovebar, color=color.red, size=size.small)

// Estrategia de compra y venta
if (buyConfirmation)
    strategy.entry("Buy", strategy.long)

if (sellConfirmation)
    strategy.entry("Sell", strategy.short)

// Cerrar posición opuesta al cruce original
if (sellSignal)
    strategy.close("Buy")

if (buySignal)
    strategy.close("Sell")
Published by ChaoZhang on the FMZ strategy square · last modified 2024-05-23. Collected in the Quant Trading Vault. Unvalidated research: re-test with your own data and costs before trusting it.
Build this with AgenKit
A spec is not a trading system. Paste this into your coding agent and AgenKit runs a specialist team — architecture, test-first build, risk gates, review — with paper trading on by default.
/agenkit build a production-grade trading bot with a backtest engine, risk controls and paper trading by default from strategies/EMA-SMA-Crossover-Bull-Market-Support-Band-Strategy.md- npx agenkit install engineering-kit in your project
- Paste the command into your agent and approve each phase
- Get tests, backtest, risk controls and a paper-trading switch
Understand it first
Before you run this, read the lesson behind the idea and how to backtest it honestly. Specs like this one are the survivors of an unknown number of trials; deflate their results accordingly.
Related specs
- Bollinger Bands and RSI Trend Following StrategyPine Script · Trend following · 1h
- Dual ATR Channel Trend Following StrategyPine Script · Trend following · 15m
- Dynamic Dual EMA Crossover Strategy with Adaptive Profit Loss ControlPine Script · Trend following · 1d
- EMA SMA Multi Indicator Comprehensive Trend Following StrategyPine Script · Trend following · 1h
- EMA and RSI Trend Trading StrategyPine Script · Trend following · 1d
- Fixed Range Volume Profile And Anchored VWAP Trend Identification Strategy With Dynamic Stop LossPine Script · Trend following · 1h