Strategy vault / Trend following
Five EMA RSI Trend Following Dynamic Channel Trading System
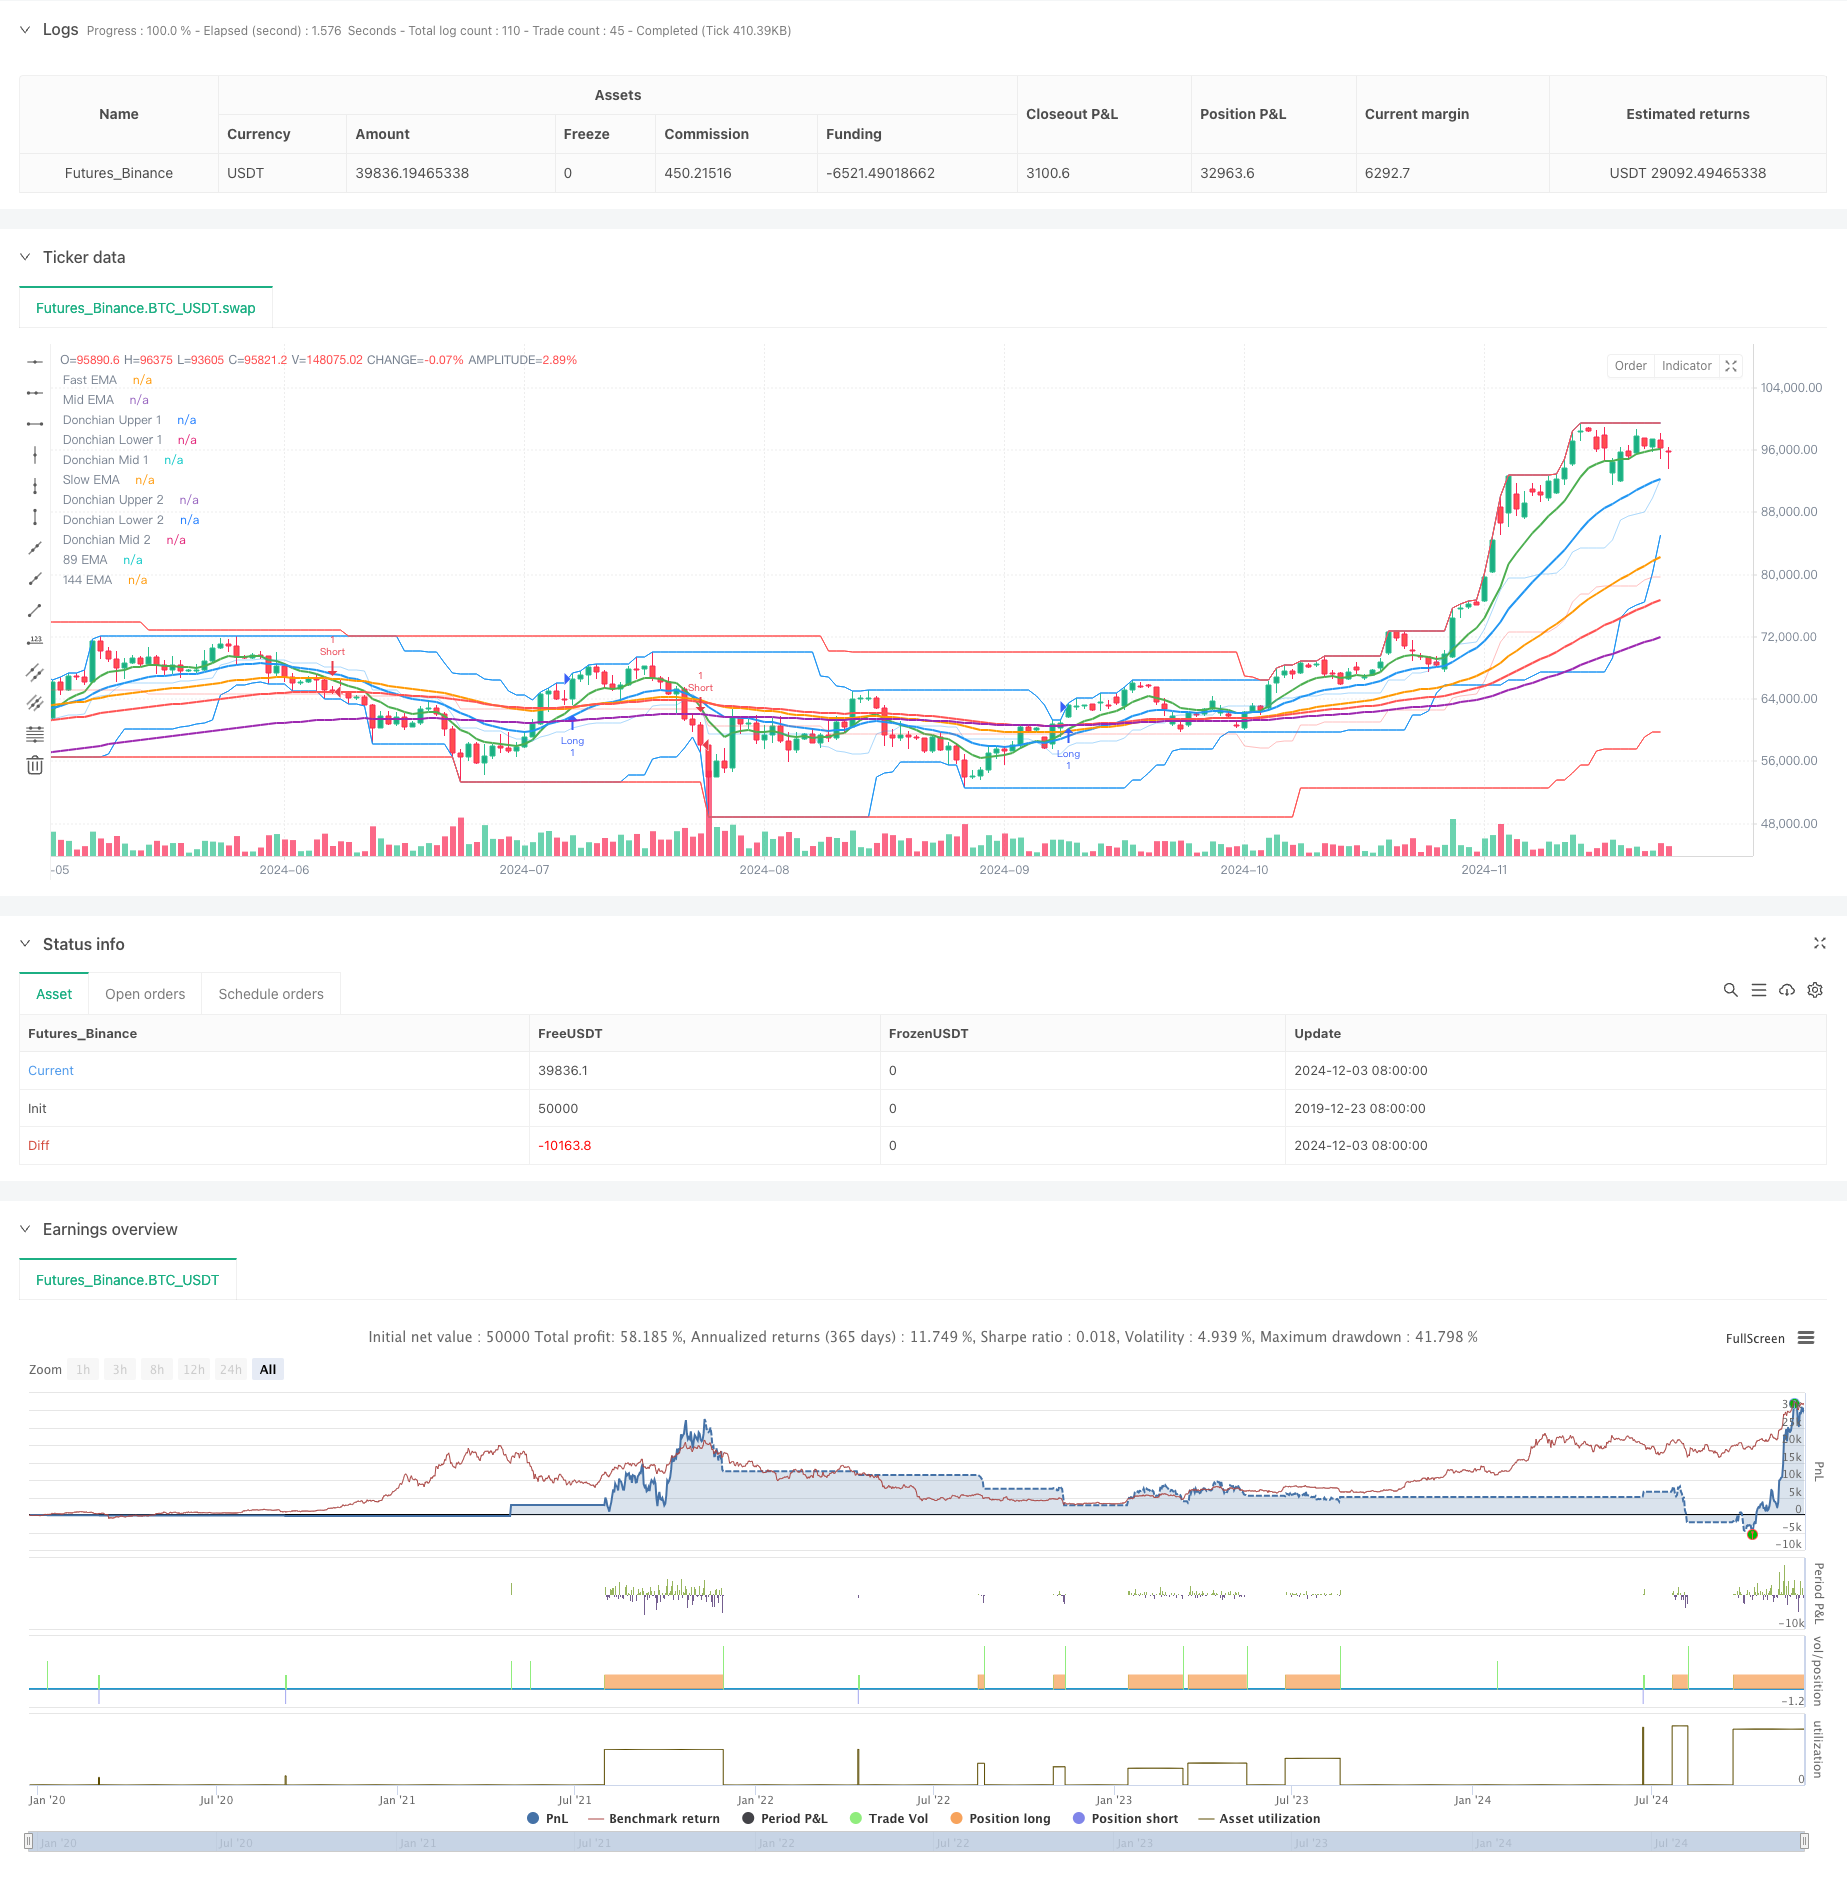
This strategy is a trend-following system that combines multiple technical indicators, primarily integrating five Exponential Moving Averages (EMAs) of different periods, the Relative Strength Index (RSI), and two…
Overview
This strategy is a trend-following system that combines multiple technical indicators, primarily integrating five Exponential Moving Averages (EMAs) of different periods, the Relative Strength Index (RSI), and two Donchian Channels of different periods. The system captures market trends through the coordination of multiple indicators and manages risk and returns using dynamic stop-loss and profit targets.
Strategy Principles
The strategy employs multiple technical indicators for signal confirmation: First, it uses 5 EMAs (9, 21, 55, 89, 144 periods) to construct a trend framework, determining initial trend direction through crossovers between fast and slow EMAs. Second, it uses RSI (14 periods) as a trend filter, requiring RSI to be in the overbought zone (above 60) for long positions and oversold zone (below 40) for short positions, thus avoiding frequent trading in ranging markets. Finally, it uses 21-period and 74-period Donchian Channels to define price movement ranges, providing additional market structure reference for trading.
Strategy Advantages
- Multiple technical indicators cross-validation improves signal reliability
- Combination of trend-following and momentum indicators performs well in trending markets
- Uses dynamic stop-loss and multiple profit targets to protect capital while maximizing trend utilization
- RSI filtering reduces false signals in ranging markets
- High degree of system automation reduces emotional interference
Strategy Risks
- Multiple indicators may lead to signal lag, causing significant drawdowns in quick reversal markets
- RSI filtering might miss important trend beginnings
- Fixed percentage stop-loss and profit targets may not suit all market conditions
- Frequent stop-loss hits possible in highly volatile markets
- Too many technical indicators may lead to system over-optimization
Optimization Directions
- Introduce adaptive indicator parameters that adjust dynamically based on market volatility
- Add volume indicators as auxiliary confirmation
- Develop more flexible stop-loss strategies, such as trailing stops or ATR-based dynamic stops
- Implement market condition recognition mechanism for different parameter settings in different market conditions
- Consider adding time filters to avoid trading during unfavorable periods
Conclusion
The strategy constructs a relatively complete trading system through the combination of multiple technical indicators. While it has some lag, it can achieve stable returns in trending markets through strict signal filtering and risk management. Traders are advised to adjust parameters according to specific market characteristics and their risk tolerance in practical applications. Meanwhile, continuous monitoring of system performance and regular evaluation of optimization directions are necessary to ensure the strategy remains adaptable to market changes.
Source Pine Script
/*backtest
start: 2019-12-23 08:00:00
end: 2024-12-04 00:00:00
period: 1d
basePeriod: 1d
exchanges: [{"eid":"Futures_Binance","currency":"BTC_USDT"}]
*/

//@version=5
strategy("EMA RSI Donchian Strategy", overlay=true)

// Input parameters
fastEmaLength = input(9, title="Fast EMA Length")
midEmaLength = input(21, title="Mid EMA Length")
slowEmaLength = input(55, title="Slow EMA Length")
ema89Length = input(89, title="89 EMA Length")
ema144Length = input(144, title="144 EMA Length")
rsiPeriod = input(14, title="RSI Period")
rsiOverbought = input(60, title="RSI Overbought Level")
rsiOversold = input(40, title="RSI Oversold Level")
donchianLength1 = input(21, title="Donchian Channel Length 1")
donchianLength2 = input(74, title="Donchian Channel Length 2")

// EMA calculations
fastEma = ta.ema(close, fastEmaLength)
midEma = ta.ema(close, midEmaLength)
slowEma = ta.ema(close, slowEmaLength)
ema89 = ta.ema(close, ema89Length)
ema144 = ta.ema(close, ema144Length)

// RSI calculation
rsi = ta.rsi(close, rsiPeriod)

// Donchian Channel calculations
donchianUpper1 = ta.highest(high, donchianLength1)
donchianLower1 = ta.lowest(low, donchianLength1)
donchianUpper2 = ta.highest(high, donchianLength2)
donchianLower2 = ta.lowest(low, donchianLength2)
donchianMid1 = (donchianUpper1 + donchianLower1) / 2
donchianMid2 = (donchianUpper2 + donchianLower2) / 2

// Plot EMAs
plot(fastEma, color=color.green, linewidth=2, title="Fast EMA")
plot(midEma, color=color.blue, linewidth=2, title="Mid EMA")
plot(slowEma, color=color.orange, linewidth=2, title="Slow EMA")
plot(ema89, color=color.red, linewidth=2, title="89 EMA")
plot(ema144, color=color.purple, linewidth=2, title="144 EMA")

// Plot Donchian Channels
plot(donchianUpper1, color=color.new(color.blue, 0), title="Donchian Upper 1")
plot(donchianLower1, color=color.new(color.blue, 0), title="Donchian Lower 1")
plot(donchianMid1, color=color.new(color.blue, 80), title="Donchian Mid 1")
plot(donchianUpper2, color=color.new(color.red, 0), title="Donchian Upper 2")
plot(donchianLower2, color=color.new(color.red, 0), title="Donchian Lower 2")
plot(donchianMid2, color=color.new(color.red, 80), title="Donchian Mid 2")

// Entry Conditions
longCondition = ta.crossover(fastEma, slowEma) and rsi > rsiOverbought
shortCondition = ta.crossunder(fastEma, slowEma) and rsi < rsiOversold

// Stop Loss and Take Profit
var float longStopLoss = na
var float longTakeProfit1 = na
var float longTakeProfit2 = na
var float shortStopLoss = na
var float shortTakeProfit1 = na
var float shortTakeProfit2 = na

if longCondition
    longStopLoss := high * 0.99
    longTakeProfit1 := longStopLoss * 1.02618
    longTakeProfit2 := longStopLoss * 1.036185
    strategy.entry("Long", strategy.long)

if shortCondition
    shortStopLoss := low * 1.01
    shortTakeProfit1 := shortStopLoss * 0.97382
    shortTakeProfit2 := shortTakeProfit1 * 0.96381
    strategy.entry("Short", strategy.short)

// Exit Conditions
if not na(longStopLoss)
    strategy.exit("Take Profit 1", "Long", limit=longTakeProfit1)
    strategy.exit("Take Profit 2", "Long", limit=longTakeProfit2)
    strategy.exit("Stop Loss", "Long", stop=longStopLoss)

if not na(shortStopLoss)
    strategy.exit("Take Profit 1", "Short", limit= shortTakeProfit1)
    strategy.exit("Take Profit 2", "Short", limit=shortTakeProfit2)
    strategy.exit("Stop Loss", "Short", stop=shortStopLoss)

// Labels for buy and sell signals
if longCondition
    label.new(bar_index, low, "Buy", color=color.green, style=label.style_label_up, textcolor=color.white)

if shortCondition
    label.new(bar_index, high, "Sell", color=color.red, style=label.style_label_down, textcolor=color.white)

// Alerts
alertcondition(longCondition, title="Long Entry Alert", message="Long entry signal")
alertcondition(shortCondition, title="Short Entry Alert", message="Short entry signal")Published by ChaoZhang on the FMZ strategy square · last modified 2024-12-05. Collected in the Quant Trading Vault. Unvalidated research: re-test with your own data and costs before trusting it.
Build this with AgenKit
A spec is not a trading system. Paste this into your coding agent and AgenKit runs a specialist team — architecture, test-first build, risk gates, review — with paper trading on by default.
/agenkit build a production-grade trading bot with a backtest engine, risk controls and paper trading by default from strategies/Five-EMA-RSI-Trend-Following-Dynamic-Channel-Trading-System.md- npx agenkit install engineering-kit in your project
- Paste the command into your agent and approve each phase
- Get tests, backtest, risk controls and a paper-trading switch
Understand it first
Before you run this, read the lesson behind the idea and how to backtest it honestly. Specs like this one are the survivors of an unknown number of trials; deflate their results accordingly.
Related specs
- TrendHunter w MF Multi Timeframe Trend StrategyPine Script · Trend following · 1h
- Multitimeframe Trend Hunter StrategyPine Script · Trend following · 1h
- Multi Indicator Adaptive Trend Following StrategyPine Script · Trend following · 1d
- Adaptive ATR and RSI Trend Following Strategy with Trailing Stop LossPine Script · Trend following · 1h
- Bollinger Bands and RSI Trend Following StrategyPine Script · Trend following · 1h
- Dual ATR Channel Trend Following StrategyPine Script · Trend following · 15m