Glory Hole Breakout Strategy
The Glory Hole breakout strategy is a trend following strategy that combines moving average and ADX indicators to determine price trend and strength, and enters the market when price breaks through the moving…
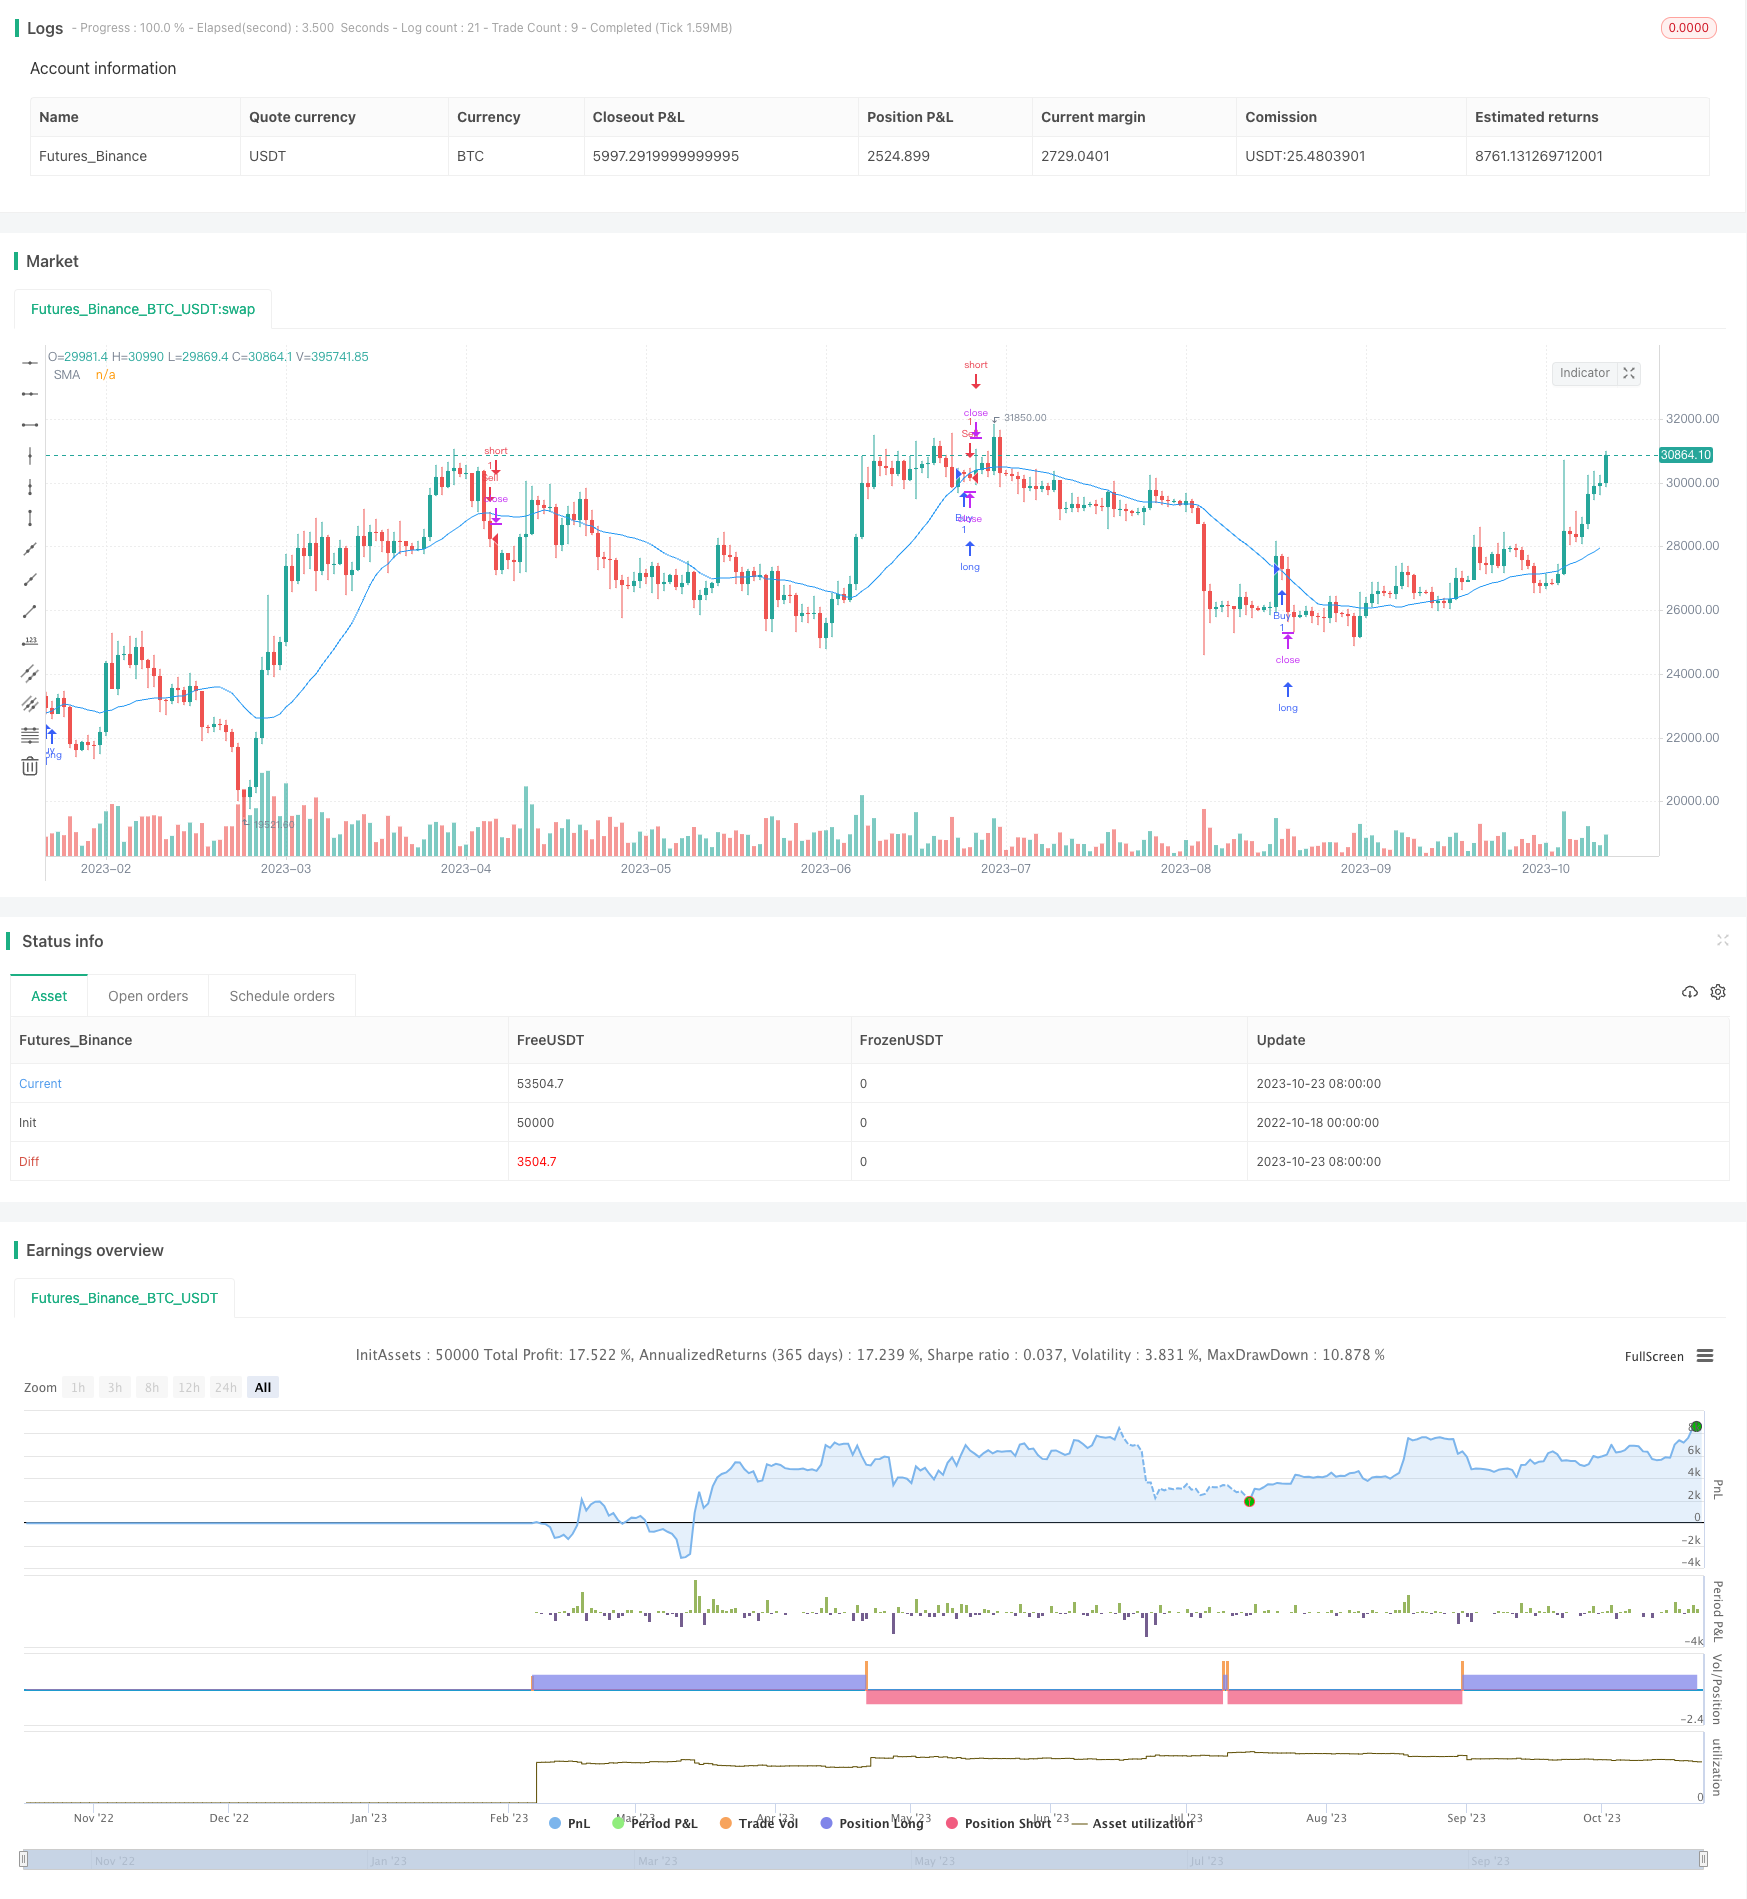
Overview
The Glory Hole breakout strategy is a trend following strategy that combines moving average and ADX indicators to determine price trend and strength, and enters the market when price breaks through the moving average. This simple and practical strategy can effectively track trends and has high profit potential.
Strategy Logic
The strategy is mainly based on three indicators:
SMA: Simple moving average to determine price trend direction.
ADX: Average directional movement index to measure trend strength. Higher ADX indicates stronger trend.
Glory Hole Condition: Bullish when close > open and close near low. Bearish when close < open and close near high.
The trading logic is:
Calculate N-period SMA to determine overall trend.
Calculate M-period ADX to determine trend strength. Trade only if ADX is above threshold.
Go long when bullish glory hole forms, close > SMA and ADX > threshold.
Go short when bearish glory hole forms, close < SMA and ADX > threshold.
Exit with stop loss or take profit.
Advantages
Combines trend direction and strength for effective trend following.
Glory hole filters out false breakouts and improves entry quality.
SMA captures mid to long term trends better than EMA.
ADX avoids trading in no-trend zones, ensuring high probability setups.
Simple and clear rules easy to implement.
Risks
SMA lag may cause premature or delayed entries leading to stopped out trades. Optimize SMA Period.
ADX may wrongly judge trend reversal as no-trend zone. Lower ADX threshold to manage risk.
Despite glory hole, tight risk management needed for real trades. Adjust stop loss properly.
Lack of long/short balance logic. Manual intervention or optimization needed.
Enhancement Opportunities
Optimize SMA and ADX parameters to find best combination.
Add other trend indicators like Bollinger or KDJ to improve entry quality.
Add exit logic like trend reversal or drawdown percentage to refine exits.
Add long/short ratio judgement to avoid excessive one-sided trades.
Optimize stop loss from fixed to trailing or staggered.
Optimize risk management for better single trade risk control.
Summary
The Glory Hole strategy integrates SMA and ADX to determine trend direction and strength. It generates signals on glory hole condition to effectively track trends. The strategy has the advantage of capturing trends and filtering noise, but also lagging trend determination and stop loss risks. Further improvements in parameter optimization, enter/exit logic, and risk management will enhance its efficiency and stability.
Parameters
| Name | Default | What it controls |
|---|---|---|
| v_input_1 | 20 | SMA |
| v_input_2_close | 0 | Source: close | high | low | open | hl2 | hlc3 | hlcc4 | ohlc4 |
| v_input_3 | 30 | ADX Tradelevel |
| v_input_4 | 14 | ADX Smoothing |
| v_input_5 | 14 | DI Length |
Source Pine Script
/*backtest
start: 2022-10-18 00:00:00
end: 2023-10-24 00:00:00
period: 1d
basePeriod: 1h
exchanges: [{"eid":"Futures_Binance","currency":"BTC_USDT"}]
*/

//@version=2
strategy("Glory Hole with SMA + ADX", overlay=true)
len = input(20, minval=1, title="SMA")
src = input(close, title="Source")
ADXlevel = input(30, minval=1, title="ADX Tradelevel")
out = sma(src, len)

//adx
adxlen = input(14, title="ADX Smoothing")
dilen = input(14, title="DI Length")
dirmov(len) =>
	up = change(high)
	down = -change(low)
	truerange = rma(tr, len)
	plus = fixnan(100 * rma(up > down and up > 0 ? up : 0, len) / truerange)
	minus = fixnan(100 * rma(down > up and down > 0 ? down : 0, len) / truerange)
	[plus, minus]

adx(dilen, adxlen) =>
	[plus, minus] = dirmov(dilen)
	sum = plus + minus
	adx = 100 * rma(abs(plus - minus) / (sum == 0 ? 1 : sum), adxlen)

sig = adx(dilen, adxlen)

plot(out, title="SMA", color=blue)

bullish = ((out<close) and (out<open) and (out>low) and (sig>ADXlevel))
bearish = ((out>close) and (out>open) and (out<high) and (sig>ADXlevel))


if (bullish)
    strategy.entry("Buy", strategy.long)

if (bearish)
    strategy.entry("Sell", strategy.short)
Published by ChaoZhang on the FMZ strategy square · last modified 2023-10-25. Collected in the Quant Trading Vault. Unvalidated research: re-test with your own data and costs before trusting it.
Build this with AgenKit
A spec is not a trading system. Paste this into your coding agent and AgenKit runs a specialist team — architecture, test-first build, risk gates, review — with paper trading on by default.
/agenkit build a production-grade trading bot with a backtest engine, risk controls and paper trading by default from strategies/Glory-Hole-Breakout-Strategy.md- npx agenkit install engineering-kit in your project
- Paste the command into your agent and approve each phase
- Get tests, backtest, risk controls and a paper-trading switch
Understand it first
Before you run this, read the lesson behind the idea and how to backtest it honestly. Specs like this one are the survivors of an unknown number of trials; deflate their results accordingly.
Related specs
- Momentum Breakout Trading Strategy 440964Pine Script · Breakout · 5m
- Moving Average Crossover and Upper Rail Breakthrough Impulse StrategyPine Script · Breakout · 1m
- Best TradingView StrategyPine Script · Breakout · 15m
- Bollinger Bands Momentum Breakout Adaptive Trend Following StrategyPine Script · Breakout · 1d
- Volatility Breakthrough StrategyPine Script · Breakout · 10m
- High Frequency Volatility Breakout Trend Following StrategyPine Script · Breakout · 4h