Strategy vault / Mean reversion
GM 8 ADX Dual Moving Average Strategy
The GM-8 & ADX Dual Moving Average Strategy is a quantitative trading strategy that combines multiple technical indicators. It utilizes the GM-8 indicator, ADX indicator, and a second EMA indicator to identify…
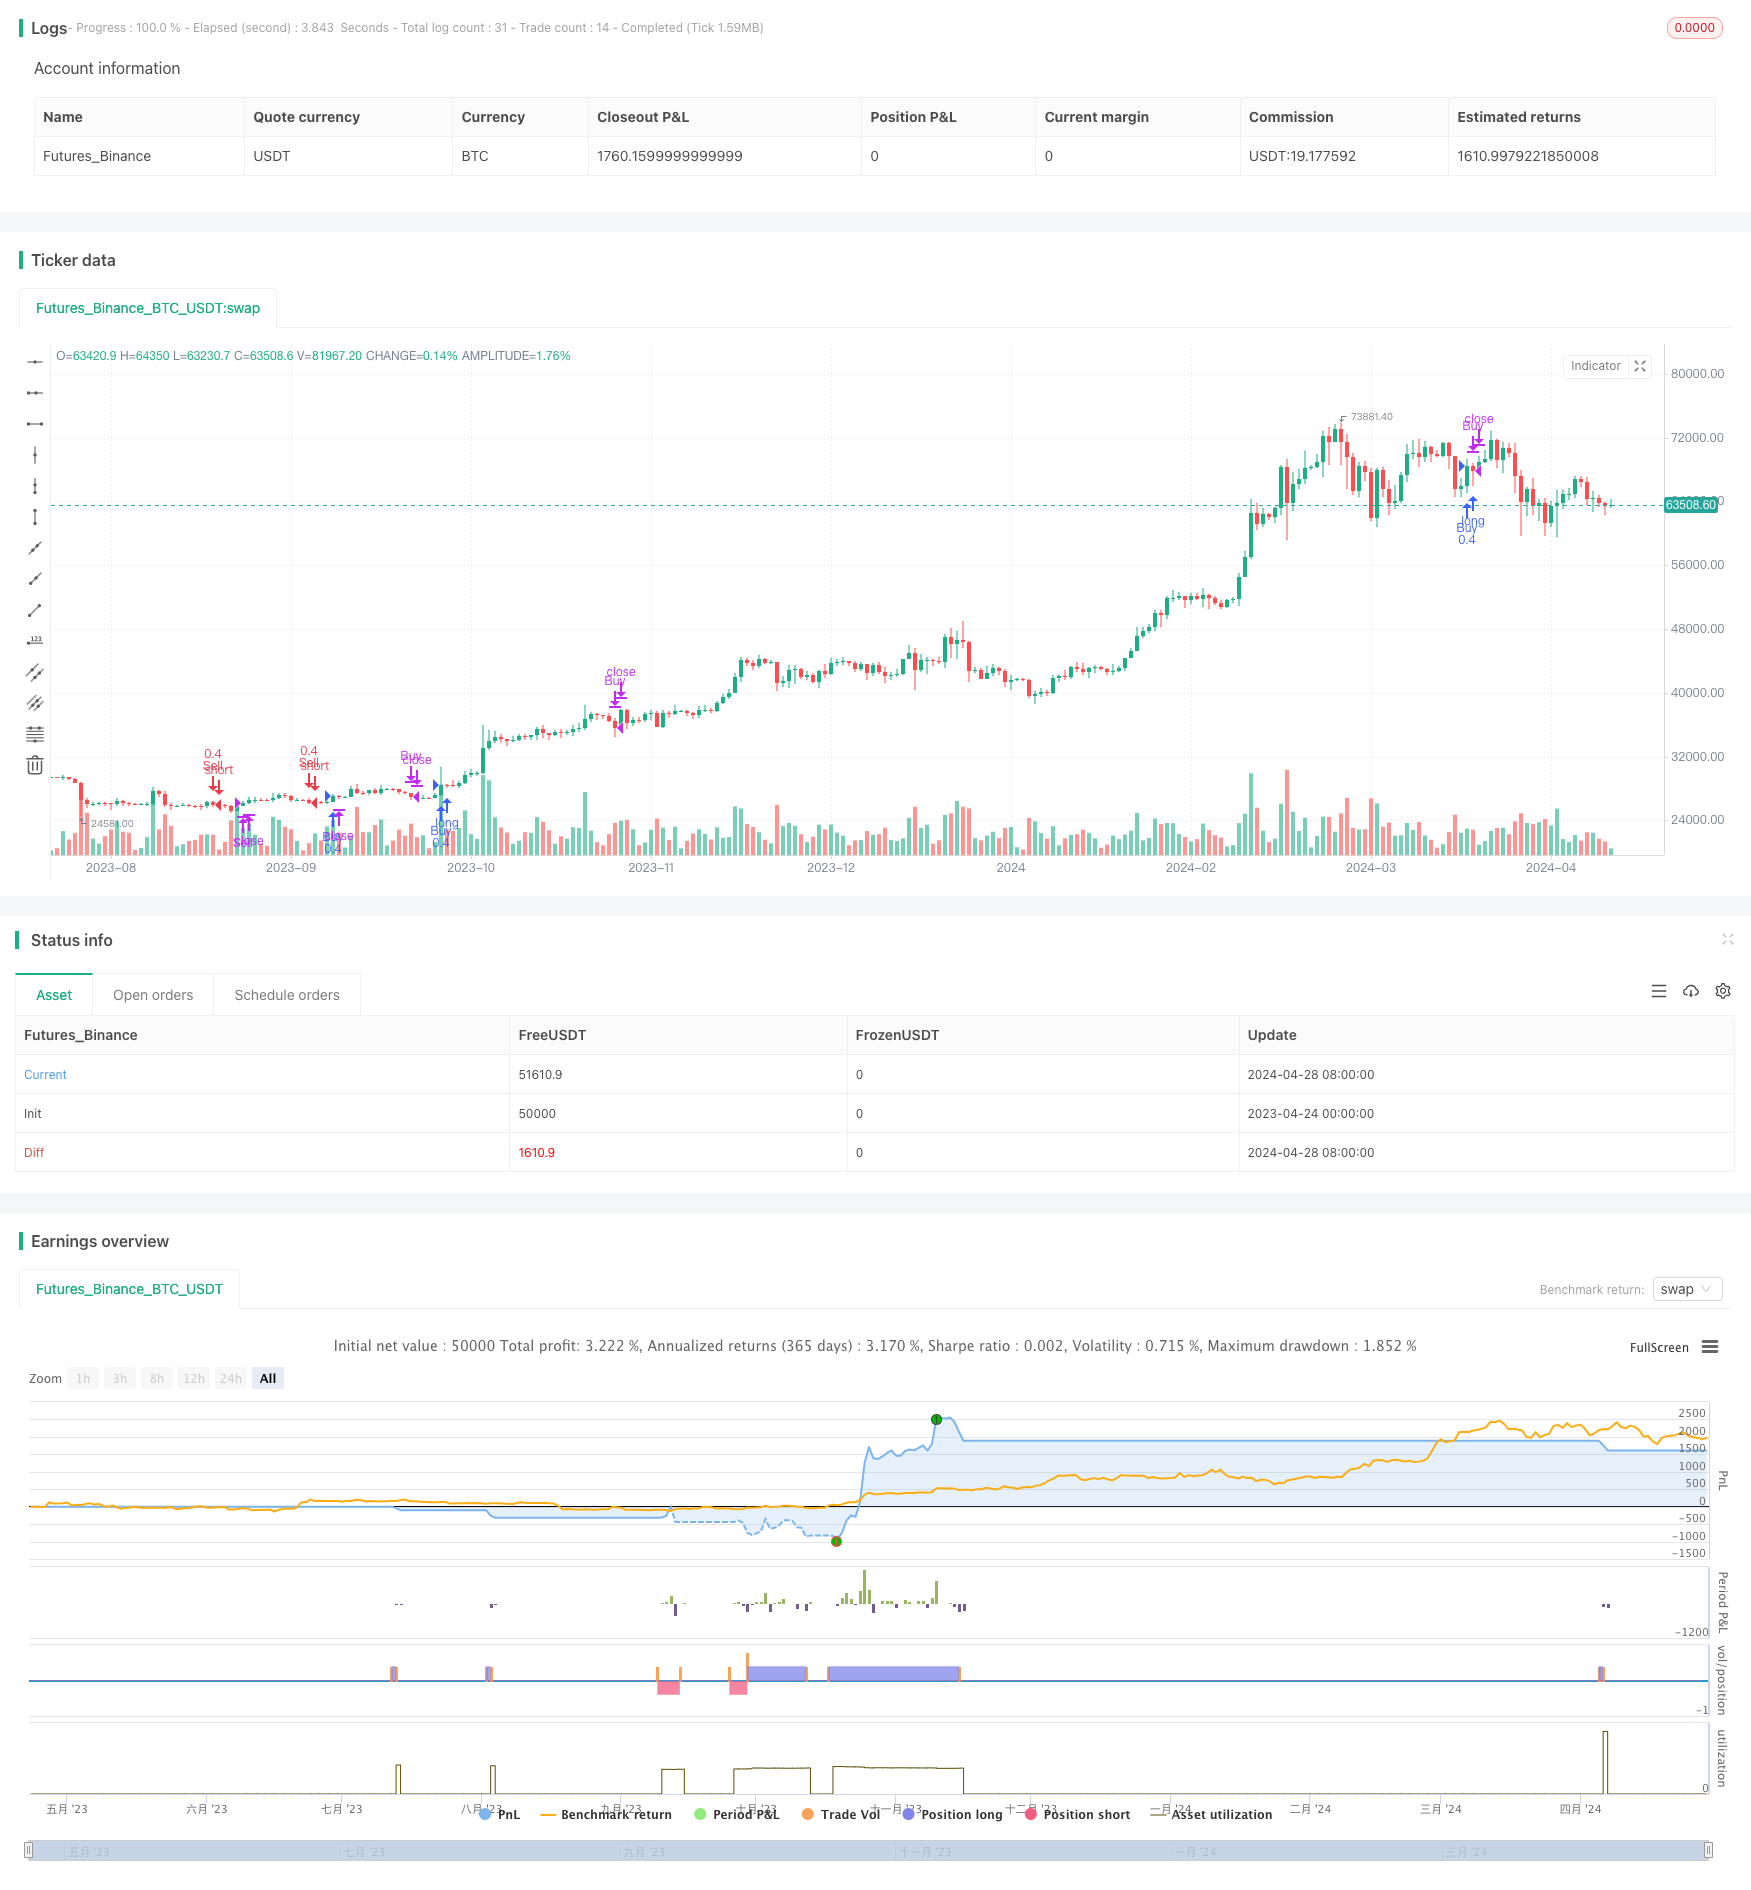
Overview
The GM-8 & ADX Dual Moving Average Strategy is a quantitative trading strategy that combines multiple technical indicators. It utilizes the GM-8 indicator, ADX indicator, and a second EMA indicator to identify potential buy and sell signals. The GM-8 indicator is used to determine price trends, the ADX indicator is used to confirm trend strength, and the second EMA indicator is used to assist in determining trend direction. Buy and sell signals are generated when the price breaks through the GM-8 moving average and the ADX indicator is above a threshold. The advantage of this strategy lies in its combination of multiple indicators, which improves the reliability of signals. However, it also carries certain risks, such as false signals and lag. Optimization directions include parameter optimization, adding stop-loss and take-profit, etc. Overall, the GM-8 & ADX Dual Moving Average Strategy is a relatively mature quantitative trading strategy that merits further research and optimization.
Strategy Principle
The principle of the GM-8 & ADX Dual Moving Average Strategy is as follows:
- Calculate the GM-8 indicator to determine price trends. When the closing price crosses above/below the GM-8 moving average, it indicates a potential trend reversal.
- Calculate the ADX indicator to confirm trend strength. When the ADX indicator is above a threshold (e.g., 34), it indicates a strong current trend and entry can be considered.
- Calculate a second EMA indicator to assist in determining trend direction. When the price is above the second EMA, it tends to be bullish; otherwise, it tends to be bearish.
- Comprehensively consider GM-8, ADX, and the second EMA to generate buy and sell signals:
- Long signal: The current closing price crosses above the GM-8 moving average, and is higher than both GM-8 and the second EMA, while ADX is above the threshold.
- Short signal: The current closing price crosses below the GM-8 moving average, and is lower than both GM-8 and the second EMA, while ADX is above the threshold.
- Once entered, hold the position until an exit signal appears:
- Close long signal: The current closing price crosses below the GM-8 moving average and is lower than GM-8.
- Close short signal: The current closing price crosses above the GM-8 moving average and is higher than GM-8.
Strategy Advantages
- Combines multiple indicators to improve signal reliability: This strategy comprehensively considers the trend indicator (GM-8), trend strength indicator (ADX), and trend direction indicator (EMA), which can effectively filter out some false signals.
- Adjustable parameters for high flexibility: The various parameters of this strategy, such as GM-8 period, ADX period, ADX threshold, second EMA period, etc., can be adjusted according to market characteristics and personal preferences to adapt to different trading styles.
- Clear logic and easy to implement: The trading logic of this strategy is relatively simple and straightforward, easy to understand and implement, suitable for novice quantitative traders to learn and use.
Strategy Risks
- Lagging trend recognition: GM-8 and other trend-based indicators are inherently lagging indicators, which may result in delayed trend recognition, leading to missed optimal entry points or increased losses.
- Frequent trading: This strategy generates relatively frequent buy and sell signals, which may lead to frequent trading, increasing transaction costs, and may perform poorly in a rangebound market.
- Difficulty in parameter selection: This strategy includes multiple parameters, and finding the optimal parameter combination requires a large amount of backtesting and analysis work, which can be challenging for beginners.
Strategy Optimization Directions
- Introduce more filtering conditions: In addition to GM-8, ADX, and EMA, other auxiliary indicators such as trading volume, volatility, etc. can be added to further improve signal quality.
- Optimize entry and exit timing: Consider introducing gradual position building and gradual profit-taking and stop-loss methods to reduce single trade risk and improve overall profitability.
- Dynamically adjust parameters: Based on changes in market conditions, dynamically adjust strategy parameters, such as using longer GM-8 periods in trending markets and shorter GM-8 periods in rangebound markets.
- Add position management: Based on factors such as account capital status and risk preference, control the position size of each trade to avoid excessive risk concentration.
Summary
The GM-8 & ADX Dual Moving Average Strategy is a classic quantitative trading strategy that combines multiple technical indicators to identify buy and sell signals. The advantages of this strategy lie in its simple and clear logic, relatively reliable signals, and suitability for beginners to learn and use. However, it also carries risks such as lagging trend recognition, frequent trading, and difficulty in parameter selection. To further enhance the strategy's performance, optimization measures such as introducing more filtering conditions, optimizing entry and exit timing, dynamically adjusting parameters, and adding position management can be considered. Overall, the GM-8 & ADX Dual Moving Average Strategy provides a good basic framework for quantitative trading and is worth continuous refinement and improvement in practice.
Parameters
| Name | Default | What it controls |
|---|---|---|
| v_input_1 | 15 | GM-15 Period |
| v_input_2 | 59 | Second EMA Period |
| v_input_3 | 8 | ADX Period |
| v_input_4 | 34 | ADX Threshold |
| v_input_float_1 | 0.4 | Lot Size |
Source Pine Script
/*backtest
start: 2023-04-24 00:00:00
end: 2024-04-29 00:00:00
period: 1d
basePeriod: 1h
exchanges: [{"eid":"Futures_Binance","currency":"BTC_USDT"}]
*/

//@version=5
strategy("GM-8 and ADX Strategy with Second EMA", overlay=true)

// Input parameters
gm_period = input(15, title="GM-15 Period")
second_ema_period = input(59, title="Second EMA Period")
adx_period = input(8, title="ADX Period")
adx_threshold = input(34, title="ADX Threshold")
lot_size = input.float(0.4, title="Lot Size")

// Calculate the ADX manually
adx(high, low, close, length) =>
    sum_truerange = 0.0
    sum_plusDM = 0.0
    sum_minusDM = 0.0
    for i = 1 to length
        truerange_calc = high[i] - low[i]
        truerange_prev_close = high[i] - close[i-1]
        truerange_close = low[i] - close[i-1]
        truerange_calc := truerange_prev_close > truerange_calc ? truerange_prev_close : truerange_calc
        truerange_calc := truerange_close > truerange_calc ? truerange_close : truerange_calc
        sum_truerange := sum_truerange + truerange_calc
        plusDM = high[i] - high[i-1] > low[i-1] - low[i] and high[i] - high[i-1] > 0 ? high[i] - high[i-1] : 0
        sum_plusDM := sum_plusDM + plusDM
        minusDM = low[i-1] - low[i] > high[i] - high[i-1] and low[i-1] - low[i] > 0 ? low[i-1] - low[i] : 0
        sum_minusDM := sum_minusDM + minusDM
    plusDI = sum_plusDM / sum_truerange * 100
    minusDI = sum_minusDM / sum_truerange * 100
    sumDI = plusDI + minusDI
    adx_value = 100 * (plusDI - minusDI) / (sumDI == 0 ? 1 : sumDI)

// Calculate indicators
gm_8 = ta.sma(close, gm_period)
second_ema = ta.ema(close, second_ema_period)
adx_value = adx(high, low, close, adx_period)

// Define buy and sell conditions
buy_condition = ta.crossover(close, gm_8) and close > gm_8 and close > second_ema and adx_value > adx_threshold
sell_condition = ta.crossunder(close, gm_8) and close < gm_8 and close < second_ema and adx_value > adx_threshold

// Entry and exit logic
if (buy_condition)
    strategy.entry("Buy", strategy.long, qty=lot_size)

if (sell_condition)
    strategy.entry("Sell", strategy.short, qty=lot_size)

// Exit conditions
exit_buy_condition = ta.crossunder(close, gm_8) and close < gm_8
exit_sell_condition = ta.crossover(close, gm_8) and close > gm_8

if (exit_buy_condition)
    strategy.close("Buy")

if (exit_sell_condition)
    strategy.close("Sell")
Published by ChaoZhang on the FMZ strategy square · last modified 2024-04-30. Collected in the Quant Trading Vault. Unvalidated research: re-test with your own data and costs before trusting it.
Build this with AgenKit
A spec is not a trading system. Paste this into your coding agent and AgenKit runs a specialist team — architecture, test-first build, risk gates, review — with paper trading on by default.
/agenkit build a production-grade trading bot with a backtest engine, risk controls and paper trading by default from strategies/GM-8-ADX-Dual-Moving-Average-Strategy.md- npx agenkit install engineering-kit in your project
- Paste the command into your agent and approve each phase
- Get tests, backtest, risk controls and a paper-trading switch
Understand it first
Before you run this, read the lesson behind the idea and how to backtest it honestly. Specs like this one are the survivors of an unknown number of trials; deflate their results accordingly.
Related specs
- Advanced Momentum EMA Trend Following with RSI Overbought Oversold Trading StrategyPine Script · Mean reversion · 1d
- Moving Average Envelopes Trading StrategyPine Script · Mean reversion · 1h
- Reversal Trading Strategy with Bollinger Bands RSI ADX and ATRPine Script · Mean reversion · 1h
- Trend Reversal Momentum Indicators Crossover Tracking StrategyPine Script · Mean reversion · 1h
- Dual Indicator Slight Reversal Trading StrategyPine Script · Mean reversion · 15m
- Combo Trading Strategy Based on 123 Reversal and MACDPine Script · Mean reversion · 30m