Strategy vault / Trend following
Gradual Moving Average Trend Following Strategy
The Gradual Moving Average Trend Following Strategy uses multiple moving averages of different periods to capture price trend changes, combined with oscillator indicators to determine overbought and oversold areas…
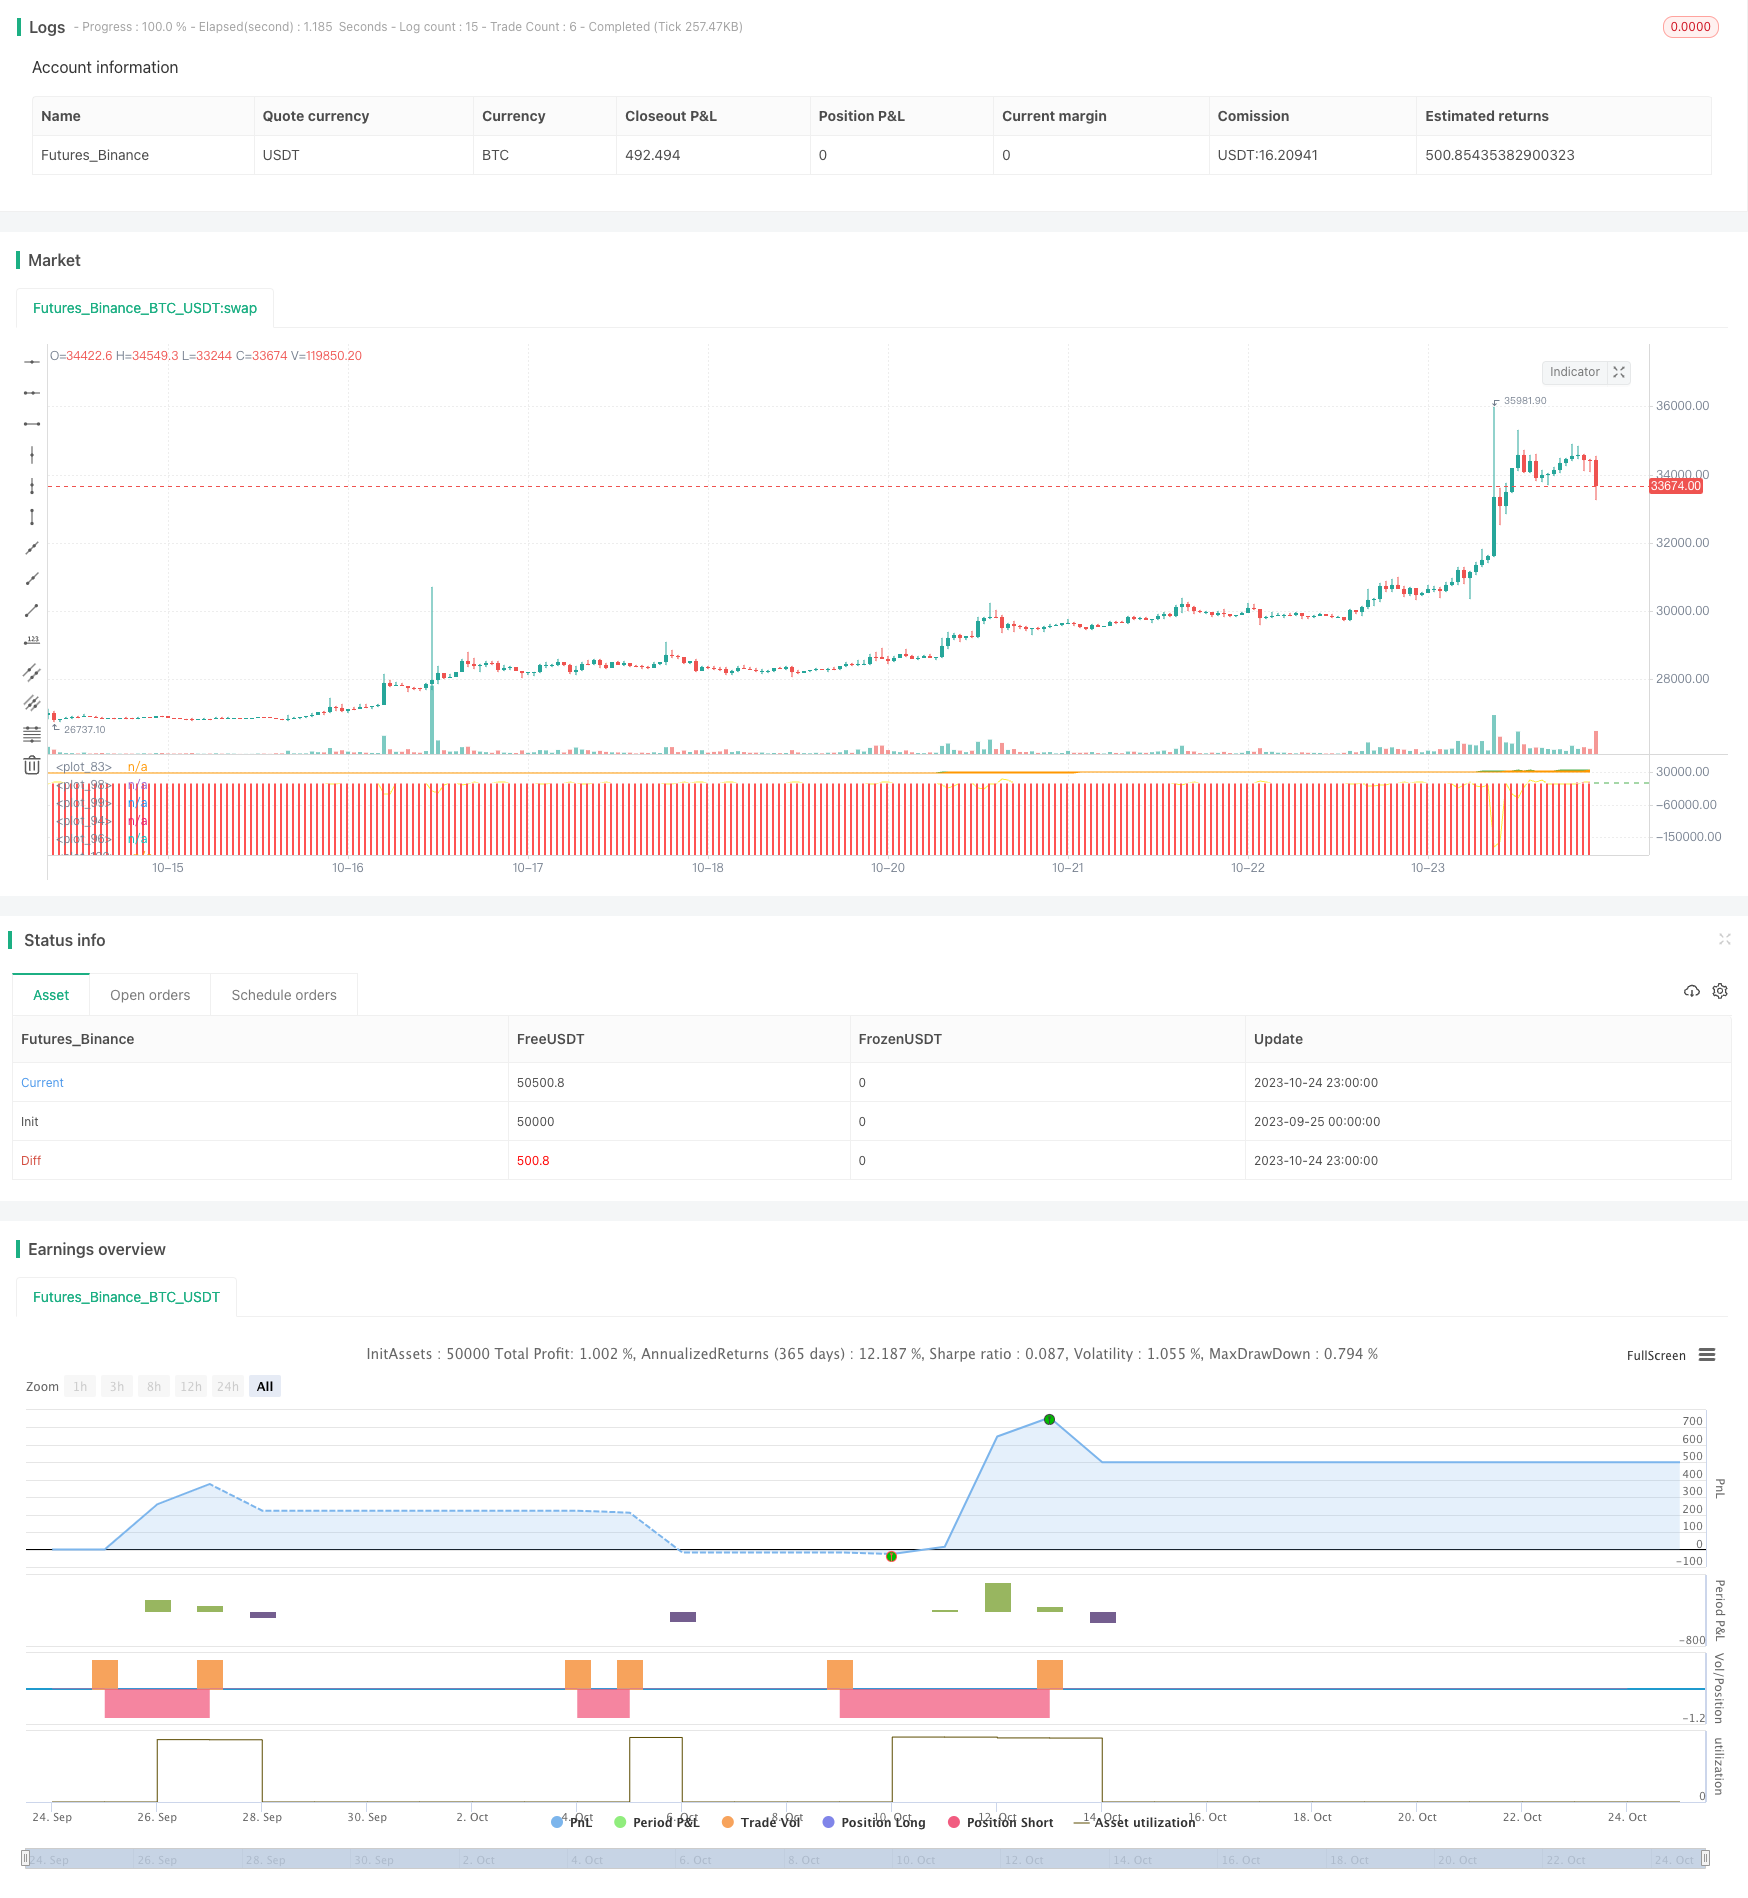
Overview
The Gradual Moving Average Trend Following Strategy uses multiple moving averages of different periods to capture price trend changes, combined with oscillator indicators to determine overbought and oversold areas, forming a low-buying and high-selling trend following trading strategy. This strategy is suitable for medium-to-long term holding positions to track significant trending markets.
Strategy Logic
The strategy employs multiple sets of moving averages, like 18-, 26-, 36-period MAs, to capture price trends. When shorter MAs cross above longer MAs, it signals an upward trend, thus going long. When shorter MAs cross below longer MAs, it indicates a downward trend, thus going short.
Meanwhile, oscillator indicators like MACD, RSI, EFI are used to identify overbought and oversold conditions. For example, MACD turning from negative to positive suggests going long, while turning from positive to negative suggests going short. RSI retreating from high levels is a signal for shorting, while rebounding from low levels is a signal for going long. EFI below 0 means going long, while above 0 means going short.
Entry rules:
Long: Short MA crossover up Long MA AND MACD>0 AND RSI rebounds from lows AND EFI<0
Short: Short MA crossover down Long MA AND MACD<0 AND RSI retreats from highs AND EFI>0
Stop loss rules:
Long SL: EFI above threshold AND price breaks below specified MA
Short SL: EFI below threshold AND price breaks above specified MA
Advantages
Multiple MAs capture major trend change points.
Oscillator combos avoid chasing highs and selling lows.
SL rules consider both trends and money flow, effectively controlling risks.
Optimized parameters through extensive backtesting, adaptive to most market environments.
Medium trading frequency, stable signals, suitable for long-term trend tracking.
Risks
Sudden crashes may invalidate SL, SL range should be widened.
Too many signals during ranging markets, parameters should be adjusted.
Holding too long may amplify losses, shorter MAs can take quicker SL.
Backtest overfitting, real trading results pending validation.
Improvements
Optimize parameters for higher returns and suitable frequency.
Add machine learning algorithms to dynamically optimize parameters.
Build adaptive SL mechanism based on different market conditions.
Add more filters to determine better entry signals.
Incorporate position sizing strategies to control single bet size.
Conclusion
The Gradual Moving Average Trend Following Strategy effectively tracks major trends by identifying the trend direction with multiple MAs and entering on filtered signals, achieving stable profits through long-term holding. The strategy has shown robustness through parameter optimization but still requires improvements in risk control and adaptivity to reduce drawdowns and increase win rate. Overall, the core philosophy demonstrates strong potential for further research and application.
Parameters
| Name | Default | What it controls |
|---|---|---|
| v_input_1 | 58 | longitud_sma |
| v_input_int_1 | 18 | Length1 |
| v_input_int_2 | 18 | Length2 |
| v_input_int_3 | 26 | Length3 |
| v_input_int_4 | 36 | Length4 |
| v_input_int_5 | 78 | Length5 |
| v_input_int_6 | true | Length6 |
| v_input_int_7 | 1500 | Length7 |
| v_input_int_8 | 58 | Length8 |
| v_input_int_9 | 3000 | Length9 |
| v_input_int_10 | 2 | Length10 |
| v_input_int_11 | 14 | Length11 |
Source Pine Script
/*backtest
start: 2023-09-25 00:00:00
end: 2023-10-25 00:00:00
period: 1h
basePeriod: 15m
exchanges: [{"eid":"Futures_Binance","currency":"BTC_USDT"}]
*/

// This source code is subject to the terms of the Mozilla Public License 2.0 at https://mozilla.org/MPL/2.0/
// © murdocksilva

//@version=5

strategy("Daily_Mid Term_Consulting BOLT")

//calculo longuitud
longuitud = input(58, title= "longitud_sma")


px = ta.sma(close, 1)
px2 = ta.sma(low, 1)

Length1 = input.int(18)
Length2 = input.int(18)
Length3 = input.int(26)
Length4 = input.int(36)
Length5 = input.int(78)
Length6 = input.int(1)
Length7 = input.int(1500)
Length8 = input.int(58)
Length9 = input.int(3000)
Length10 = input.int(2)
Length11 = input.int(14)
ma1 = ta.sma(low, Length1)
ma2 = ta.sma(high, Length2)
ma3 = ta.sma(close, Length3)
ma4 = ta.sma(close, Length4)
ma5 = ta.sma(close, Length5)
ma6 = ta.sma(close, Length6)
ma7 = ta.sma(close, Length7)
ma8 = ta.sma(close, Length8)
ma9 = ta.sma(close, Length9)
ma10 = ta.sma(close, Length10)
ma11 = ta.sma(close, Length11)

// calculo EFI
efi = (close[1]-close) * volume / 1000
efi_indicador = (efi[1] + efi) / 2

//Variable  RSI - calculo desv estandar
b = (px-ma10)*(px-ma10)
b2 = (px[1]-ma10[1])*(px[1]-ma10[1])
c = b + b2
c2 = c / 2
desv = math.sqrt(c2)/10

//calculo MACD
macd = ma4 - ma5

//calculo RSI
rsi = ta.rsi(close, 9)

// calculo Divergencia
ma = ta.sma(close, longuitud)
dist = close - ma
porcentaje = dist * 100 / close
ma_dista = ta.sma(porcentaje, 333)

//condición de entrada y salida long
long = ma1[1] < ma1 and ma2[1] < ma2 and macd > 0 and px > ma3 and efi_indicador < 9 and px > ma7 and macd[1] < macd
clong = efi_indicador > 22000 and px < ma8
strategy.entry("BUY", strategy.long, when = long)
strategy.close("BUY", when = clong)

//condición de entrada y salida short
short = ma1[1] > ma1 and ma2[1] > ma2 and macd < 0 and px < ma3 and efi_indicador > 9 and macd[1] > macd
cshort =  efi_indicador < 14000 and px > ma8 and ma11 > desv
strategy.entry("SELL", strategy.short, when = short)
strategy.close("SELL", when = cshort)

//SL Y TP
//strategy.exit("long exit", "Daily_Mid Term_Consulting BOLT", profit = close * 40 / syminfo.mintick, loss = close * 0.02 / syminfo.mintick)
//strategy.exit("shot exit", "Daily_Mid Term_Consulting BOLT", profit = close * 40 / syminfo.mintick, loss = close * 0.02 / syminfo.mintick)

// GRAFICA smas
plot(ma1, color=color.new(color.orange, 0))
plot(ma2, color=color.new(color.orange, 0))
plot(ma3, color=color.new(color.orange, 0))
plot(ma4, color=color.new(color.orange, 0))
plot(ma5, color=color.new(color.orange, 0))
plot(ma6, color=color.new(color.green, 0))
plot(ma7, color=color.new(color.orange, 0))
plot(ma8, color=color.new(color.orange, 0))
plot(ma9, color=color.new(color.orange, 0))
//GRAFICA MACD
plot(macd, color=color.new(color.red, 0), style = plot.style_columns)
//GRAFICA DIVERGENCIA
plot(porcentaje, style = plot.style_columns)
//GRAFICA MA DIVERGENCIA
plot(ma_dista, color=color.new(color.white, 0))
//GRAFICA MA DIVERGENCIA
plot(desv, color=color.new(color.blue, 0))
//GRAFICA EFI
plot(efi_indicador, color=color.new(color.yellow, 0))
// GRAFICA RSI
l1 = hline(70, color=color.new(color.green, 0))
l2 = hline(30, color=color.new(color.green, 0))
plot(rsi, color=color.new(color.white, 0))


//prueba 1 stop loss and take profit
//sl = 0.05
//tp = 0.1
//calculo de precio para sl y tp
//longstop=strategy.position_avg_price*(1-sl)
//longprofit=strategy.position_avg_price*(1+tp)

//shortstop=strategy.position_avg_price*(1+sl)
//shortprofit=strategy.position_avg_price*(1-tp)

//if (long)
  //  strategy.exit("BUY", strategy.long)

//sl and tp  long|short
//if strategy.entry("BUY", strategy.long)

//if strategy.position_avg_price > 0
//strategy.exit("BUY", limit = longprofit, stop = longstop)

//if strategy.position_avg_price < 0
//strategy.exit("SELL", limit = shortprofit, stop=shortstop)Published by ChaoZhang on the FMZ strategy square · last modified 2023-10-26. Collected in the Quant Trading Vault. Unvalidated research: re-test with your own data and costs before trusting it.
Build this with AgenKit
A spec is not a trading system. Paste this into your coding agent and AgenKit runs a specialist team — architecture, test-first build, risk gates, review — with paper trading on by default.
/agenkit build a production-grade trading bot with a backtest engine, risk controls and paper trading by default from strategies/Gradual-Moving-Average-Trend-Following-Strategy.md- npx agenkit install engineering-kit in your project
- Paste the command into your agent and approve each phase
- Get tests, backtest, risk controls and a paper-trading switch
Understand it first
Before you run this, read the lesson behind the idea and how to backtest it honestly. Specs like this one are the survivors of an unknown number of trials; deflate their results accordingly.
Related specs
- Bollinger Bands and RSI Trend Following StrategyPine Script · Trend following · 1h
- Dual ATR Channel Trend Following StrategyPine Script · Trend following · 15m
- Dual SMA Crossover StrategyPine Script · Trend following · 5m
- Dynamic Dual EMA Crossover Strategy with Adaptive Profit Loss ControlPine Script · Trend following · 1d
- EMA SMA Multi Indicator Comprehensive Trend Following StrategyPine Script · Trend following · 1h
- EMA and RSI Trend Trading StrategyPine Script · Trend following · 1d