Strategy vault / Trend following
HALFTREND HEMA SMA FALSE SIGNALs STRATEGY
=== INTRO and CREDITS === This script is a mix of 3 indicators in order to recreate FALSE SIGNAL's strategy from YouTube. First indicator is a SMA ( Simple Moving Average ). Second is the Hull Estimate (HEMA), which…
=== INTRO and CREDITS === This script is a mix of 3 indicators in order to recreate FALSE SIGNAL's strategy from YouTube. First indicator is a SMA ( Simple Moving Average ). Second is the Hull Estimate (HEMA), which was developed by alexgrover. And third is the Halftrend, by Alex Orekhov (everget). Credit for each indicator belongs to them, i just modified those and the SMA to make FALSE SIGNAL's strategy with some extra options, settings, etc, also updated all the code to PineScript 5.
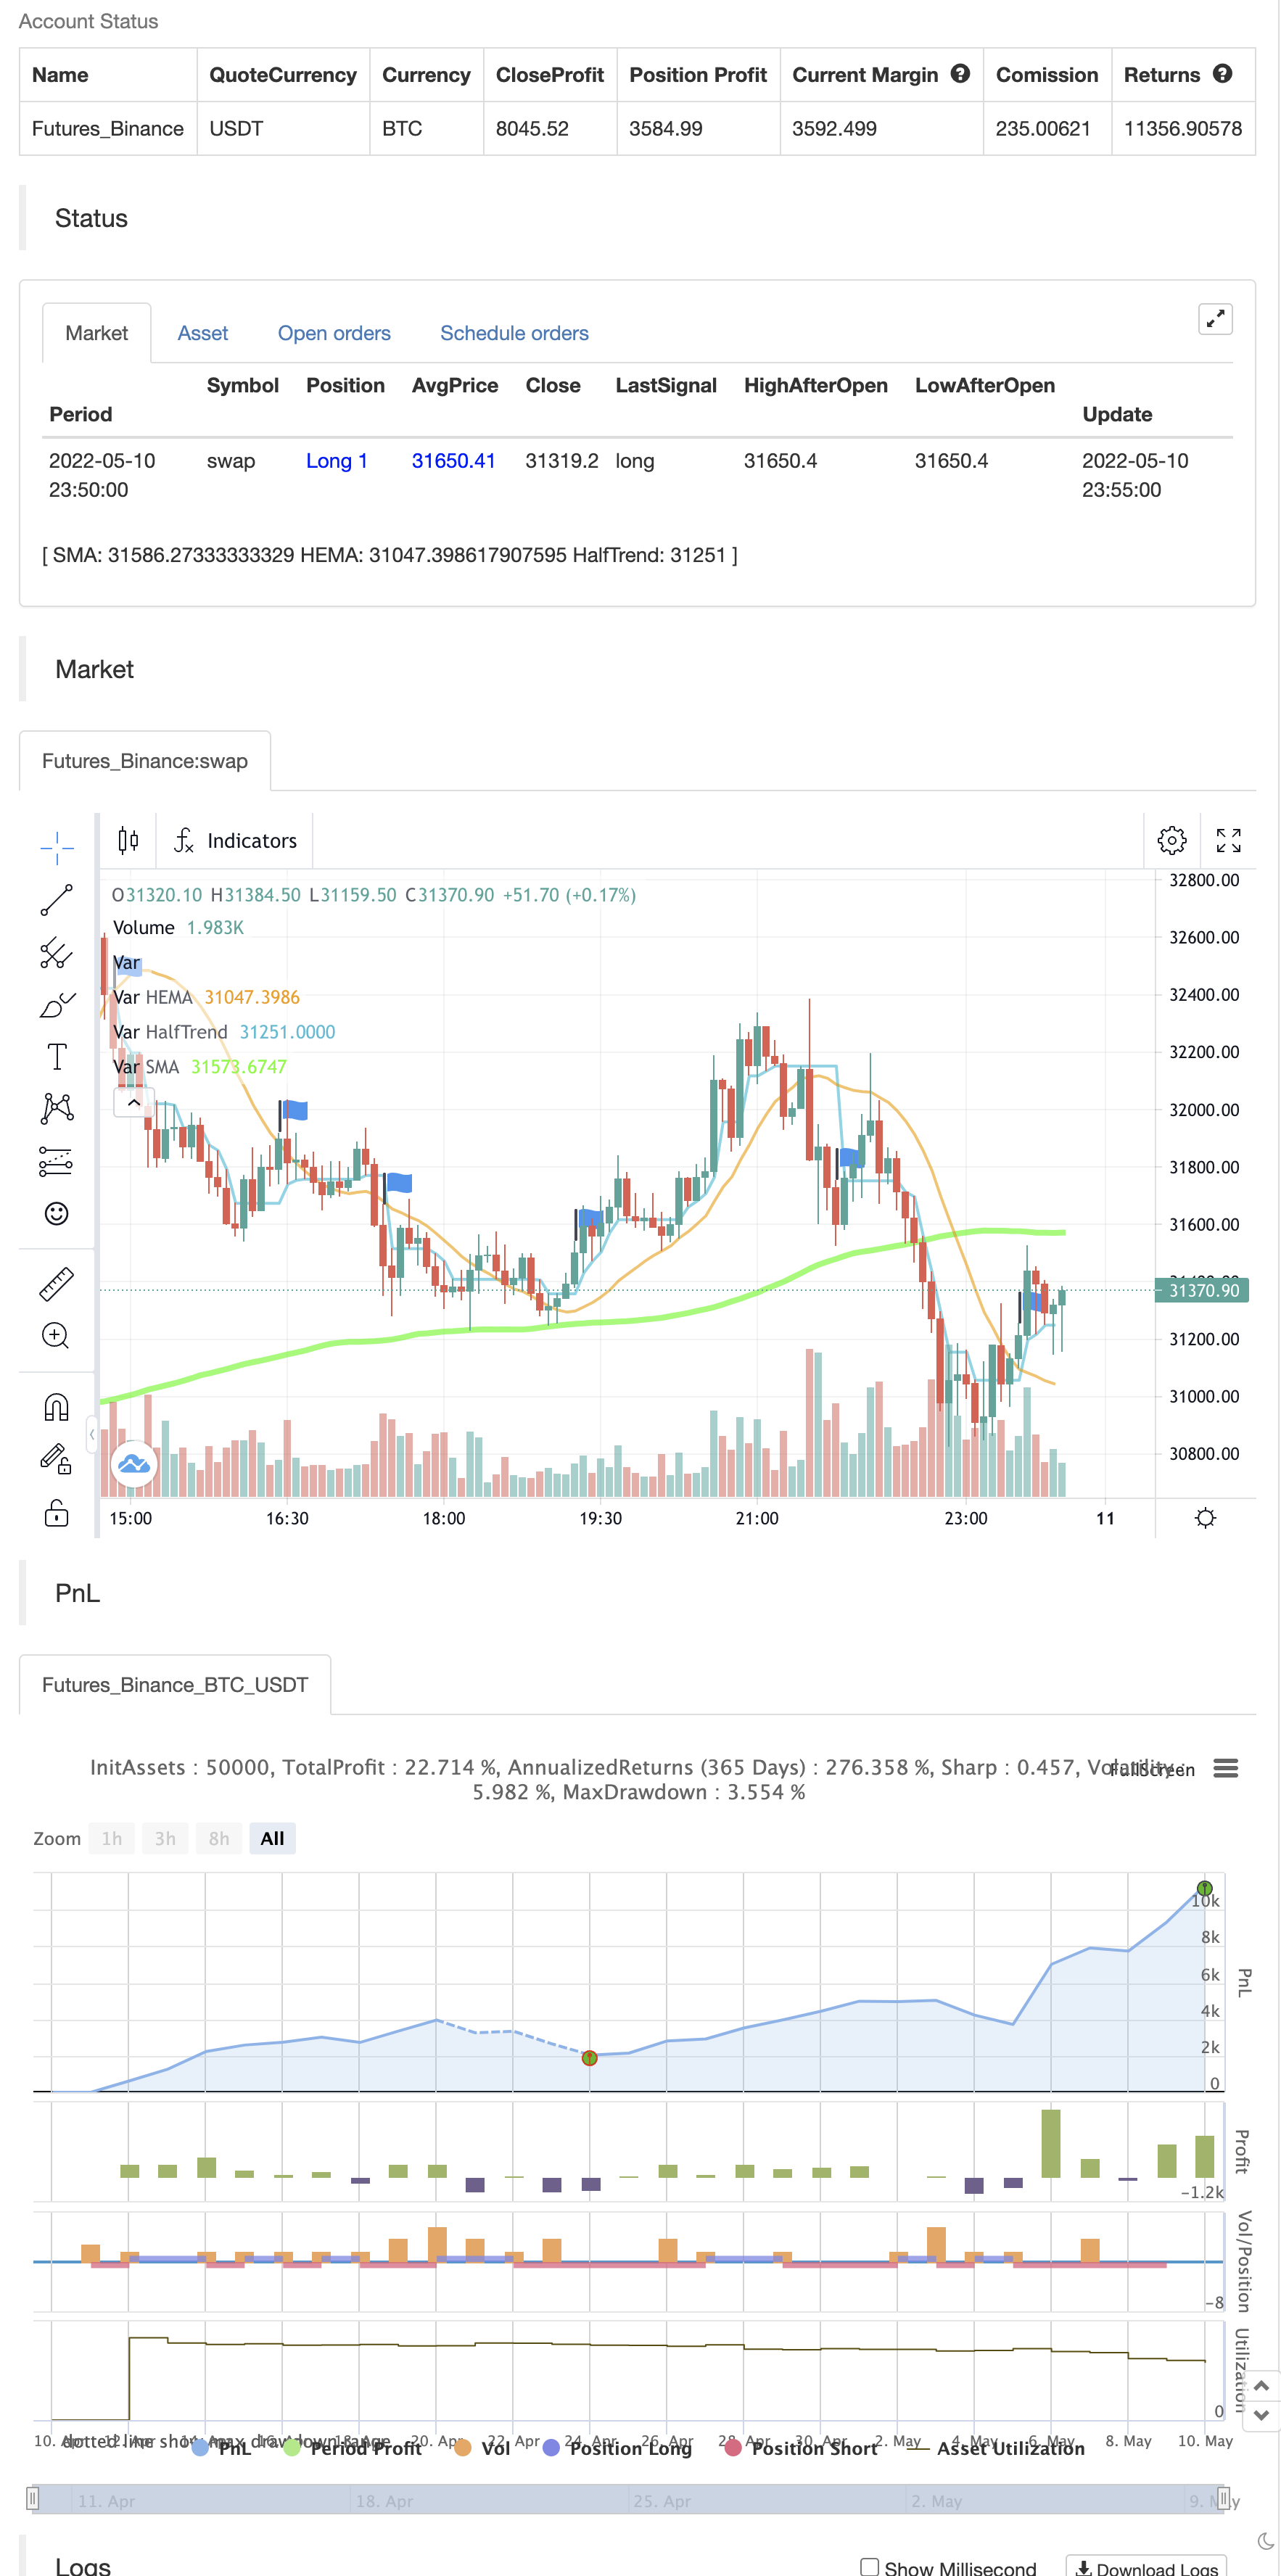
=== THE STRATEGY === Default settings are already as FALSE SIGNAL's requires so you don't have to change anything. FOR LONGS (green background shows LONG entries).
- HEMA must be above the SMA .
- The body of the candle must be completely above the HEMA (wick can touch the HEMA, but there's an option to enable/disable this filter).
- Halftrend must trigger a BUY arrow (aqua color looking upwards).
FOR SHORTS (redbackground shows SHORT entries).
- HEMA* must be below the SMA .
- The body of the candle must be completely below the HEMA (wick can touch the HEMA, but there's an option to enable/disable this filter).
- Halftrend must trigger a SELL arrow (orange color looking downwards). *FALSE SIGNAL suggests to change HEMA period to 40 for shorts instead of 50.
Please check FALSE SIGNAL's YouTube channel for more info.
=== GENERAL IMPROVEMENTS === Upgrade to PineScript 5. Some performance improvements. SMA takes GREEN color when only LONGs should be taken, RED color for SHORTs. HEMA take AQUA color when only LONGs should be taken, ORANGE color for SHORTs.
=== PERSONAL NOTES === High timeframes (1h+) can take long time to trigger entries, be patient or use lower timeframes.
Thanks again to the authors of the indicators that compose this script and to FALSE SINGAL to create this strategy.
backtest
Parameters
| Name | Default | What it controls |
|---|---|---|
| v_input_bool_1 | false | (?Strategy)Full candle must be outside the HEMA / Wicks can touch the HEMA but body must be out |
| v_input_int_1 | 150 | (?Simple Moving Average SMA)Length |
| v_input_1_close | 0 | Source: close | high | low | open | hl2 | hlc3 | hlcc4 | ohlc4 |
| v_input_int_2 | 6 | Offset |
| v_input_int_3 | 50 | (?Hull Estimate HEMA)Length |
| v_input_2 | true | (?Halftrend)Amplitude |
| v_input_3 | 2 | Channel Deviation |
| v_input_4 | true | Show Arrows |
| v_input_5 | false | Show Channels |
Source Pine Script
/*backtest
start: 2022-04-11 00:00:00
end: 2022-05-10 23:59:00
period: 5m
basePeriod: 1m
exchanges: [{"eid":"Futures_Binance","currency":"BTC_USDT"}]
*/

// Source code is subject to the terms of the Mozilla Public License 2.0 at https://mozilla.org/MPL/2.0/ - © José Manuel Gassin Pérez-Traverso
// Credit for each indicator belongs to its author.

//@version=5
indicator(title="HALFTREND + HEMA + SMA (FALSE SIGNAL)", shorttitle="HALFTREND + HEMA + SMA (FALSE SIGNAL)", overlay=true)


//== Constantes
c_negro               = color.rgb(0, 0, 0, 0)
c_verde_radiactivo    = color.rgb(0, 255, 0, 0)
c_verde               = color.rgb(0, 128, 0, 0)
c_verde_oscuro        = color.rgb(0, 80, 0, 0)
c_rojo_radiactivo     = color.rgb(255, 0, 0, 0)
c_rojo                = color.rgb(128, 0, 0, 0)
c_rojo_oscuro         = color.rgb(80, 0, 0, 0)
c_red_t               = color.new(color.red, 90)
c_amarillo            = color.rgb(255, 255, 0, 0)
noneColor             = color.new(color.white, 100)


//== Estrategia
GRUPO_ESTRATEGIA = "Strategy"
ESTRATEGIA_vela_completa_fuera_hema = input.bool(title="Full candle must be outside the HEMA / Wicks can touch the HEMA but body must be out", defval=false, group=GRUPO_ESTRATEGIA)

//== Simple Moving Average (SMA)
GRUPO_SMA = "Simple Moving Average (SMA)"
len = input.int(150, minval=1, title="Length", group=GRUPO_SMA)
src = input(close, title="Source", group=GRUPO_SMA)
offset = input.int(title="Offset", defval=6, minval=-500, maxval=500, group=GRUPO_SMA)
sma = ta.sma(src, len)


//== Hull Estimate (HEMA) - Source code is subject to the terms of the Mozilla Public License 2.0 at https://mozilla.org/MPL/2.0/ - © alexgrover
GRUPO_HEMA = "Hull Estimate (HEMA)"
length = input.int(title="Length", defval=50, minval=1, group=GRUPO_HEMA)
hema = 3 * ta.wma(close, length / 2) - 2 * ta.ema(close, length / 2)


//== HALFTREND - Copyright (c) 2021-present, Alex Orekhov (everget)
GRUPO_HT = "Halftrend"
amplitude = input(title='Amplitude', defval=1, group=GRUPO_HT)
channelDeviation = input(title='Channel Deviation', defval=2, group=GRUPO_HT)
showArrows = input(title='Show Arrows', defval=true, group=GRUPO_HT)
showChannels = input(title='Show Channels', defval=false, group=GRUPO_HT)

var int trend = 0
var int nextTrend = 0
var float maxLowPrice = nz(low[1], low)
var float minHighPrice = nz(high[1], high)

var float up = 0.0
var float down = 0.0
float atrHigh = 0.0
float atrLow = 0.0
float arrowUp = na
float arrowDown = na

atr2 = ta.atr(100) / 2
dev = channelDeviation * atr2

highPrice = high[math.abs(ta.highestbars(amplitude))]
lowPrice = low[math.abs(ta.lowestbars(amplitude))]
highma = ta.sma(high, amplitude)
lowma = ta.sma(low, amplitude)

if nextTrend == 1
    maxLowPrice := math.max(lowPrice, maxLowPrice)

    if highma < maxLowPrice and close < nz(low[1], low)
        trend := 1
        nextTrend := 0
        minHighPrice := highPrice
        minHighPrice
else
    minHighPrice := math.min(highPrice, minHighPrice)

    if lowma > minHighPrice and close > nz(high[1], high)
        trend := 0
        nextTrend := 1
        maxLowPrice := lowPrice
        maxLowPrice

if trend == 0
    if not na(trend[1]) and trend[1] != 0
        up := na(down[1]) ? down : down[1]
        arrowUp := up - atr2
        arrowUp
    else
        up := na(up[1]) ? maxLowPrice : math.max(maxLowPrice, up[1])
        up
    atrHigh := up + dev
    atrLow := up - dev
    atrLow
else
    if not na(trend[1]) and trend[1] != 1
        down := na(up[1]) ? up : up[1]
        arrowDown := down + atr2
        arrowDown
    else
        down := na(down[1]) ? minHighPrice : math.min(minHighPrice, down[1])
        down
    atrHigh := down + dev
    atrLow := down - dev
    atrLow

ht = trend == 0 ? up : down

var color buyColor = color.aqua
var color sellColor = color.orange

htColor = trend == 0 ? buyColor : sellColor

buySignal = not na(arrowUp) and trend == 0 and trend[1] == 1
sellSignal = not na(arrowDown) and trend == 1 and trend[1] == 0


//== Plots
// SMA
sma_color = ohlc4 > sma ? c_verde_radiactivo : c_rojo_radiactivo
plot(sma, title="SMA", color=sma_color, linewidth=4, offset=offset)

// HEMA
hema_color = hema > sma ? color.aqua : color.orange
plot(hema, title="HEMA", color=hema_color, linewidth=2)

// HALFTREND
htPlot = plot(ht, title='HalfTrend', linewidth=2, color=htColor, display=display.none)
atrHighPlot = plot(showChannels ? atrHigh : na, title='ATR High', style=plot.style_circles, color=color.new(sellColor, 0))
atrLowPlot = plot(showChannels ? atrLow : na, title='ATR Low', style=plot.style_circles, color=color.new(buyColor, 0))
fill(htPlot, atrHighPlot, title='ATR High Ribbon', color=color.new(sellColor, 90))
fill(htPlot, atrLowPlot, title='ATR Low Ribbon', color=color.new(buyColor, 90))
plotshape(showArrows and buySignal ? atrLow : na, title='Arrow Up', style=shape.triangleup, location=location.absolute, size=size.tiny, color=color.new(buyColor, 0))
plotshape(showArrows and sellSignal ? atrHigh : na, title='Arrow Down', style=shape.triangledown, location=location.absolute, size=size.tiny, color=color.new(sellColor, 0))

//== Señales estrategia
min = ESTRATEGIA_vela_completa_fuera_hema ? low : math.min(open, close)
max = ESTRATEGIA_vela_completa_fuera_hema ? high : math.max(open, close)
long_sma_y_hema  = hema > sma
short_sma_y_hema = hema < sma
long_halftrend   = buySignal
short_halftrend  = sellSignal
long_vela        = min > hema and max > hema
short_vela       = min < hema and max < hema
long = long_sma_y_hema and long_halftrend and long_vela
short = short_sma_y_hema and short_halftrend and short_vela
color_fondo = long ? color.new(color.lime, 85) : short ? color.new(color.red, 80) : noneColor
bgcolor(color_fondo)


//== Alertas
alertcondition(long, title="▶ LONG", message="[{{exchange}}:{{ticker}}] LONG ENTRY")
alertcondition(short, title="▶ SHORT", message="[{{exchange}}:{{ticker}}] SHORT ENTRY")


if long
    strategy.entry("Enter Long", strategy.long)
else if short
strategy.entry("Enter Short", strategy.short)Published by ChaoZhang on the FMZ strategy square · last modified 2022-05-12. Collected in the Quant Trading Vault. Unvalidated research: re-test with your own data and costs before trusting it.
Build this with AgenKit
A spec is not a trading system. Paste this into your coding agent and AgenKit runs a specialist team — architecture, test-first build, risk gates, review — with paper trading on by default.
/agenkit build a production-grade trading bot with a backtest engine, risk controls and paper trading by default from strategies/HALFTREND-HEMA-SMA-FALSE-SIGNALs-STRATEGY.md- npx agenkit install engineering-kit in your project
- Paste the command into your agent and approve each phase
- Get tests, backtest, risk controls and a paper-trading switch
Understand it first
Before you run this, read the lesson behind the idea and how to backtest it honestly. Specs like this one are the survivors of an unknown number of trials; deflate their results accordingly.
Related specs
- ATR and Moving Average Crossover Hybrid StrategyPine Script · Trend following · 1h
- Bollinger Bands and RSI Trend Following StrategyPine Script · Trend following · 1h
- Dual ATR Channel Trend Following StrategyPine Script · Trend following · 15m
- Dual MA Crossover Trend Tracking StrategyPine Script · Trend following · 1h
- Dual Mode Adaptive Trend Trading Strategy EMA Crossover with ATR Volatility Based Risk Management SystemPine Script · Trend following · 1d
- Dual Moving Average Crossover Dynamic Position Optimization Strategy with EMA Cross Signal SystemPine Script · Trend following · 1h