High Frequency Volatility Breakout Trend Following Strategy
This strategy is a trend-following trading system that combines Bollinger Bands and Moving Average. It utilizes Bollinger Bands to capture price volatility breakouts while using Moving Average to confirm trend…
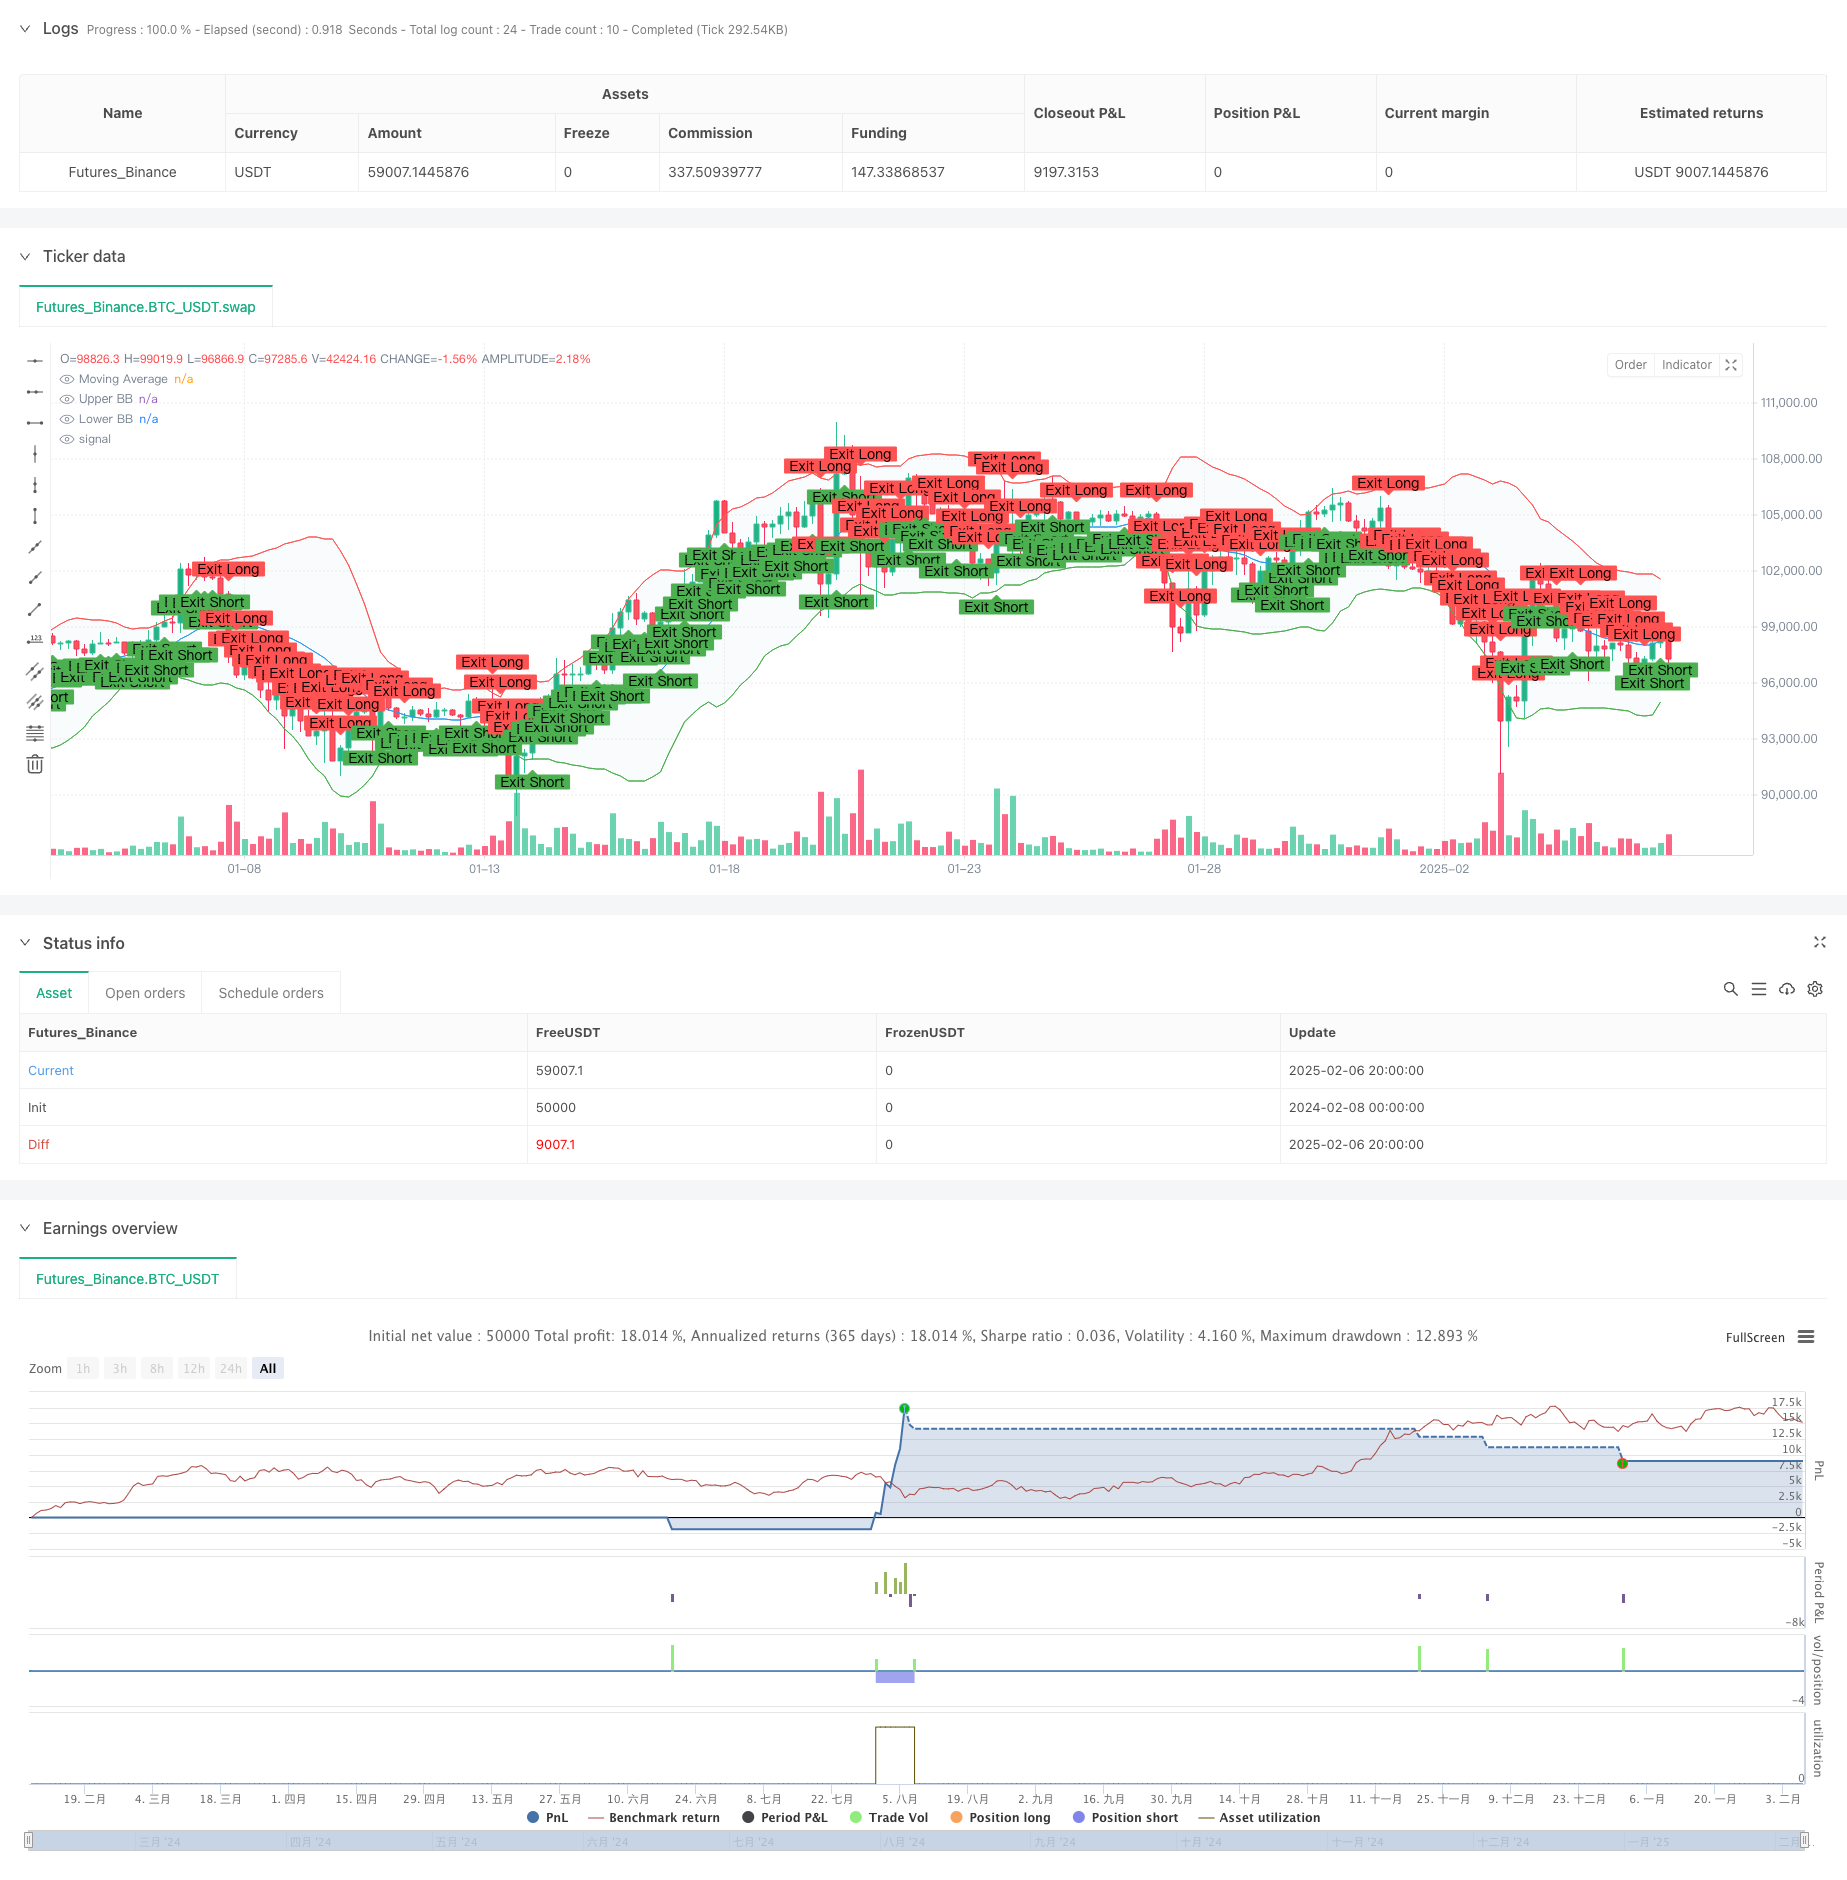
Overview
This strategy is a trend-following trading system that combines Bollinger Bands and Moving Average. It utilizes Bollinger Bands to capture price volatility breakouts while using Moving Average to confirm trend direction, forming a complete trading decision framework. The core concept requires price breakouts of Bollinger Bands to align with the Moving Average direction, creating a dual confirmation mechanism that effectively reduces false signals.
Strategy Principles
The strategy employs two core technical indicators:
- Bollinger Bands (BB): Composed of a middle band (20-period SMA) and upper/lower bands (middle band ±2 standard deviations), used to measure price volatility range.
- Moving Average (MA): Supports both Simple Moving Average (SMA) and Exponential Moving Average (EMA), used to confirm overall trend direction.
Trading signal generation logic:
- Long conditions: Price breaks above lower band and is above Moving Average
- Short conditions: Price breaks below upper band and is below Moving Average
- Exit conditions: Price crosses Moving Average or deviates from MA direction
Strategy Advantages
- Dual confirmation mechanism: Combining Bollinger Band breakouts and MA trend confirmation significantly improves signal reliability
- Strong adaptability: Bollinger Bands automatically adjust bandwidth based on market volatility
- High customizability: Supports adjustments to BB period and multiplier, and different MA types
- Robust risk control: Uses Moving Average as dynamic stop-loss, helping control drawdowns
Strategy Risks
- Choppy market risk: May generate frequent false breakout signals during consolidation phases
- Lag risk: Moving Average has inherent lag, potentially causing delayed entries or exits
- Trend reversal risk: Strategy may not respond quickly enough to sudden trend reversals
- Parameter sensitivity: Optimal parameters may vary significantly across different market environments
Optimization Directions
- Introduce trend strength filtering: Add indicators like ADX to increase positions in strong trends and reduce trading in weak trends
- Optimize stop-loss mechanism: Incorporate ATR for dynamic stop-loss levels, improving risk control flexibility
- Enhanced market environment analysis: Include volatility indicators like VIX for dynamic parameter adjustment
- Improve position management: Dynamically adjust position sizes based on volatility and trend strength
Summary
This is an innovative trend-following strategy combining classic technical indicators Bollinger Bands and Moving Average. It captures price breakout opportunities through Bollinger Bands while confirming trend direction with Moving Average, forming a logically rigorous trading system. The strategy demonstrates strong adaptability and customizability, but requires careful attention to market environment assessment and risk control in practical application. Through the suggested optimization directions, there is significant room for strategy enhancement.
Source Pine Script
/*backtest
start: 2024-02-08 00:00:00
end: 2025-02-07 00:00:00
period: 4h
basePeriod: 4h
exchanges: [{"eid":"Futures_Binance","currency":"BTC_USDT"}]
*/

//@version=5
strategy("Bollinger Bands + Moving Average Strategy", overlay=true, default_qty_type=strategy.percent_of_equity, default_qty_value=200)

// === Vstupy ===
// Moving Average
maPeriod = input.int(20, title="MA Period", minval=1)
maType = input.string("SMA", title="MA Type", options=["SMA", "EMA"])

// Bollinger Bands
bbPeriod = input.int(20, title="BB Period", minval=1)
bbMultiplier = input.float(2.0, title="BB Multiplier", step=0.1)

// === Výpočty Indikátorov ===
// Moving Average
ma = maType == "SMA" ? ta.sma(close, maPeriod) : ta.ema(close, maPeriod)

// Bollinger Bands
basis = ta.sma(close, bbPeriod)
dev = bbMultiplier * ta.stdev(close, bbPeriod)
upperBB = basis + dev
lowerBB = basis - dev

// === Podmienky Pre Vstupy ===
// Nákupný signál: Cena prekonáva dolný Bollinger Band smerom nahor a cena je nad MA
longCondition = ta.crossover(close, lowerBB) and close > ma

// Predajný signál: Cena prekonáva horný Bollinger Band smerom nadol a cena je pod MA
shortCondition = ta.crossunder(close, upperBB) and close < ma

// === Vstupné Signály ===
if (longCondition)
    strategy.entry("Long", strategy.long)

if (shortCondition)
    strategy.entry("Short", strategy.short)

// === Výstupné Podmienky ===
// Uzavretie Long pozície pri prekonaní MA smerom nadol alebo ceny pod MA
exitLongCondition = ta.crossunder(close, ma) or close < ma
if (exitLongCondition)
    strategy.close("Long")

// Uzavretie Short pozície pri prekonaní MA smerom nahor alebo ceny nad MA
exitShortCondition = ta.crossover(close, ma) or close > ma
if (exitShortCondition)
    strategy.close("Short")

// === Vykreslenie Indikátorov na Grafe ===
// Vykreslenie Moving Average
plot(ma, color=color.blue, title="Moving Average")

// Vykreslenie Bollinger Bands
upperPlot = plot(upperBB, color=color.red, title="Upper BB")
lowerPlot = plot(lowerBB, color=color.green, title="Lower BB")
fill(upperPlot, lowerPlot, color=color.rgb(173, 216, 230, 90), title="BB Fill")

// Vizualizácia Signálov
plotshape(series=longCondition, title="Long Entry", location=location.belowbar, color=color.green, style=shape.labelup, text="Long")
plotshape(series=shortCondition, title="Short Entry", location=location.abovebar, color=color.red, style=shape.labeldown, text="Short")
plotshape(series=exitLongCondition, title="Long Exit", location=location.abovebar, color=color.red, style=shape.labeldown, text="Exit Long")
plotshape(series=exitShortCondition, title="Short Exit", location=location.belowbar, color=color.green, style=shape.labelup, text="Exit Short")
Published by ChaoZhang on the FMZ strategy square · last modified 2025-02-08. Collected in the Quant Trading Vault. Unvalidated research: re-test with your own data and costs before trusting it.
Build this with AgenKit
A spec is not a trading system. Paste this into your coding agent and AgenKit runs a specialist team — architecture, test-first build, risk gates, review — with paper trading on by default.
/agenkit build a production-grade trading bot with a backtest engine, risk controls and paper trading by default from strategies/High-Frequency-Volatility-Breakout-Trend-Following-Strategy.md- npx agenkit install engineering-kit in your project
- Paste the command into your agent and approve each phase
- Get tests, backtest, risk controls and a paper-trading switch
Understand it first
Before you run this, read the lesson behind the idea and how to backtest it honestly. Specs like this one are the survivors of an unknown number of trials; deflate their results accordingly.
Related specs
- Momentum Breakout Trading Strategy 440964Pine Script · Breakout · 5m
- Moving Average Crossover and Upper Rail Breakthrough Impulse StrategyPine Script · Breakout · 1m
- Volatility Breakthrough StrategyPine Script · Breakout · 10m
- Multi Moving Average Supertrend with Bollinger Breakout Trading StrategyPine Script · Breakout · 1d
- Post Open Breakout Trading Strategy with Dynamic ATR Based Position ManagementPine Script · Breakout · 1h
- Triple Pattern Oscillation Trading StrategyPine Script · Breakout · 1h